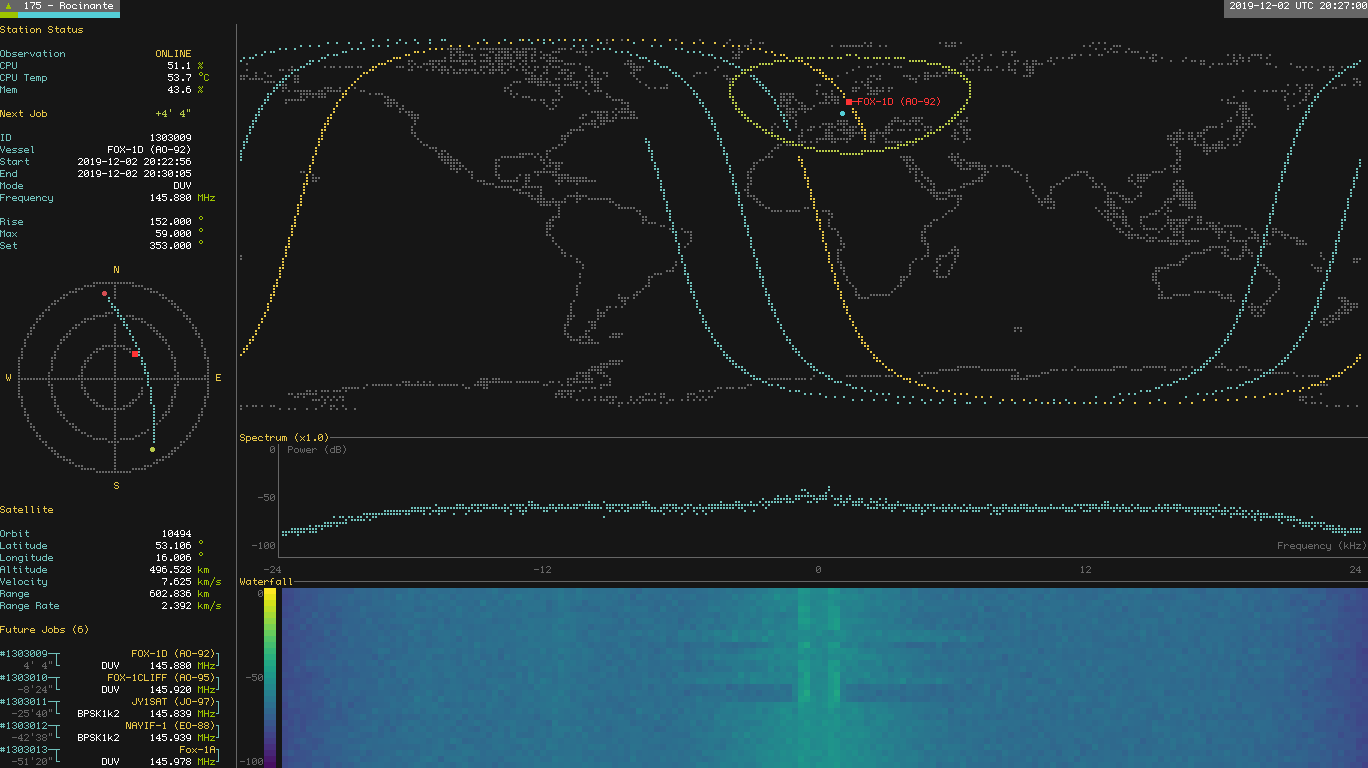
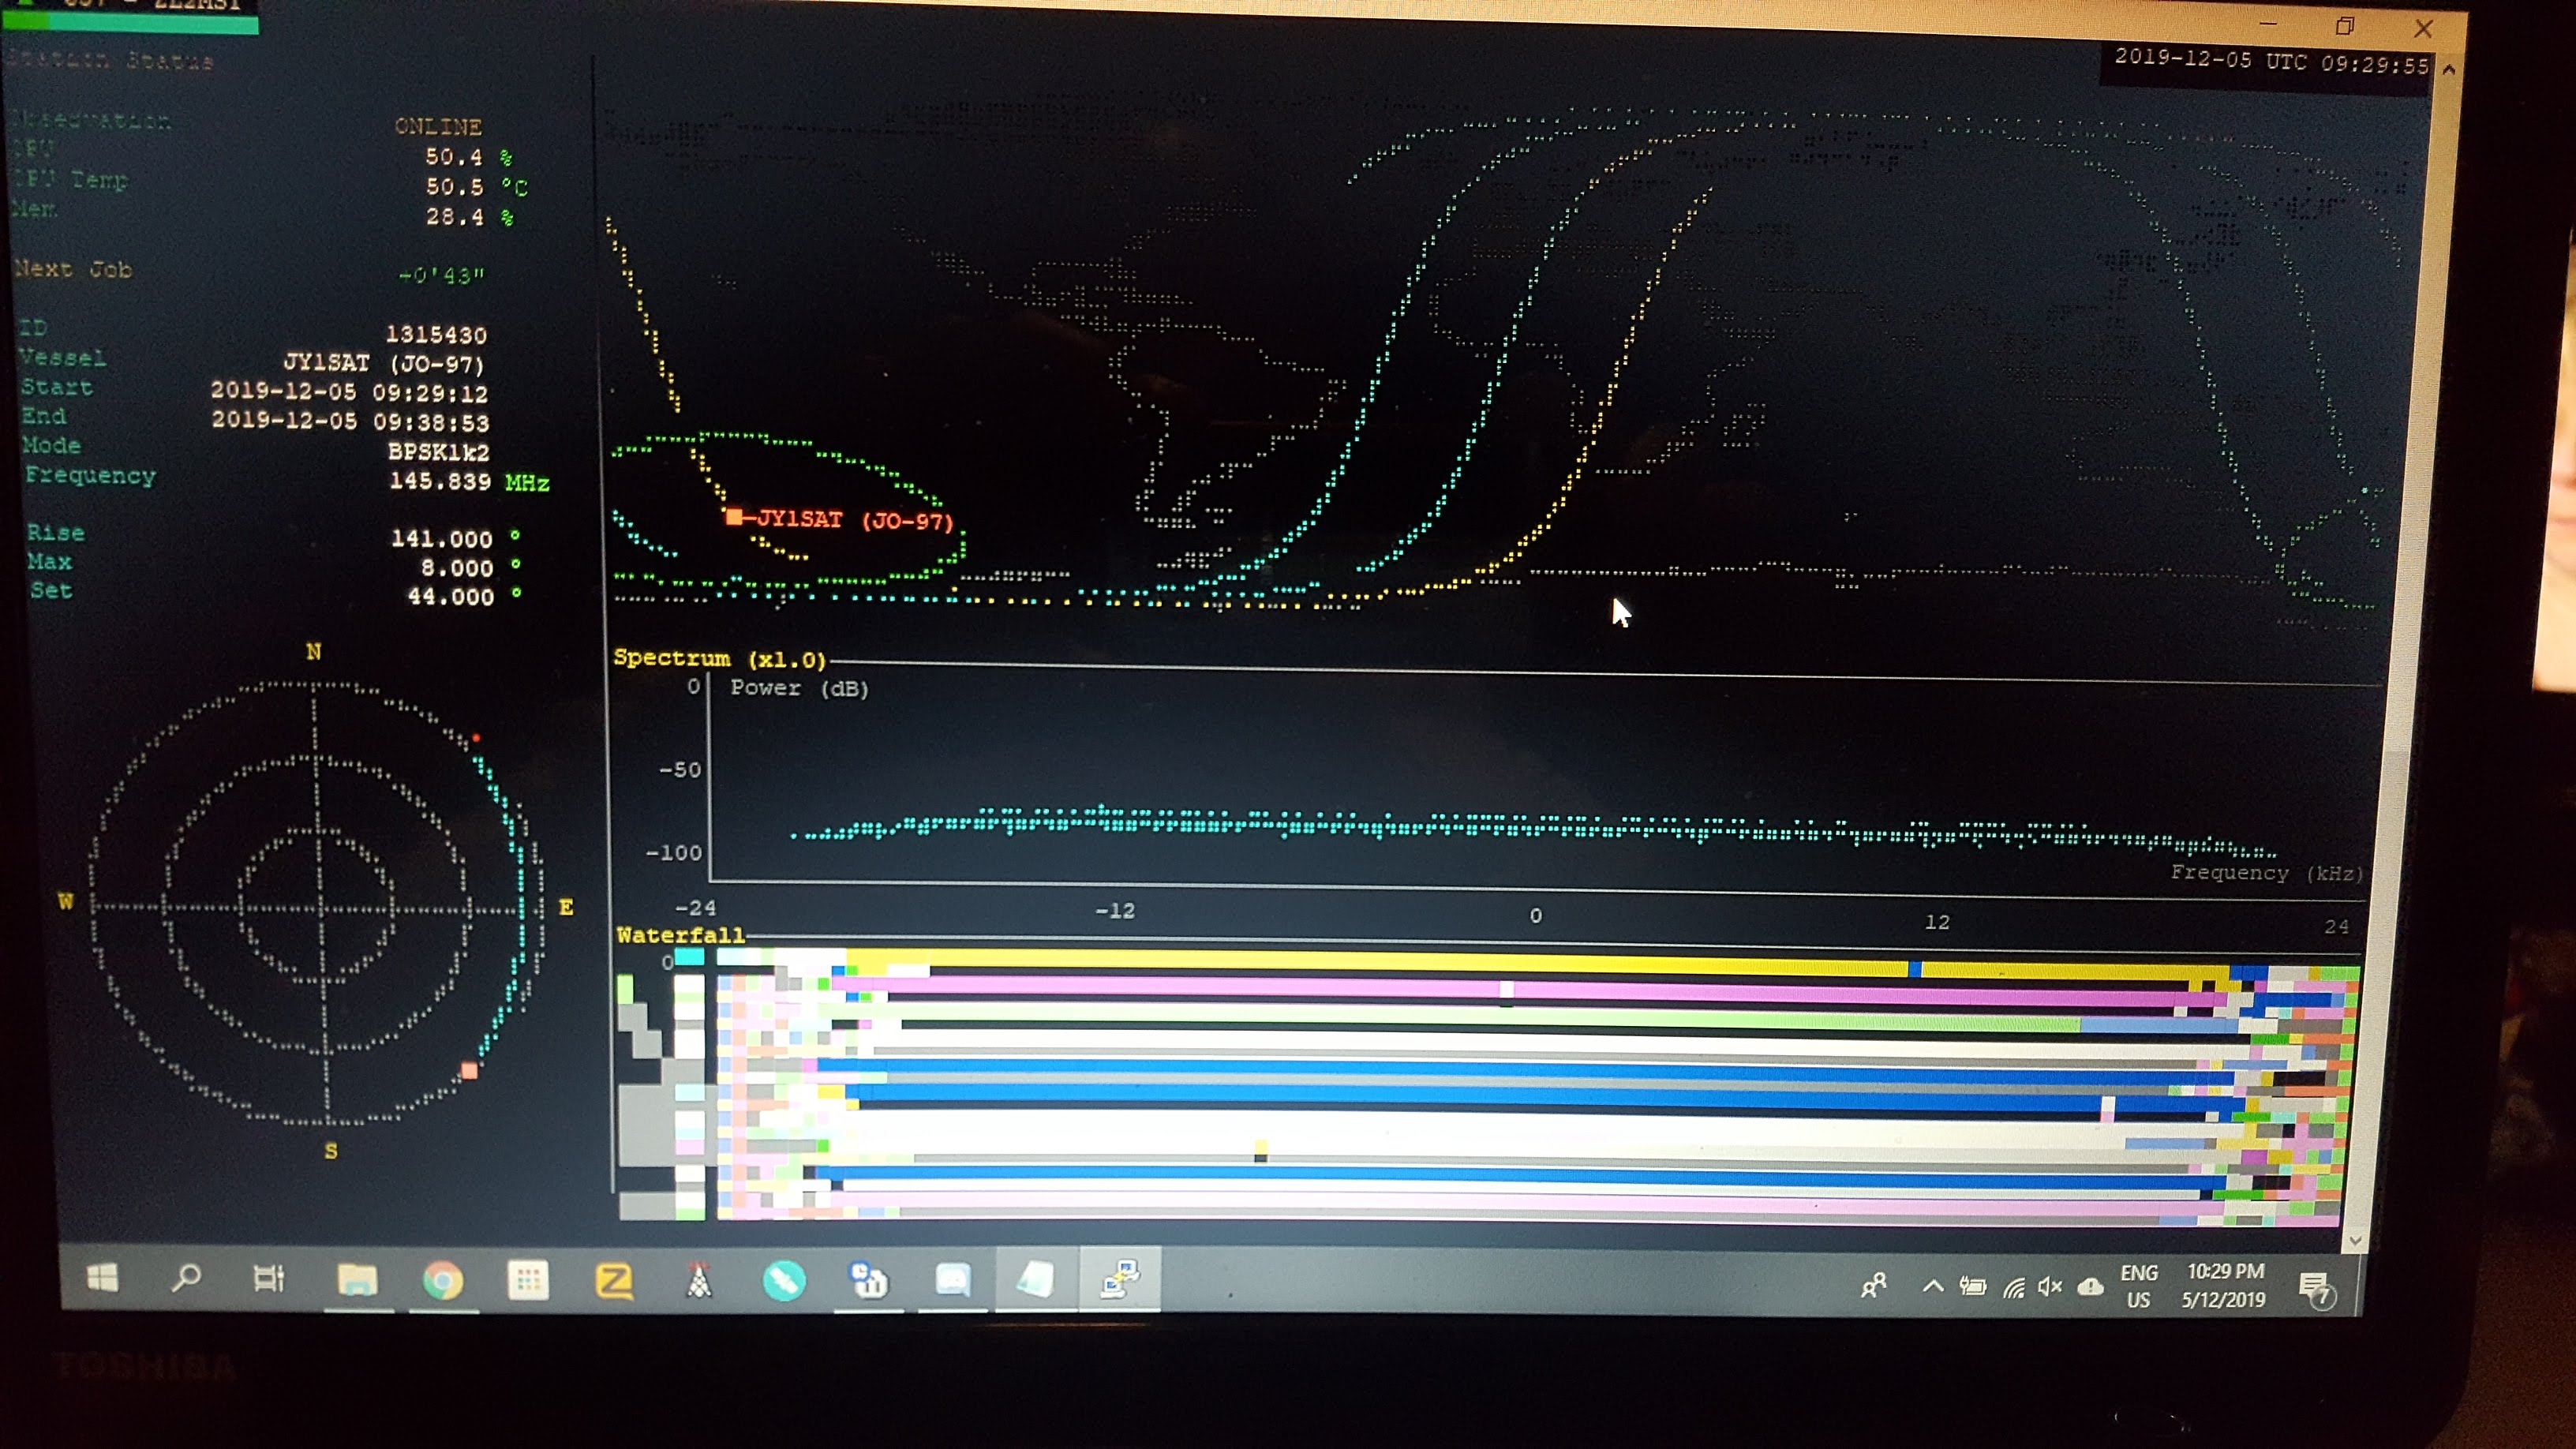
I released version 0.3.0 of the satnogs-monitor last night. This release adds some visualization of the received signal of the current observation in form of a spectrum and waterfall plot. Note that this only works if the satnogs-monitor runs on the same machine as the satnogs-client.
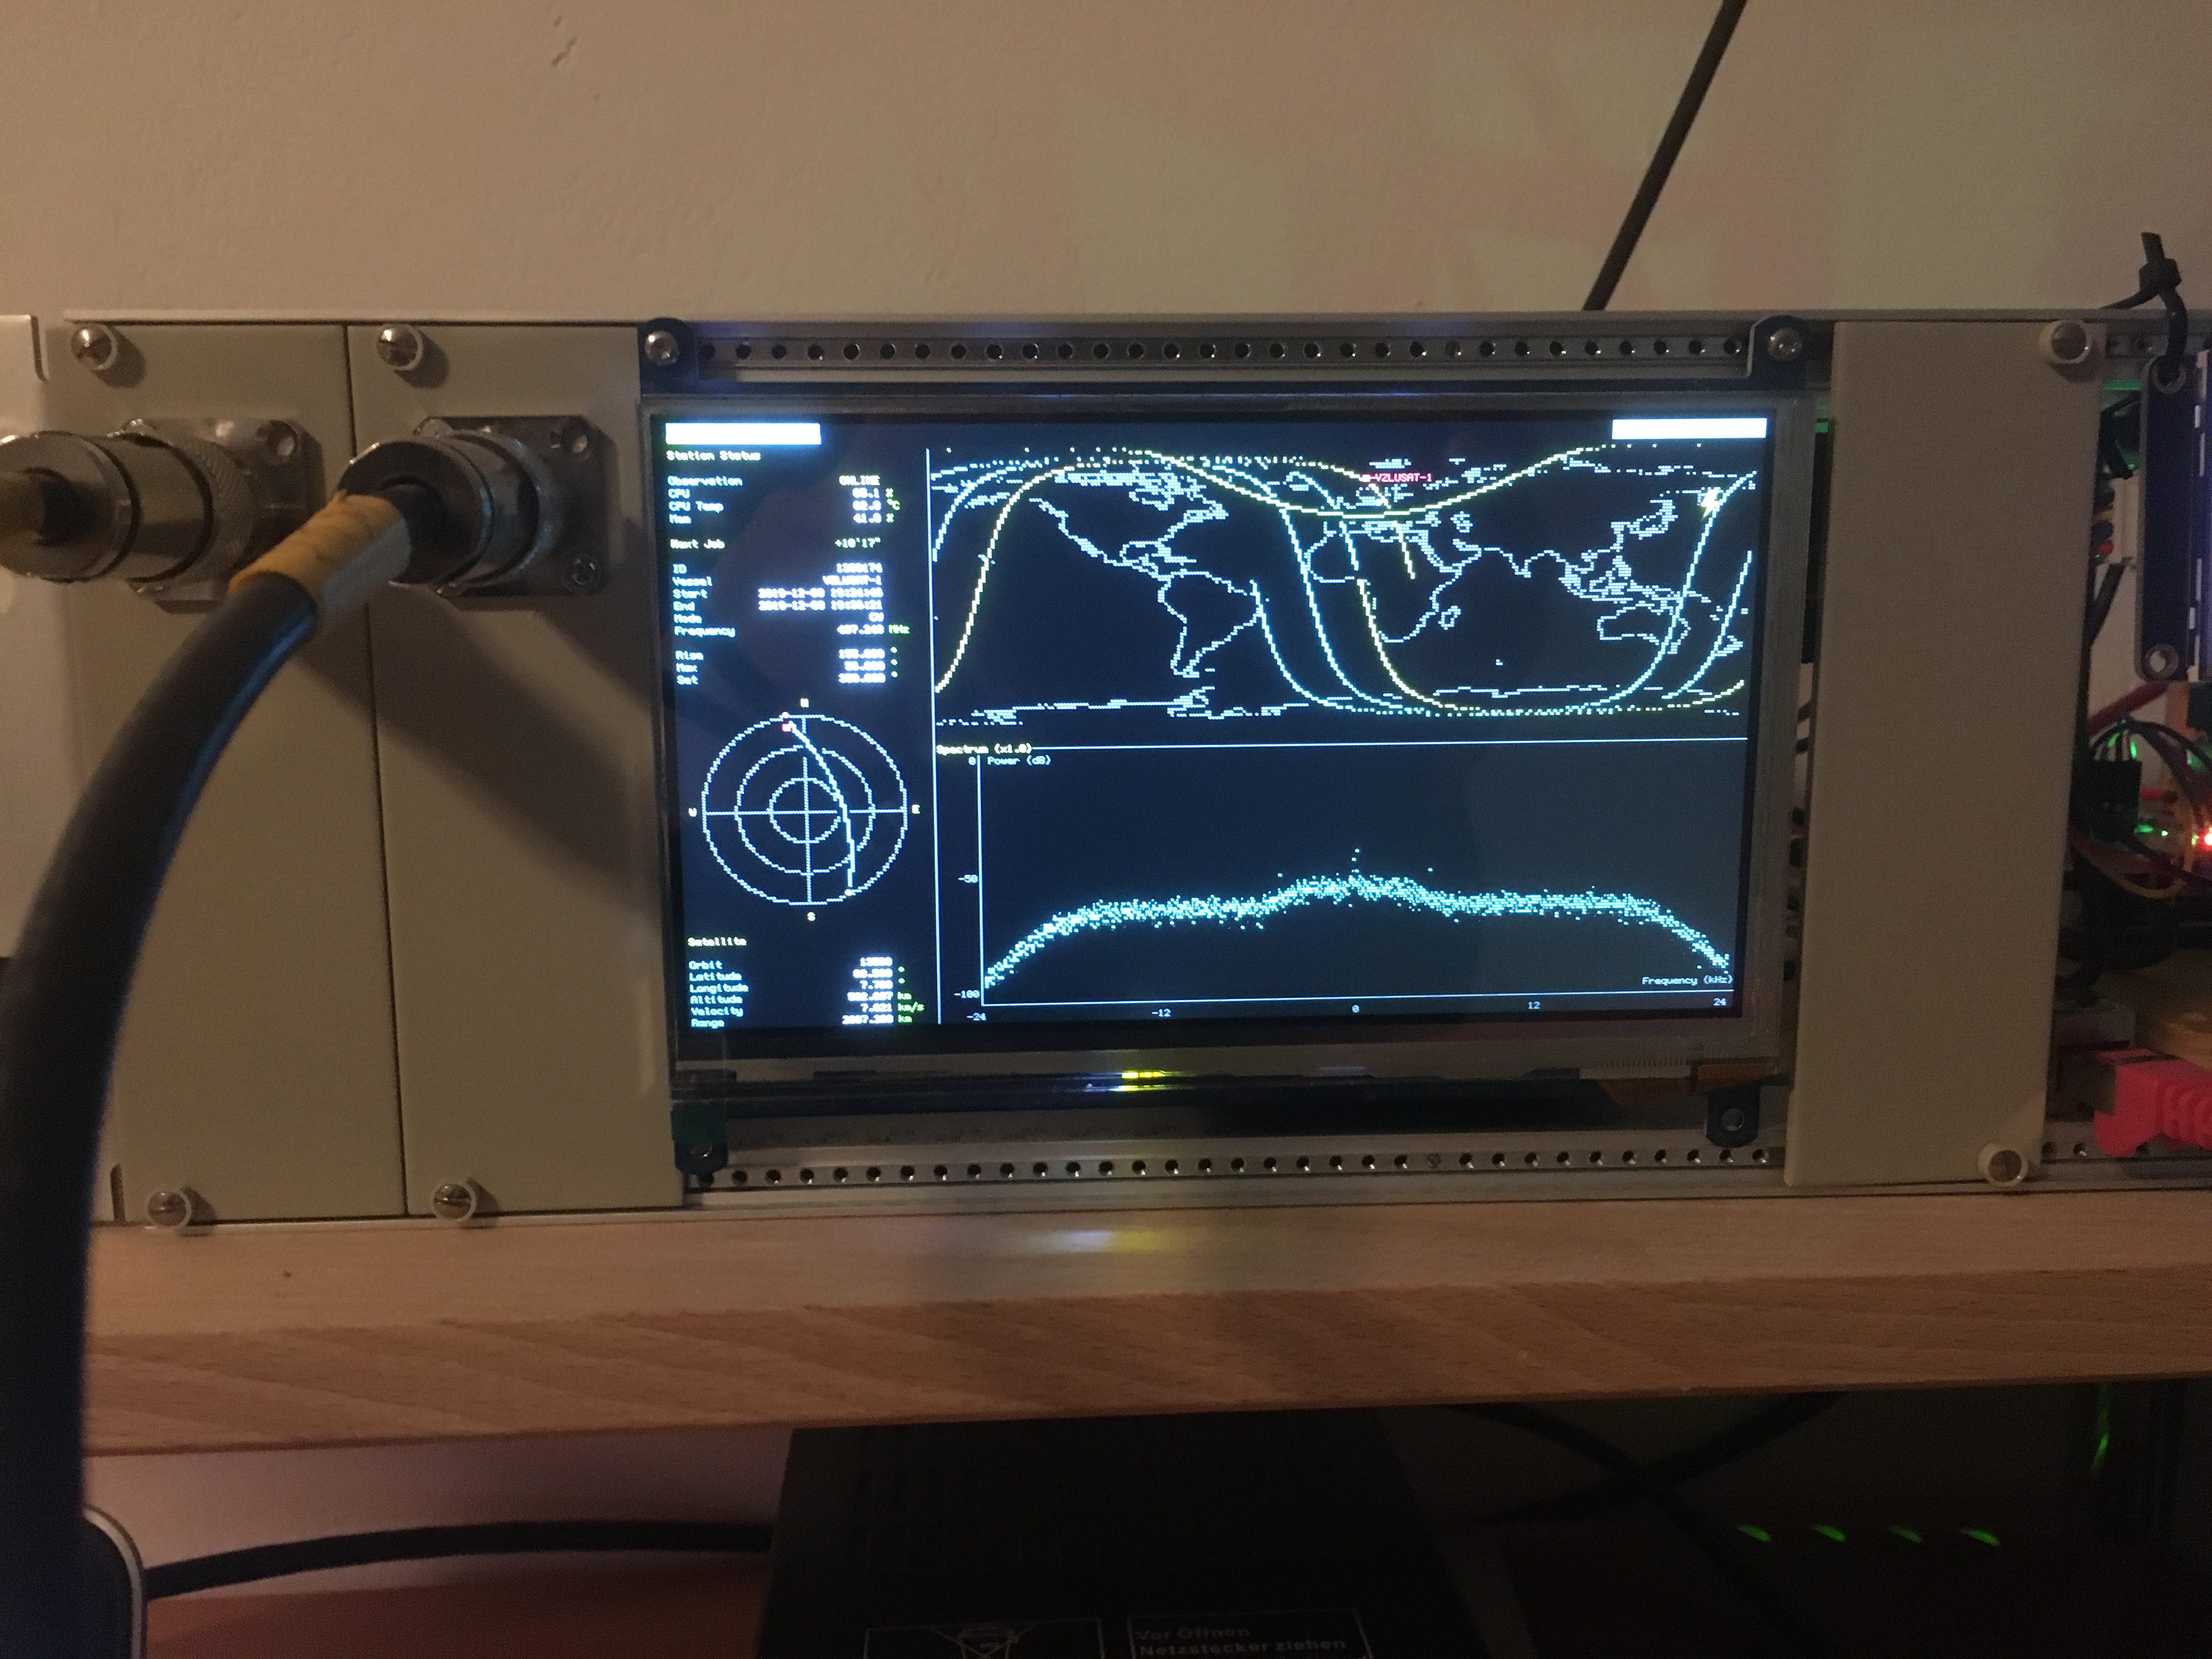
This screenshot shows satnogs-monitor running on the RPi of station 175 over ssh using alacritty as a terminal emulator. You can enable the spectrum and waterfall plot independently. You will also need a true color terminal for the waterfall to look nice. The performance depends only on the link quality of your ssh connection and was quite good even on my laggy wifi connection to the station. Rendering the new widgets had no measureable impact on the stations operation (tested on a RPi 3B+).
To update an existing installation on your RPi run:
The plots will appear as soon as an observation has started an satnogs-client creates the waterfall file. I’ll update the wiki page later today. I’ve updated the wiki to reflect the changes in the new version.
The range of both the spectrum and the waterfall plot is hard coded to 0;-100 dB. This will change soonish to be configureable by the user. There are some other ideas and functions which are not implemented yet (like waterfall zooming). I’ll create github issues to keep track of them. Feel free to add your own ideas and use cases.
I’m not sure about the audio stream yet. I guess it would be easy for you to attach some speakers to your RPi and play the audio where your station controller is. I think (and I may be totally wrong here) that’s a uncommon setup. I have my station controller (RPi) outside near the antenna and connect via ssh to the station and run the satnogs-monitor there to get the cool stuff. So streaming the audio to another machine is certainly possible, but may not be part of the satnogs-monitor functionality. If you stream the audio as part of satnogs-monitor you probably also want the waterfall data streamed. This would require much more bandwidth than the current partial terminal buffer updates through ssh.
What would be your use case? Would you want to listen to the audio ‘anywhere’ or would it suffice if you RPi played it?
This is already on my todo list. After this is implemented it should be fairly easy to run the satnogs-decoders on the data and display meaningful telemetry. There should be enough space next to the map for those widgets and it would reduce the distortion of the map itself.
The labels are just text, you’ll find them in the render_waterfall and render_spectrum_plot function of ui.rs. You’ll find the bounds for the spectrum plot there as well. Adjusting the range of the waterfall display is a bit more involving. You can take a look at the widget implementation waterfall.rs.
If you’ll have another day or so I make the necessary changes and make those bounds configurable.
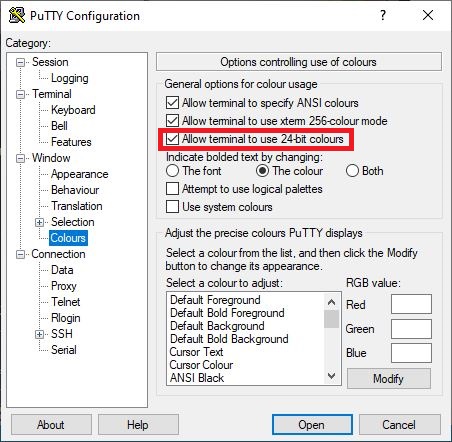
You can overwrite the default dB range (-100;0) with either the settings in the config file or with the command line options --db-min=-90 and --db-max=-20. I’ll add some more things during the next days and create a proper release.
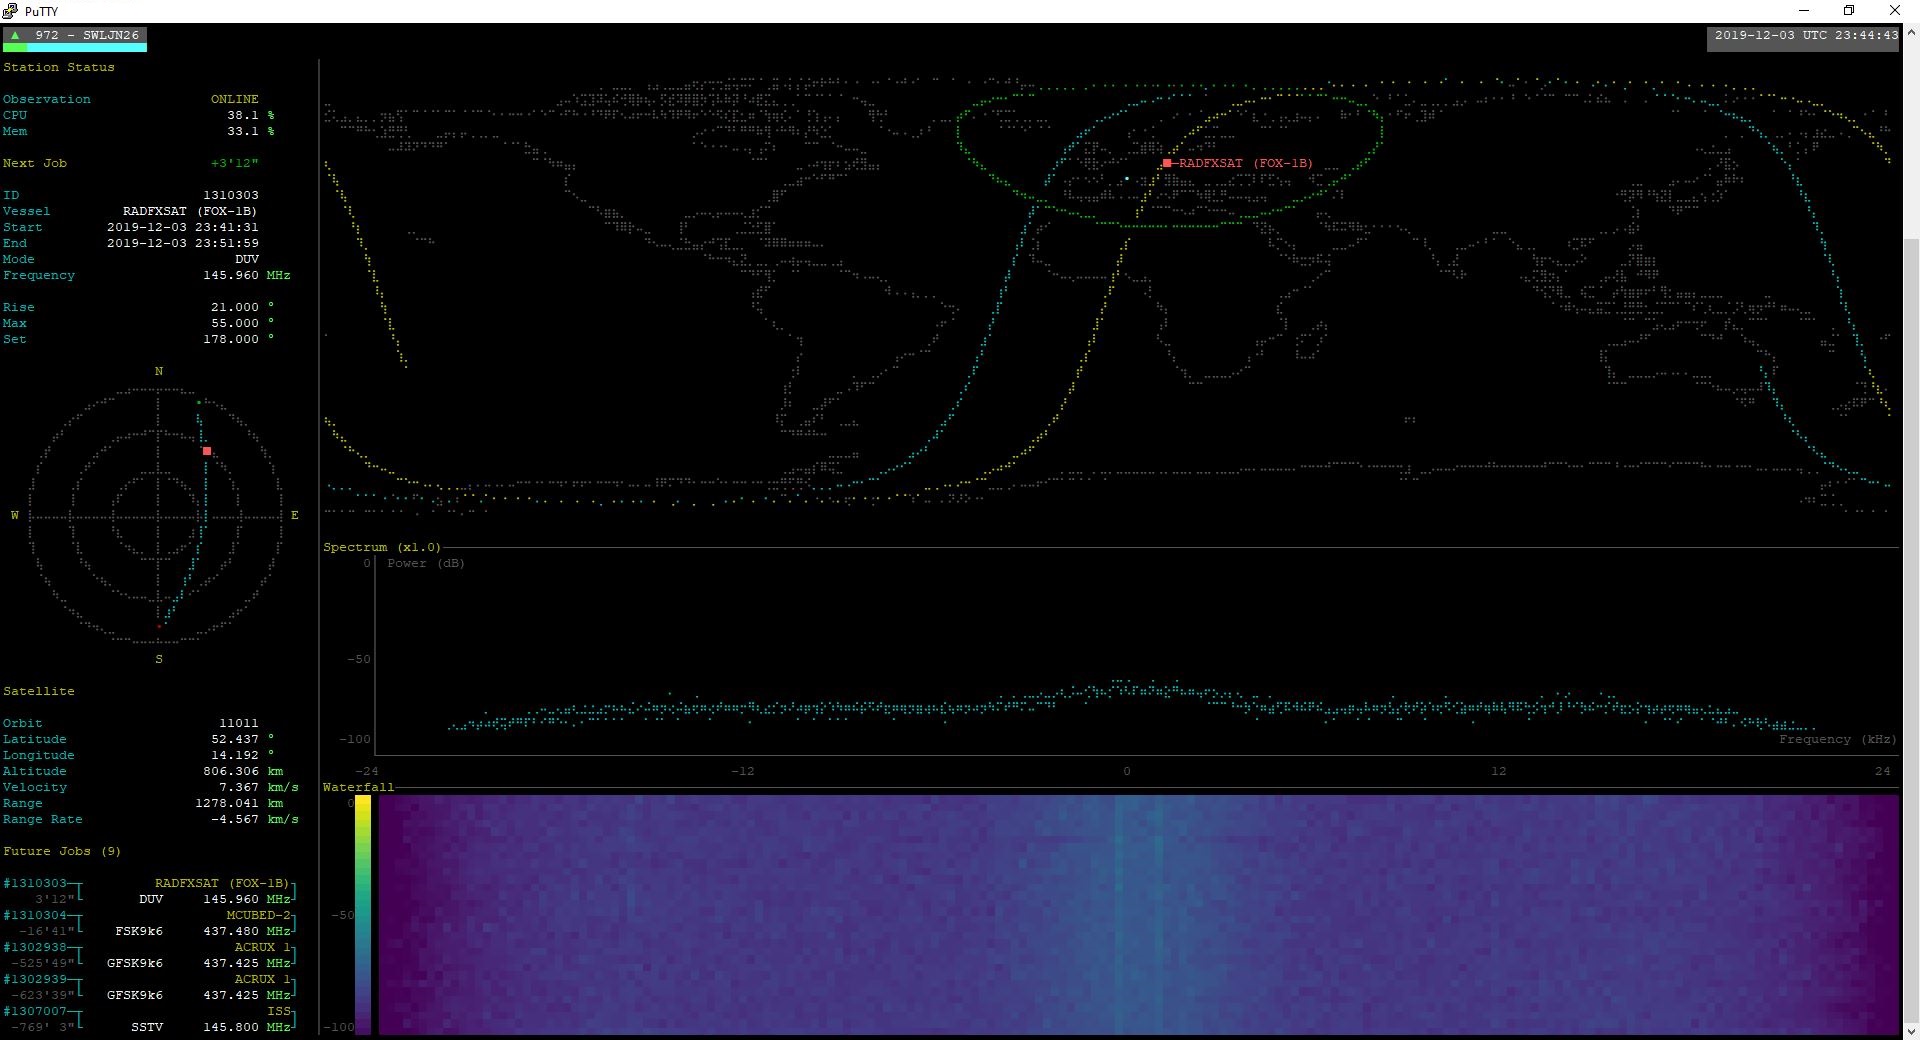
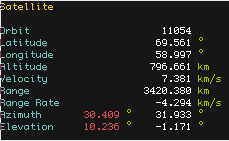
I just released version 0.3.1. This includes display of the satellites azimuth and elevation as well as the rotators position if you configure the rotcltd address. The color of the rotator position will change depending on the difference to the satellite position (<1.0: white;<5.0 yellow;else red).
It looks something like this:
I only tested it with the dummy rotator rotctld -m 1 but I think all rotators support querying the current position. However, any feedback from someone with a rotator setup is highly appreciated. You can set the rotctld address in the config file or use --rotctld-address 127.0.0.1:4533 as an command line option. rotctld listens on all interfaces by default, so you can also run with rotator support if satnogs-monitor runs on another machine as your ground station as long as you have a network connection to it.
I’d suggest < 5 degrees as White, < 15 degrees as yellow, and anything else as red.
Realistically no-one on SatNOGS (with the notable exception of the https://network.satnogs.org/stations/384/ ) has antennas with a narrow enough beam that 1 degrees of pointing accuracy is required.
Thanks a lot, it work well !
Would it be possible one day to have access to this monitor simply running the ip address of my station on a web-browser ?
I had in the past a 3D printer that was like my rotator controlled by a raspi, and i had access to it runnig its ip, i was using it to schedule printing or to know what was the temperature ect…
Sure, I’ll set those values as default and add options for the user to overwrite them.
I doubt it. My personal goal for satnogs-monitor was to create a terminal application which can be run on any machine (windows is not supported yet) and not just on the ground station. However, your station already has a status page as part of your SatNOGS client installation. Point your browser to port 5000 of your station (http://STATIONIP:5000) to check it out. I think contributions to add more information to this page on what’s going on are welcome.
Hey @wose, great work! The latest version works great, however I’ve noticed that if I try the spectrum waterfall command I get “Error occurred: entity not found”. Can this command only be ran when the station is running an observation job?
 )
)