That’s what I get for being lazy and using copy / paste  Thank you for pointing out the error, the command now runs perfectly.
Thanks!
That’s what I get for being lazy and using copy / paste Thank you for pointing out the error, the command now runs perfectly.
Thanks!
Hi @wose,
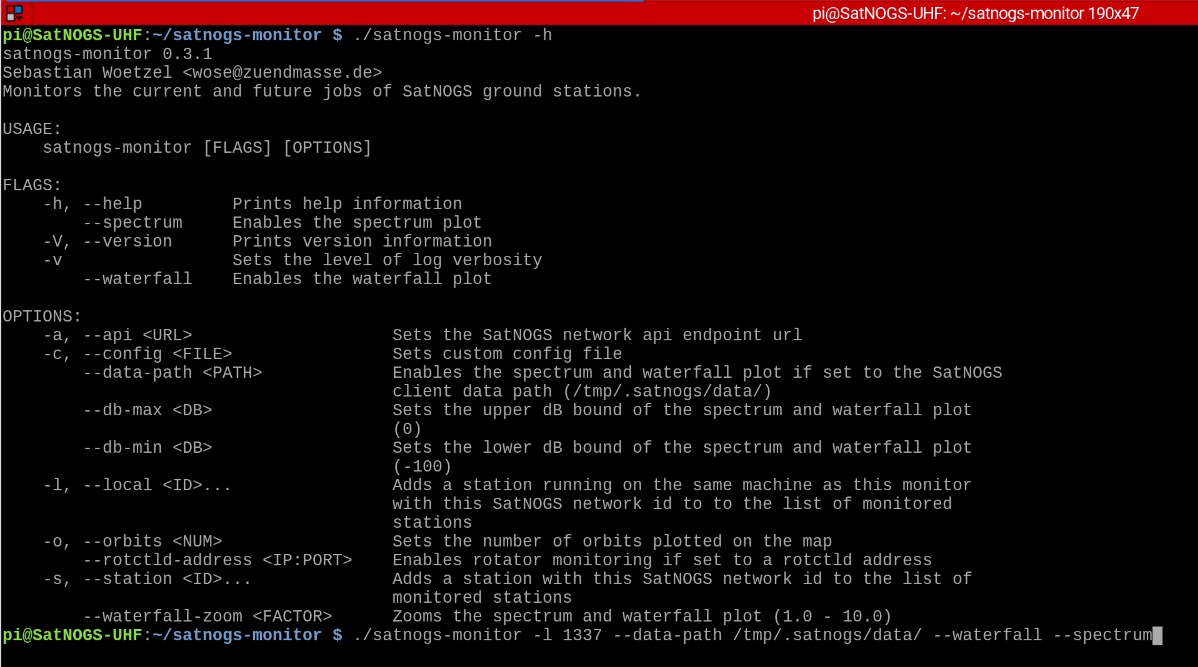
I’m running the satnogs-monitor on an Raspberry Pi 4 with the following command as instructed:
satnogs-monitor -l 1382 --rotctld-address 127.0.0.1:4533 --data-path /tmp/.satnogs/data/ --waterfall --spectrum
However, at the start of the pass, satnogs-monitor always crashed with the following message:
Satnogs-monitor thread ‘main’ panicked at ‘called Option::unwrap() on a None value’, src/libcore/option.rs:378:21
note: run with RUST_BACKTRACE=1 environment variable to display a backtrace.
Any idea why is this happening?
Thanks.
Can you set the env variable RUST_BACKTRACE=1 and post the output of the crash here, or even better create an issue with the output here: https://github.com/wose/satnogs-monitor/issues
Here’s the output with RUST_BACKTRACE=1
thread ‘main’ panicked at ‘called Option::unwrap() on a None value’, src/libcore/option.rs:378:21
stack backtrace:
0: <std::sys_common::backtrace::_print::DisplayBacktrace as core::fmt::Display>::fmt
1:
2:
3:
4:
5:
6:
7:
8:
9:
10:
11:
12:
13:
14:
15:
16:
17:
18:
19: main
20: __libc_start_main
note:
Some details are omitted, run with RUST_BACKTRACE=full for a verbose backtrace.
And, with RUST_BACKTRACE=full
thread ‘main’ panicked at ‘called Option::unwrap() on a None value’, src/libcore/option.rs:378:21
stack backtrace:
0: 0x806e3c - <std::sys_common::backtrace::_print::DisplayBacktrace as core::fmt::Display>::fmt::hf24f776311cdf529
1: 0x824414 -
2: 0x800a7c -
3: 0x8091d0 - <unknown
4: 0x808e10 -
5: 0x8098d0
6: 0x8094d0 -
7: 0x8093c8 -
8: 0x820030 -
9: 0x81ff74 -
10: 0x43f5f0 -
11: 0x469c2c -
12: 0x43d058 -
13: 0x43e484 -
14: 0x45c5f4 -
15: 0x47a064 -
16: 0x809340 -
17: 0x80d6d4 -
18: 0x809e28 -
19: 0x45fc98 - main
20: 0xb6d9f718 - __libc_start_main
Hi,
I’m unable to get the waterfall or spectrum to display. I have satnogs-monitor run on the same rPi as the station but it never shows … Anyone got a clue at what I could be doing wrong ?
Hi,
the waterfall format changed with SatNOGS client version 1.1. The git version of the monitor already supports the new format. The next release including those changes is in the works and will happen hopefully today or at least very soon. You can build the monitor from source if you don’t want to wait.
Him
Thanks for your answer. I actually tried pulling the latest version from the git but must have done it a few days too early !
I will just wait for your package file.
73’ s Martin 9V1RM
Didn’t have the patience to wait so I checked-out the latest github version. All good now ! Thank you.
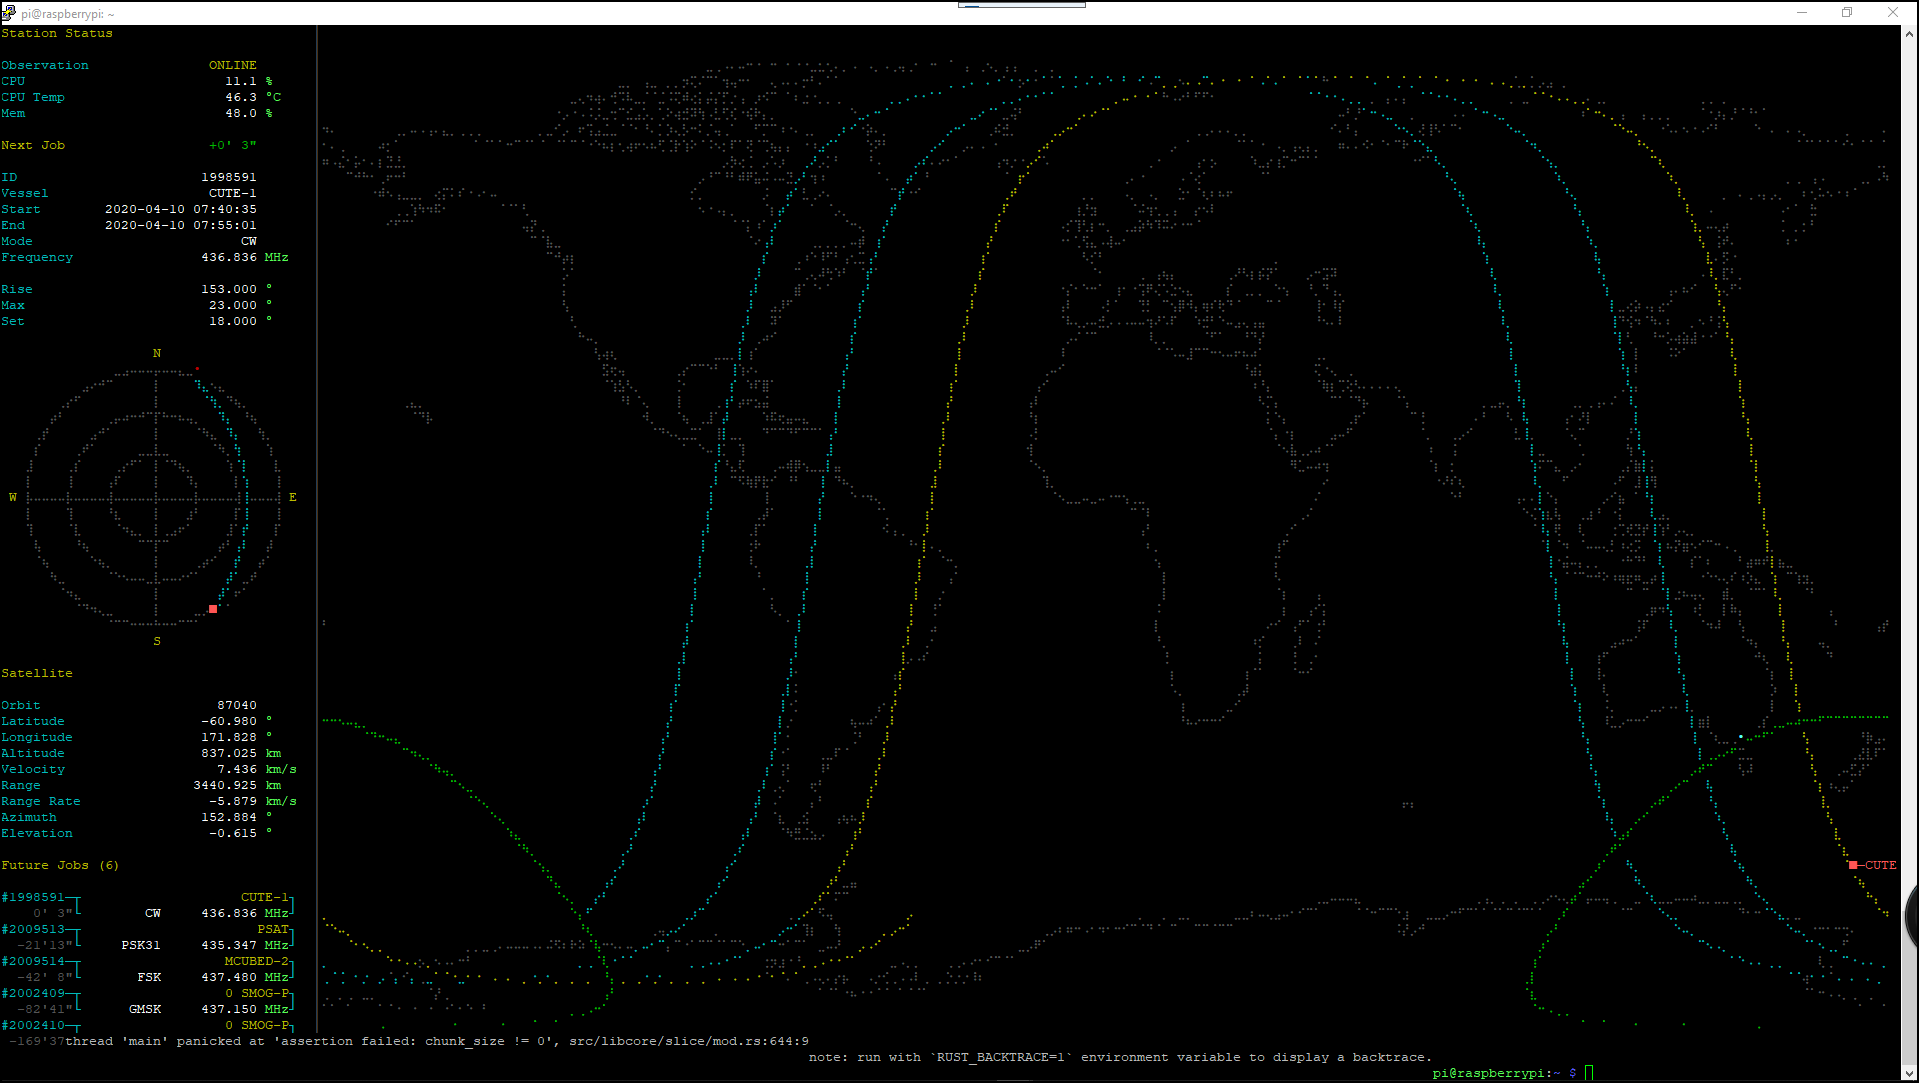
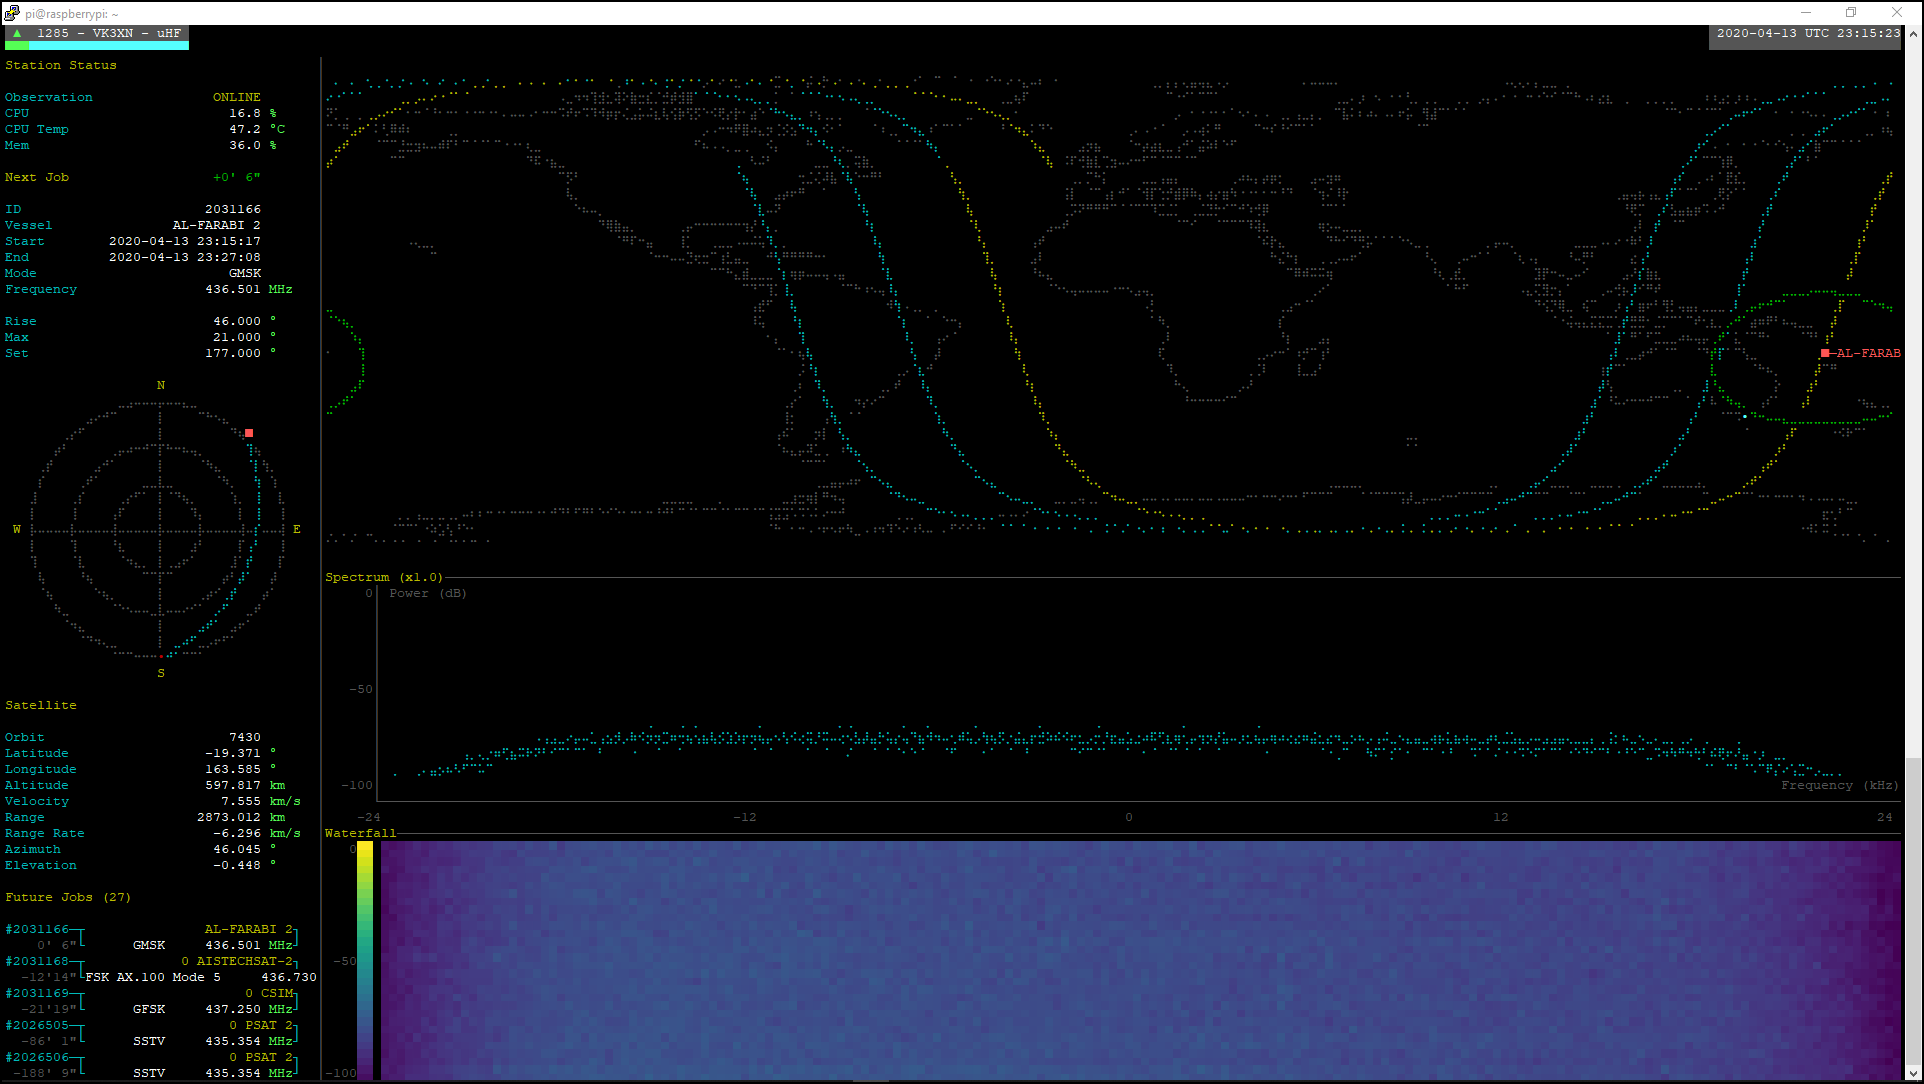
I’m having problems running monitor with --waterfall and --spectrum.
Getting Error thread ‘main’ panicked at ‘assertion failed: chunk_size !=0, scr/libcore/slice/mod.rs:644:9 note: run with "RUST_BACKTRACE=1’ environment variable to display a backtrace. This error triggers immedietly on AOS. Command line I am using to start monitor is; satnogs-monitor -l 1285 --data-path /tmp/.satnogs/data/ --waterfall --spectrumAny help to get waterfall and spectrum running in monitor would be much appreciated. Help 
Mick
VK3XN
Generating support report. Please wait…
------------[ copy here ]------------
{
“versions”: {
“satnogs-client”: “1.3.1”,
“satnogs-client-ansible”: “202004031132”,
“satnogs-flowgraphs”: “1.1.1-1”,
“gr-satnogs”: “2.1.1-1”,
“gr-soapy”: “2.1.2-1”,
“gnuradio”: “3.8.1.0~rc1-2”,
“satnogs-config”: “0.10.1”
},
“state”: {
“is-applied”: true,
“pending-tags”: null
},
“system”: {
“distribution”: {
“DESCRIPTION”: “Raspbian GNU/Linux 10 (buster)”,
“RELEASE”: “10”,
“CODENAME”: “buster”,
“ID”: “Raspbian”
},
“pending-updates”: false,
“platform”: {
“system”: “Linux”,
“node”: “raspberrypi”,
“release”: “4.19.97-v7l+”,
“version”: “#1294 SMP Thu Jan 30 13:21:14 GMT 2020”,
“machine”: “armv7l”,
“processor”: “”
},
“memory”: {
“total”: 969355264,
“available”: 753770496,
“percent”: 22.2,
“used”: 144080896,
“free”: 567812096,
“active”: 235593728,
“inactive”: 89178112,
“buffers”: 24834048,
“cached”: 232628224,
“shared”: 12570624,
“slab”: 42303488
},
“disk”: {
“total”: 14975926272,
“used”: 3964801024,
“free”: 10356371456,
“percent”: 27.7
}
},
“configuration”: {
“hamlib_utils_rot_enabled”: false,
“satnogs_antenna”: “RX”,
“satnogs_api_token”: “[redacted]”,
“satnogs_rf_gain”: “44.0”,
“satnogs_rx_device”: “rtlsdr”,
“satnogs_rx_samp_rate”: “2.048e6”,
“satnogs_soapy_rx_device”: “driver=rtlsdr”,
“satnogs_station_elev”: “147”,
“satnogs_station_id”: 1285,
“satnogs_station_lat”: “-37.816755”,
“satnogs_station_lon”: “145.274735”
}
}
------------[ copy end ]-------------
Is the Station Monitor intended to be installed and run on a ground station or on a separate raspberry pi?
Bob, KO2F
Not sure if anything has changed, but it used to be (maybe still is) that it would run on either - although if you run it on an actual station pi you would get additional information.
Beautiful work @wose. Tried satnogs monitor for the first time today. Worked right out of the box, and looks great.
Maybe I spoke too soon 
When an observation starts, satnogs monitor exits with this message:
thread 'main' panicked at 'called `Option::unwrap()` on a `None` value', src/libcore/option.rs:378:21
note: run with `RUST_BACKTRACE=1` environment variable to display a backtrace.
I started the program with satnogs-monitor -l 1272 --data-path /tmp/.satnogs/data/ --waterfall --spectrum -vvv
A side note: It doesn’t seem like the list of future jobs is updated when new jobs are scheduled from the auto scheduler.
I am receiving the same error ‘main’ panicked at ‘called Option::unwrap() on a None value’, src/libcore/option.rs:378:21
note: run with RUST_BACKTRACE=1 environment variable to display a backtrace. anyone know what the problem is??
how did you install the latest github version?
Hi.
I’ve just released a new version which includes fixes regarding the waterfall and spectrum plot some of you have experienced with newer satnogs client versions. Check out the other post: SatNOGS station monitor v0.4.x
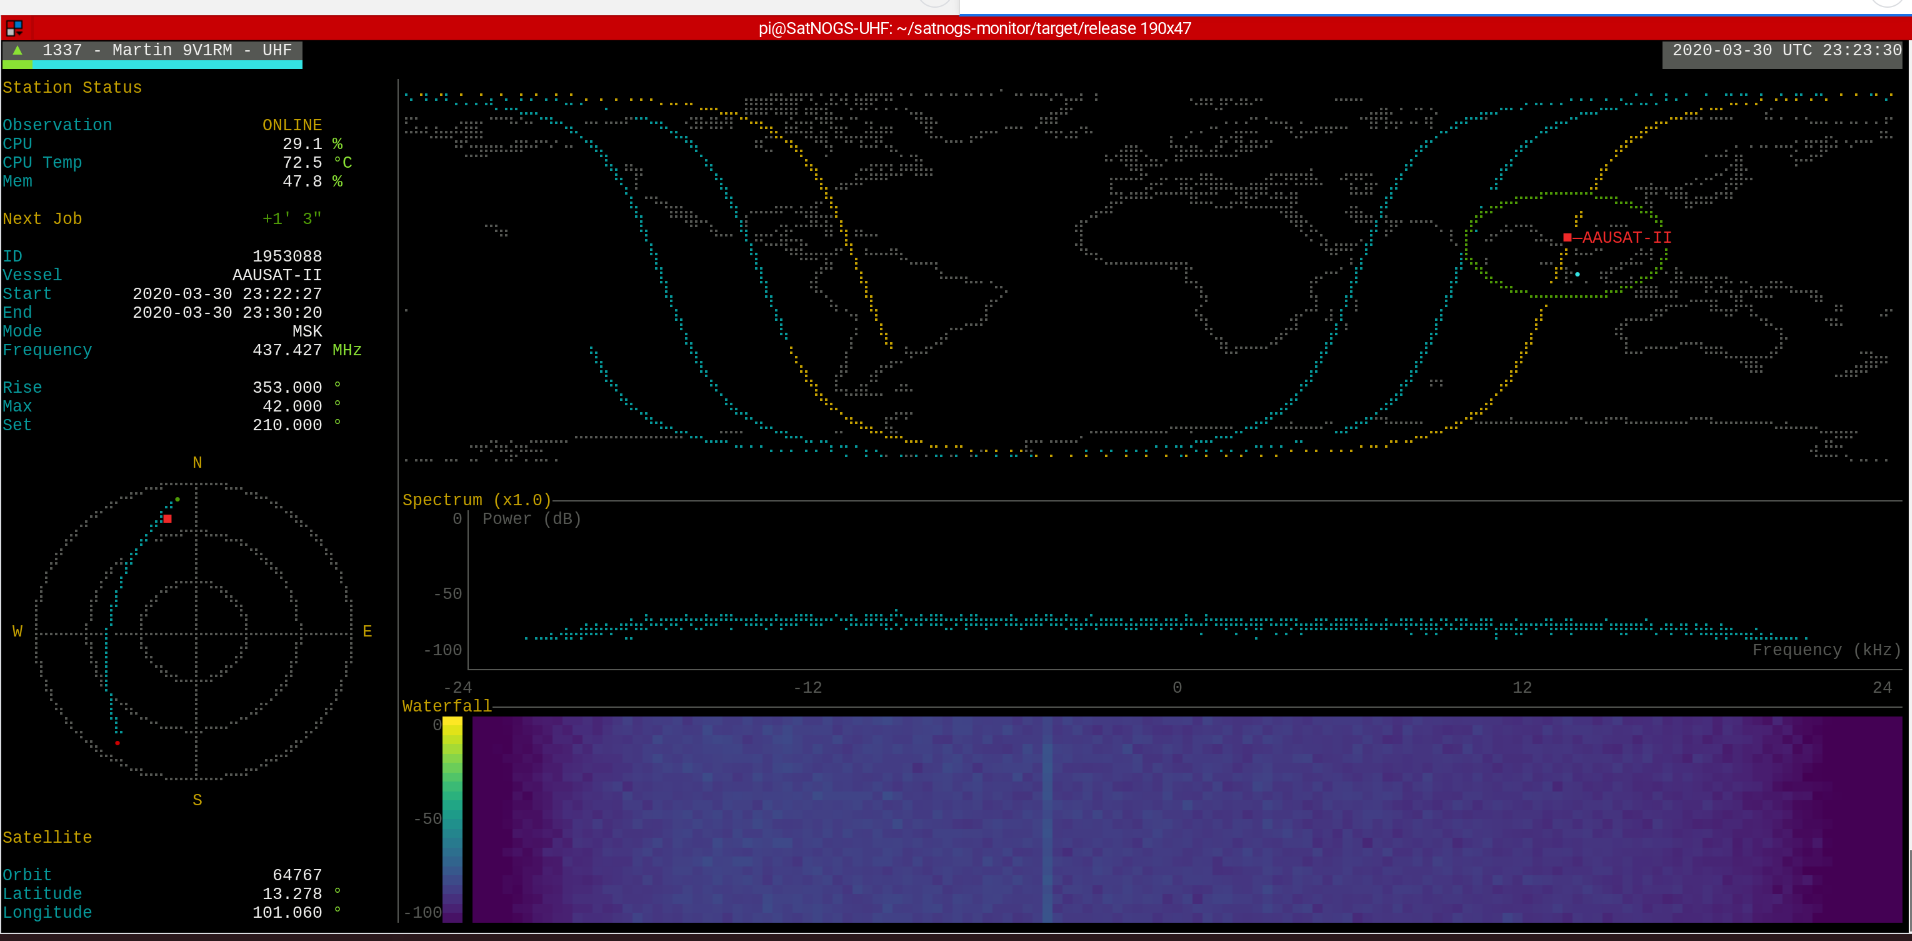
Both actually. There are binary packages for Debian armhf and x64 on the github release page. If you run the monitor on your satnogs station you can enable a near real time waterfall and spectrum plot of the current running observation. This is not possible if you run the monitor on any other machine. Mounting the satnogs data directory won’t help since the filesystem notifications are not propagated through i.e. sshfs.
Thanks wose,
I just updated one of my ground stations to 4.0 and have scheduled a pass in about a half hour.
Bob, KO2F
The SatNogs monitor is able to monitor multiple ground stations. How do I switch between stations (tabs)?
Bob, KO2F
I think pressing the tab key on the keyboard will switch to the next station.