update: PART 2
Maybe among you, there’s some curiosity about the function of the artifact, or the .h5 file present on this observation.
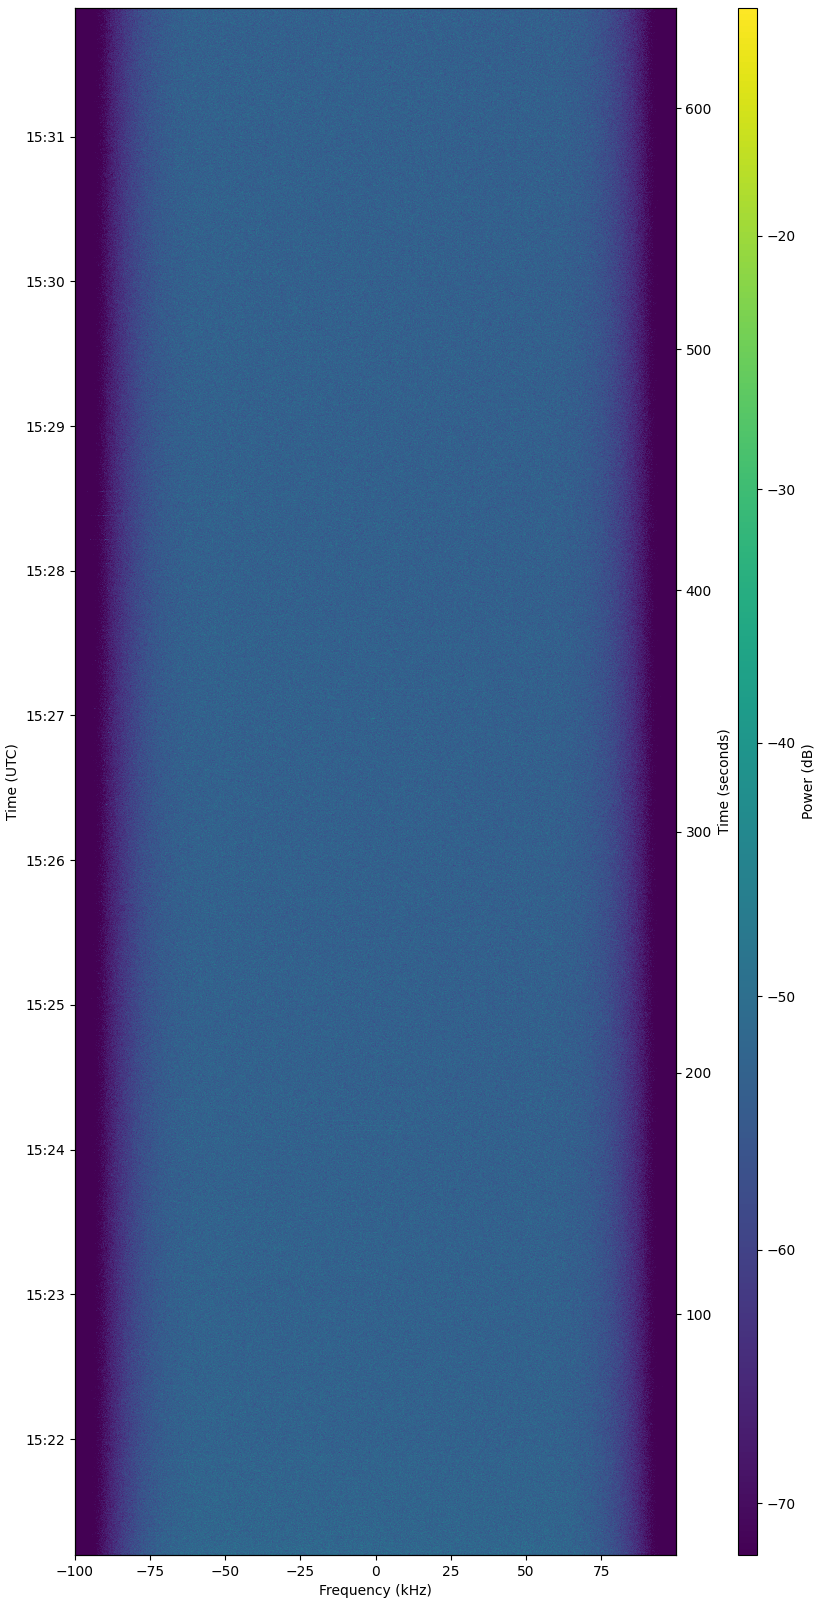
Its function is to display waterfall results in a more detailed, sharp, and interactive way. Weak signal traces that might not be visible in the waterfall can be clearly seen using this feature. Maybe same function like inspectrum
However, this function is not enabled by default. As the station owner, you need to activate it. Please edit your station config file, or in satnogs-setup, and look for the variable, and enable it:
SATNOGS_ARTIFACTS_ENABLED=True
SATNOGS_ARTIFACTS_API_TOKEN=xxxx
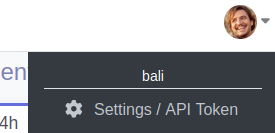
to get the api token, you must first create account at https://db.satnogs.org,
login and click avatar, Settings / API Token
after change, dont forget to restart the station and make a new observation.
here example how to use this artifact / .h5 feature:
-
open this observation
-
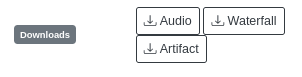
download artifact .h5
-
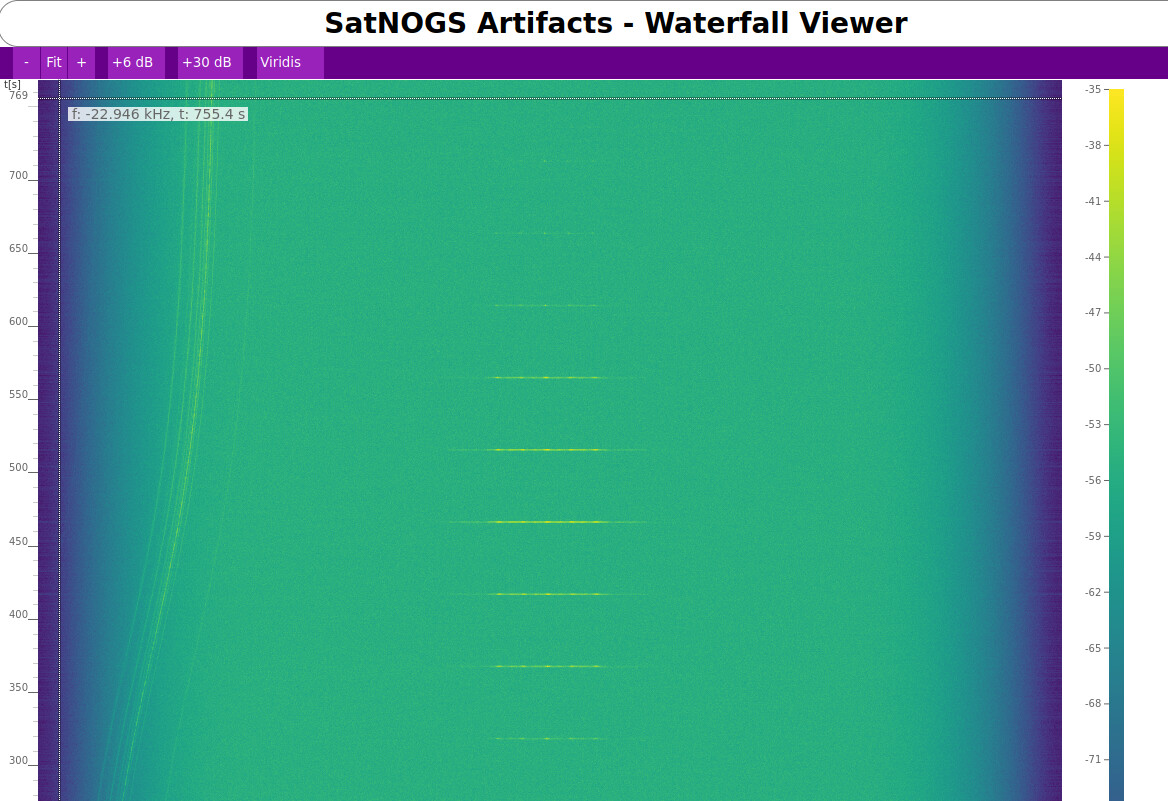
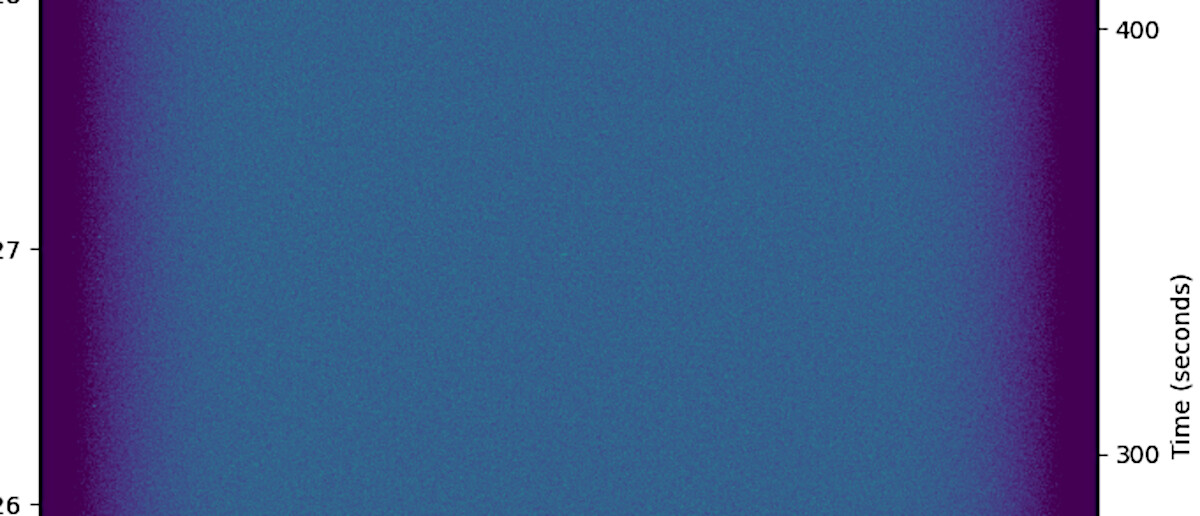
upload .h5 file, and you will see this:
-
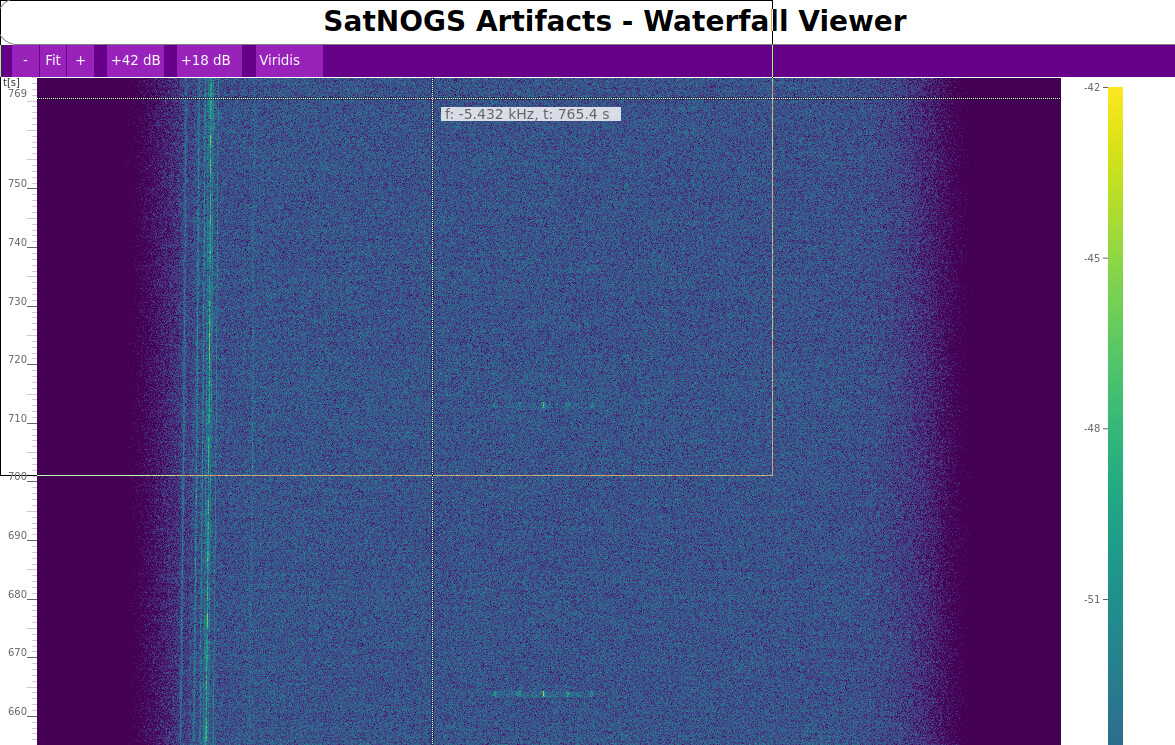
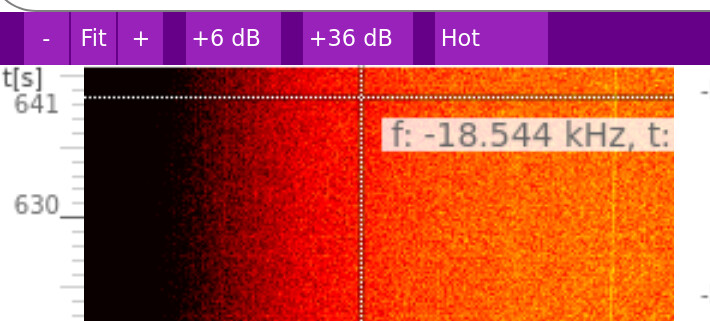
adjust the dB, for example +42dB and +18dB to make signal clear
-
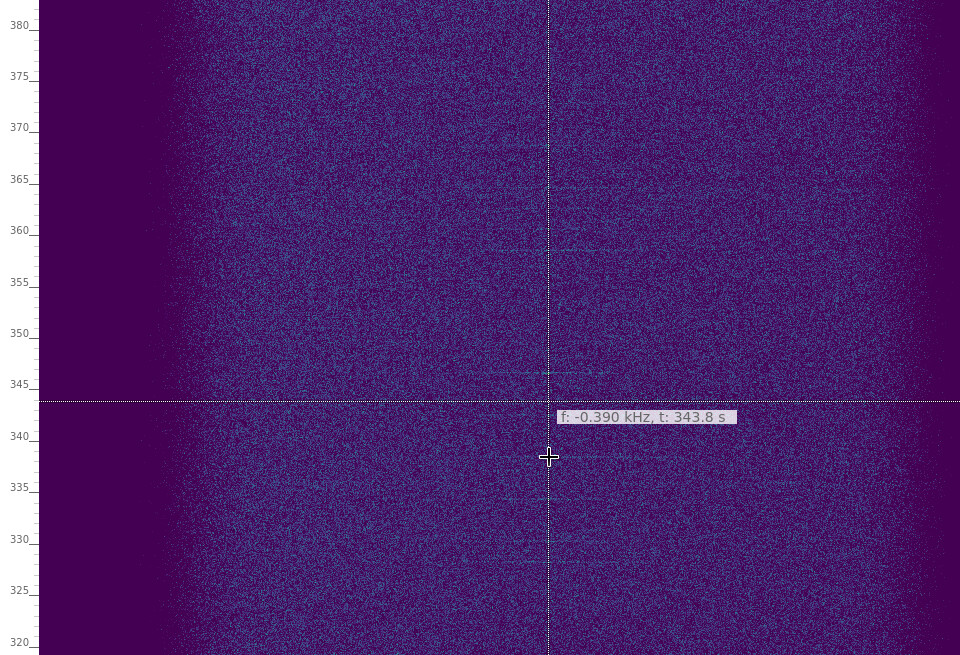
click on + for zoom in, and - for zoom out, and Fit to reset
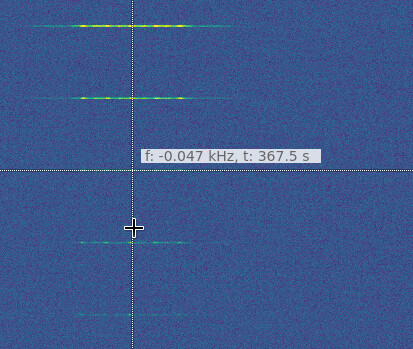
if you move the cursor inside waterfall, a tooltip will shown frequency offset and time in seconds
-
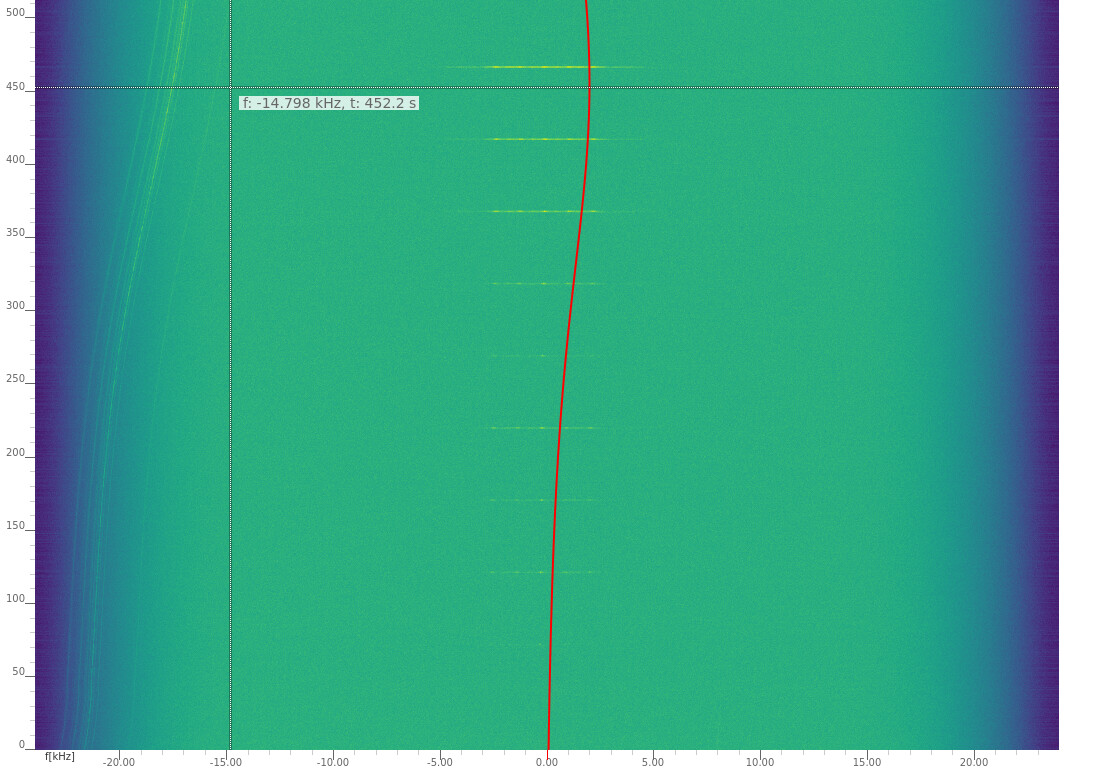
look at [add local noise], and set for example frequency offset: -21. click overlay. This feature helps you identify signals in the waterfall that belong to terrestrial signals (red line) not satellite.
-
[add a second object], you can put TLE here.
for example put an old tle, to compare with the new tle . just copy the tle below and paste in the box.

LAPAN-A2
1 40931U 00000    25335.25024306  .00000000  00000-0 -12415-2 0    06
2 40931   5.9993 146.8001 0011522  76.2373  62.4970 14.78985243  4354
or to check if the TLE used in this observation is accurate:
LAPAN-A2
1 40931U          25344.45049596  .00000000  00000-0  30000-3 0    06
2 40931   6.0006  76.1618 0012733 338.8432 322.8531 14.79075522    03
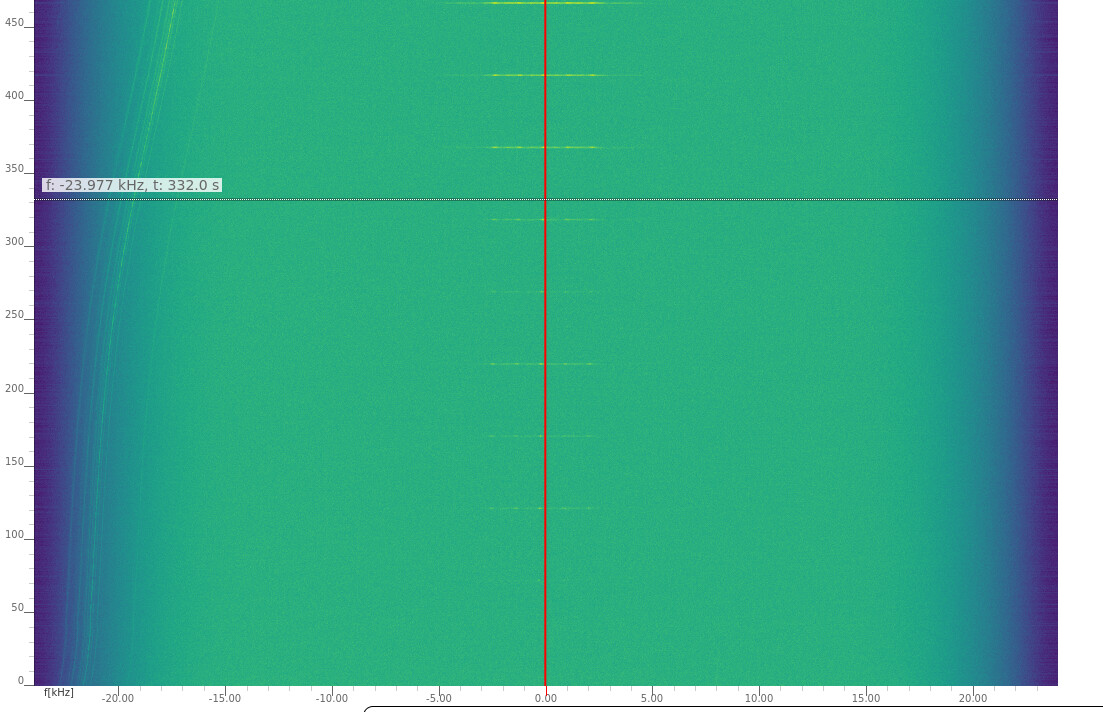
in this example i put -2.8 for frequency offset. you adjust this to make line at center of freq (0.00)
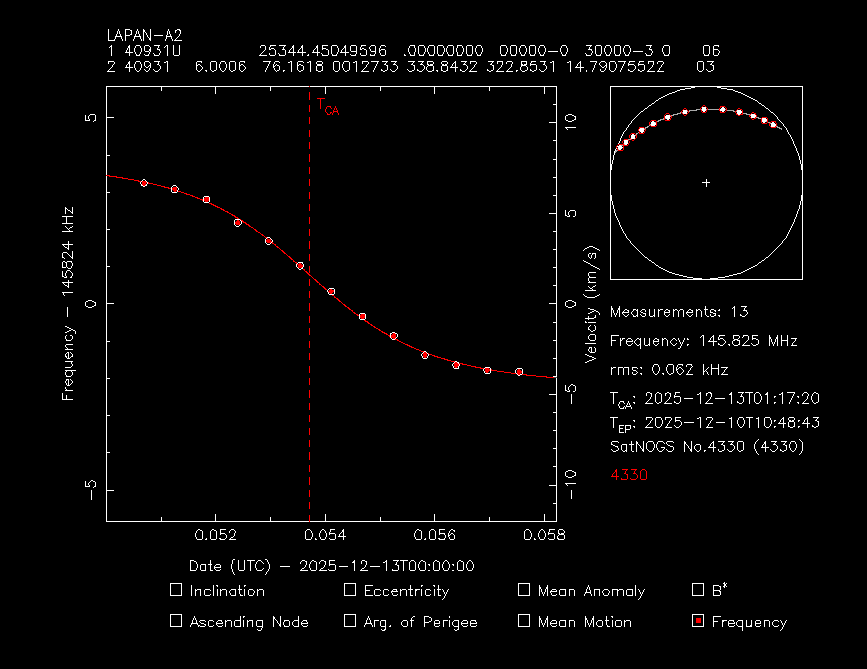
Finally, you can also use this artifact to create TLE using the STRF tools.
To do this:
-
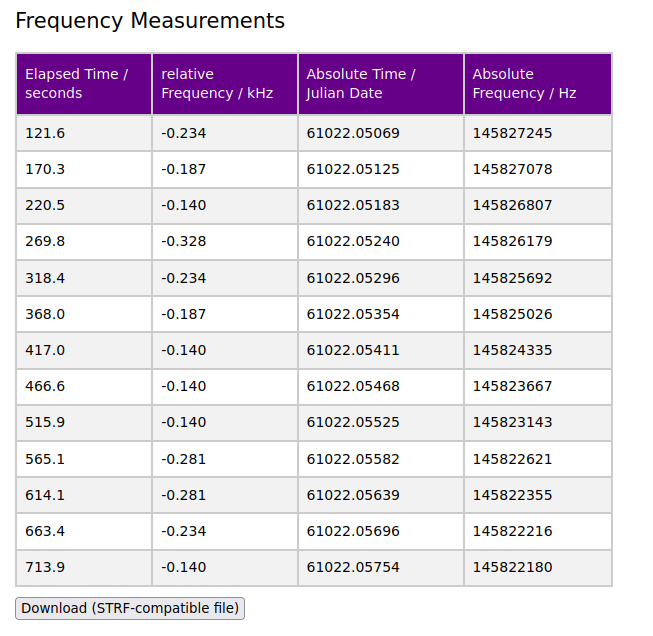
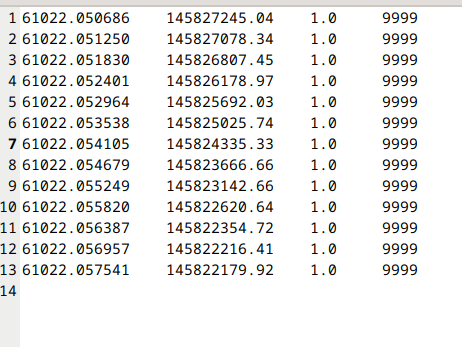
Click on each signal peak in the waterfall. Each dot you click will appear in the [frequency measurements] table. Once you’re done, click the [Download (STRF-compatible file] button.
-
edit measurements.dat file with your fav text editor, and replace the site location 9999 with your obs station id. for example in this obs, the station id is 4330.
-
open the file with strf using this command:
./rffit -d measurements.dat -i 40931 -c lapan-a2_2025-12-10_v1.txt
measurements.dat (455 Bytes)
sites.txt (809 Bytes)
lapan-a2_2025-12-10_v1.txt (149 Bytes)
thank you for @cgbsat and @kerel and satnogs-client teams for great tools used in this tutorial