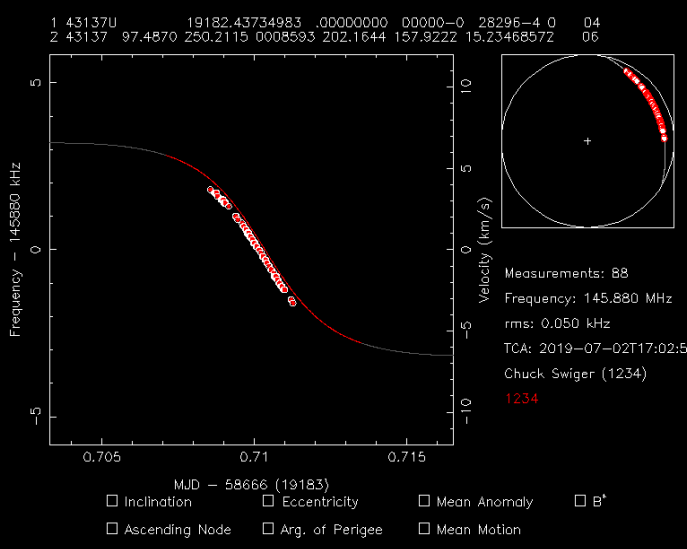
Thanks to @EA4GPZ page An STRF crash course – Daniel Estévez I’m having fun collecting and analyzing signals - sort of successfully identified a pass of XW-2A but had to cheat and find what it was, then add the id and frequency to strf/data/frequencies.txt to get a post facto match:
Great to see that you like the software! As the author I do apologize for the lack of documentation.
rfplot has the option to identify curves. Use ‘s’ to select the area around a curve, then ‘f’ to find the significant frequency points for each timestamp and ‘i’ to identify the curve. Make sure you have ran tleupdate to get recent TLEs (this requires a space-track.org account). Also use (I think it is) ‘S’ to change the size of the selection range and the significance limit of the points to selecy. The identification works best if all found point belong to the Doppler curve.
I have a long frequencies.txt for VHF, UHF and S-band. I can share it next weekend.
Oh it opens up a whole new world Was able to build just the rffft on a satnogs Raspberry Pi w/o other dependencies:
$ make rffft
$ sudo install -m 557 rffft /usr/local/bin/rffft
then copy the smaller bins captured over to a notebook with full install for analysis.
Thought there might be a current data/frequencies.txt referenced in another discussion group.
That’s exactly why rffft generates lots of smallish files; it can run on a Raspberry Pi for days on end while the files are copied and analysed elsewhere. I usually run 4MHz of bandwidth on S-band on an RPi3.
On my desktop based station I was experimenting with modified Satnogs flowgraphs to generate data every time a observation happens. (This has been put on hold because that station’s desktop bios somehow got corrupted. (lightning i am thinking considering the rtldsdr was also partly damaged.)
I was using the 1MSPS from before the doppler correction block.
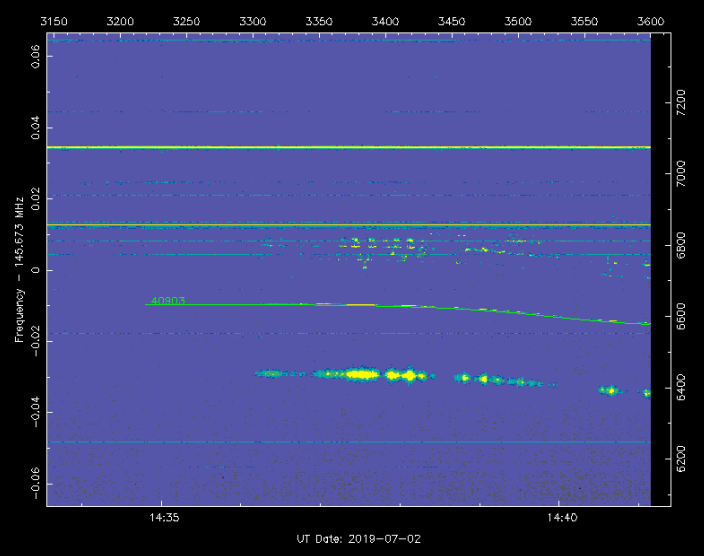
Finished reading the crash course turns out we do not NEED frequencies.txt to id, just match the freq/time doppler path with a TLE - this is a pass of AO-92 identified as, best match, 08845 METEOR 1-25 which is now inactive, next best 43137, confirmed with gpredict time control. Well that was fun
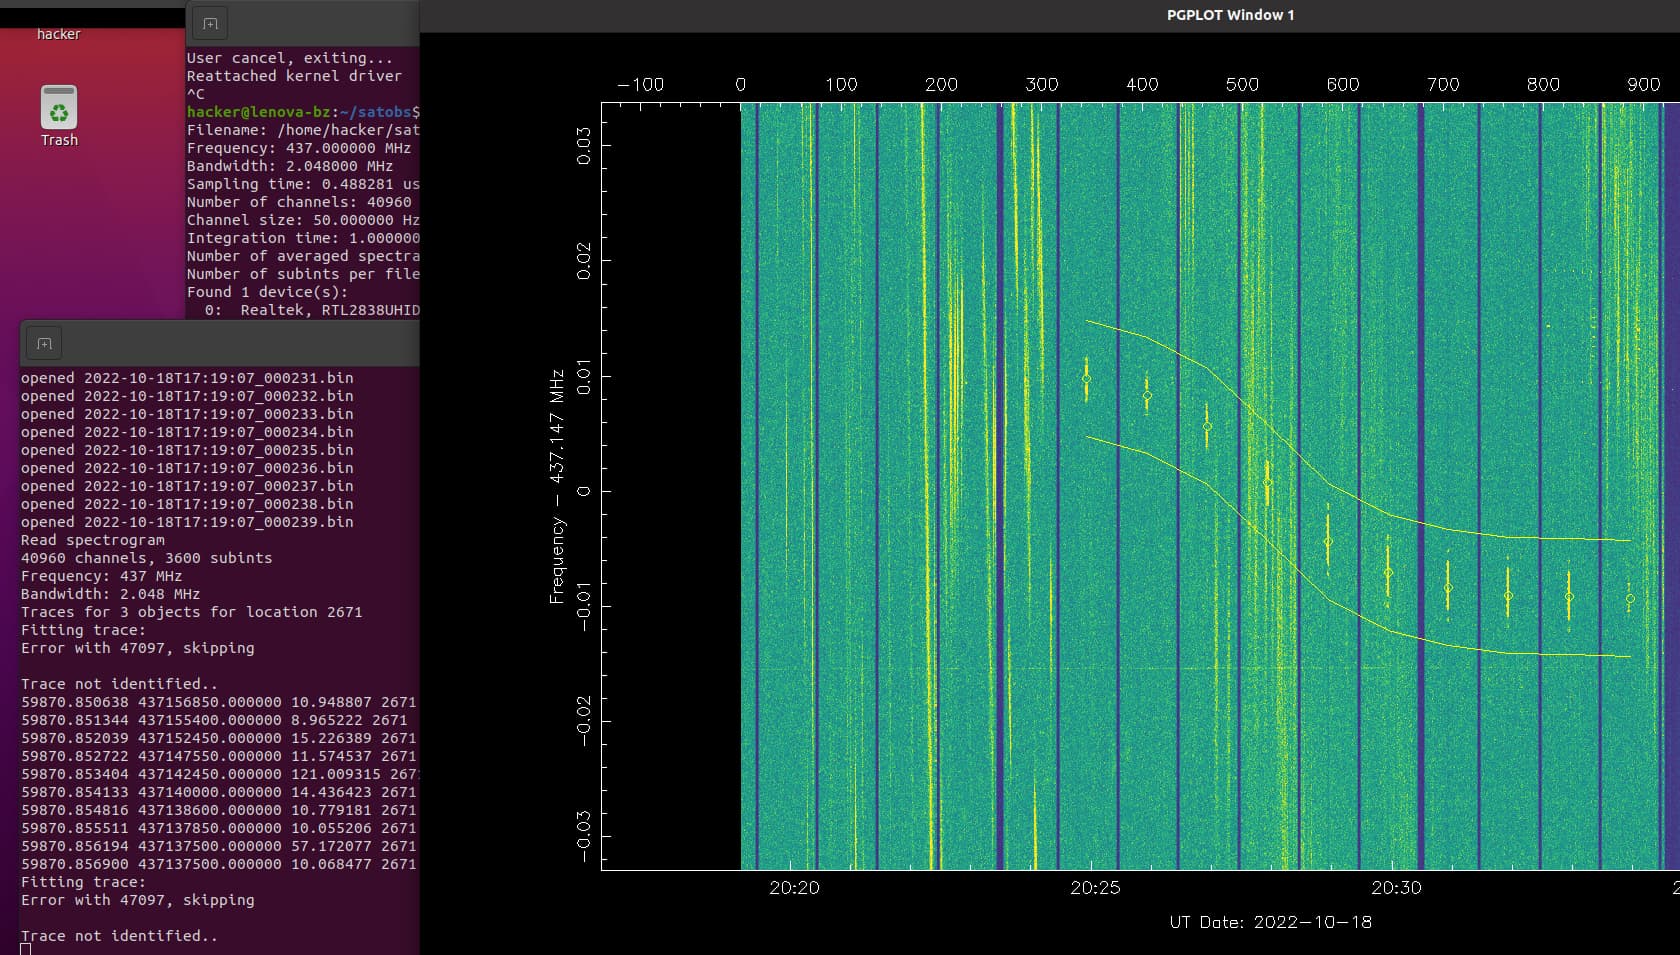
Some other tips - when collection is multiple hours of data, rfplot only reads in one hour - have to specify an offset with -s 60 to examine later periods.
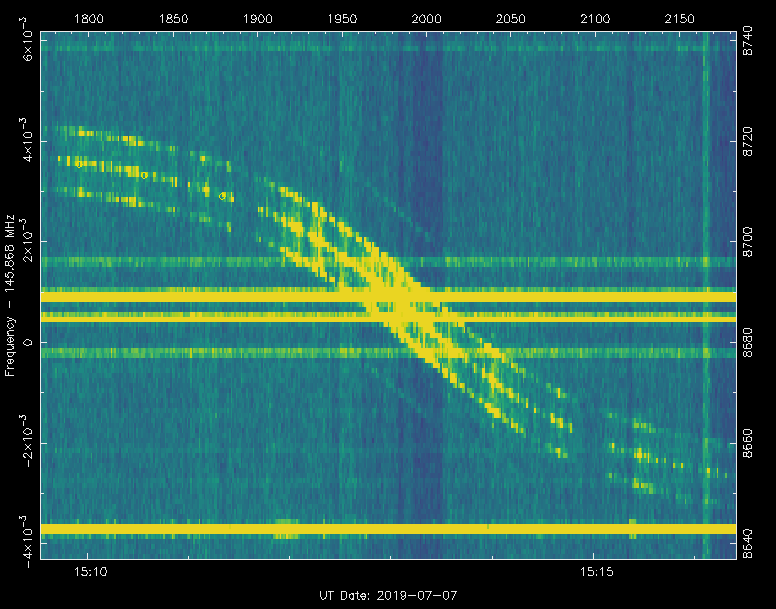
To select a faint trace that is visible but in a noisy local qrm environment , where ‘f’ cannot pick it out cleanly, use ‘D’ to create a mark.dat file of points to analyze. Picked out 32789 DELFI C3 from this that way:
Thanks all,Maybe a little late but after reading this tips I succeeded identifying both ISS and VZLUSAT-2 from my recordings. Now trying to identify my unidentified “pocsag like” satellite but no luck so far.
Hi bali. I followed your advice, downloaded the software and crash course information. Thanks for putting me on the right track.
I installed all the dependencies OK. I could not find pgplot5-dev. Do I need it? My old PC runs Mint 20.3 and can’t be upgraded without loosing all my data.
I see many files in /usr/local/bin. I cloned /cbassa/strf.git. No Errors. cd strf; make showed no errors, but sudo make install (in /usr/local) failed. I’m afraid I’m strictly hardware, and not a programmer. I tried to find more information but everything seems to point back to the //destevez.net. I need a mentor, please.
Thanks, Bob vk2byf
 Was able to build just the rffft on a satnogs Raspberry Pi w/o other dependencies: