you should read on first post before continue reading this tutorial
for example open this obs, look at waterfall:

i’m wondering what satellite is creating those signal traces on the left side (red square)?
step by step:
-
look at left bottom side of observation page, click on download artifact
-
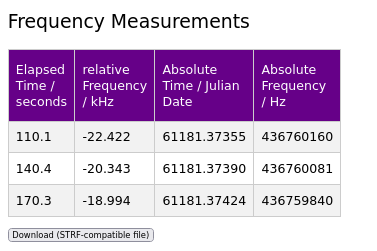
load the artifact .h5 file, and click on each signal peak in the waterfall. Each dot you click will appear in the [frequency measurements] table. Once you’re done, click the [Download (STRF-compatible file] button. total dot i create from this obs is just 3.
save as measurements.dat on /tmp folder
open your linux terminal:
cd /tmp
create bash script export.sh
nano export.sh
copy paste this
#!/bin/bash
export ST_DATADIR=/tmp
export ST_COSPAR=4451
create data folder inside /tmp
mkdir /tmp/data
create sites.txt and fill with groundstation data location:
nano /tmp/data/sites.txt
copy paste this
4451 SN -8.73560 115.19480 10 SatNOGS No.4451
4451 = groundstation number
-8.73560 115.19480 = latitude, longitude
10 = sea level
run export.sh
. ./export.sh
download tle from satnogs db, save as satno-tle.txt on /tmp
edit measurements.dat
nano measurements.dat
replace 9999 with current groundstation number , in this example my groundstation number is 4451
now final step, run strf - rffit
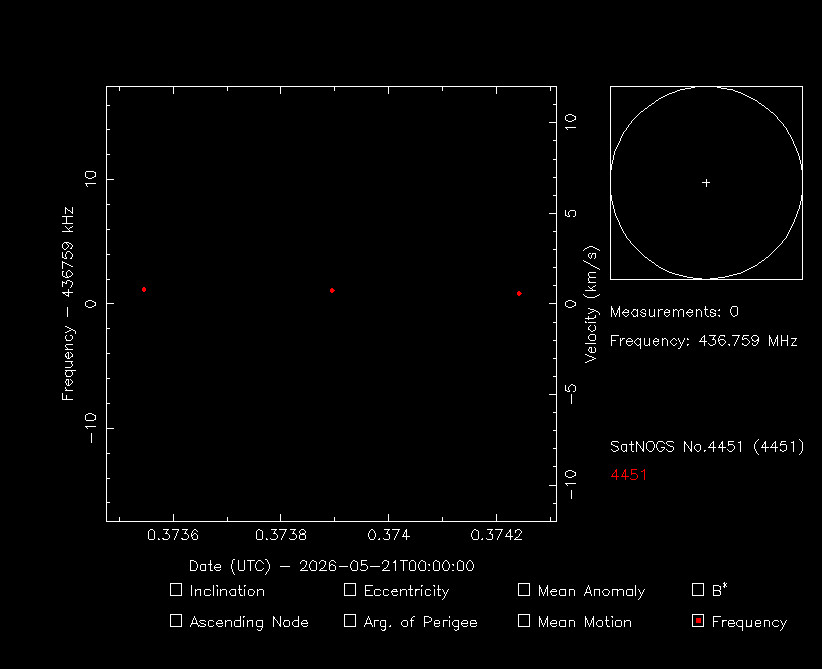
rffit -d measurements.dat -c satno-tle.txt -s 4451
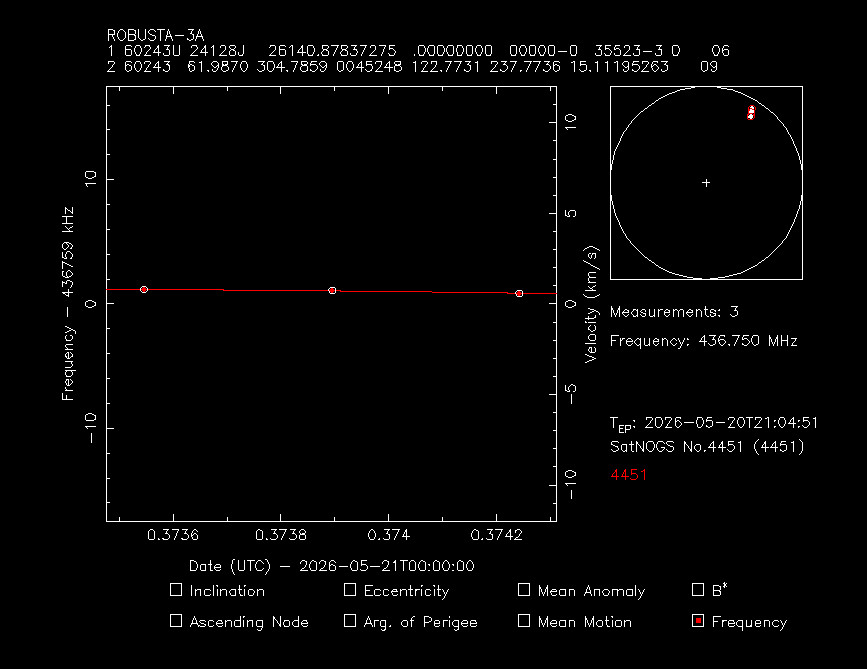
you will see 3 red dot on screen:
now press s (select all)
then press i
now on terminal will ask question:
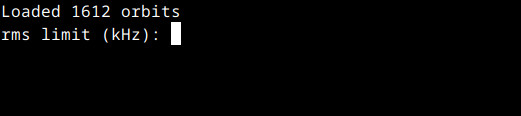
more smaller number, more accurate. ok i put 1 for 1 khz deviation, then enter
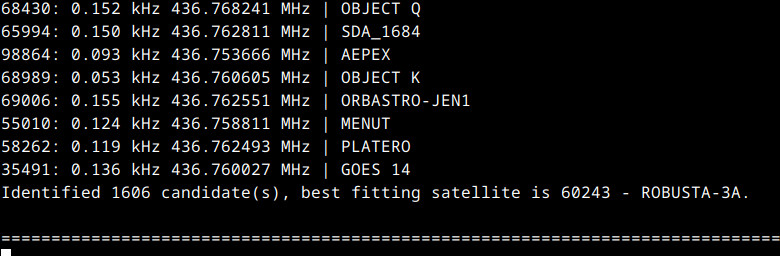
hurray. we got the name suspected sat. Robusta-3A
now look back on main screen, you will see the current Robusta TLE, and frequency = 436.750 MHz:
ok now its time to validation, to make sure this is right robusta…
open https://db.satnogs.org, search robusta-3a, check at transmitter tab:
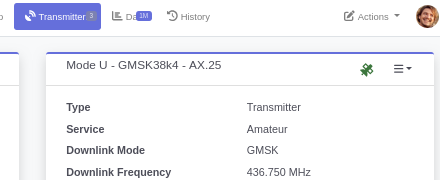
same freq !
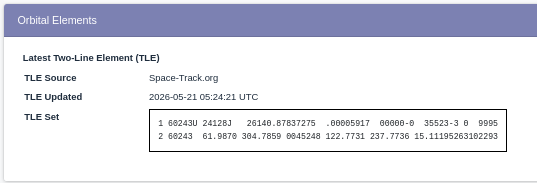
move to data tab, and copy paste the TLE:
now back to SatNOGS Artifacts - Waterfall Viewer, paste the TLE on:
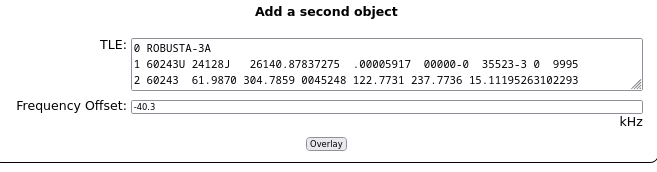
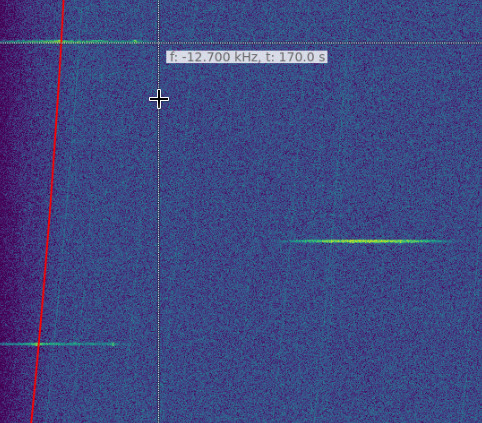
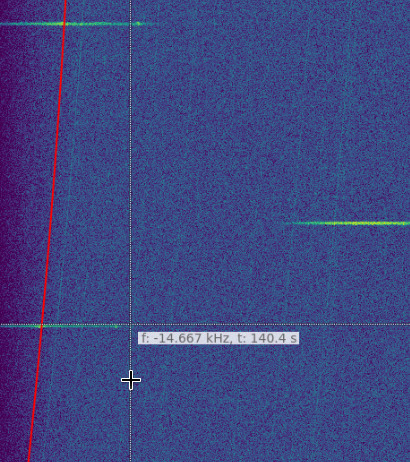
click overlay button, result:

beautiful ! if you check and compare the signal interval with other robusta observation on network you will found the interval is 30 seconds.
or faster just look at the table:
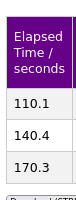
that make me sure, this is true robusta signal.
if you happy with this tutorial, dont forget click love and bookmark. thank you!
![]()
all file in this tutorial:
measurements.dat.zip (241 Bytes)
satno-tle.txt (240.0 KB)
14122171.h5.zip (1.7 MB)
sites.txt (54 Bytes)
73!
bali