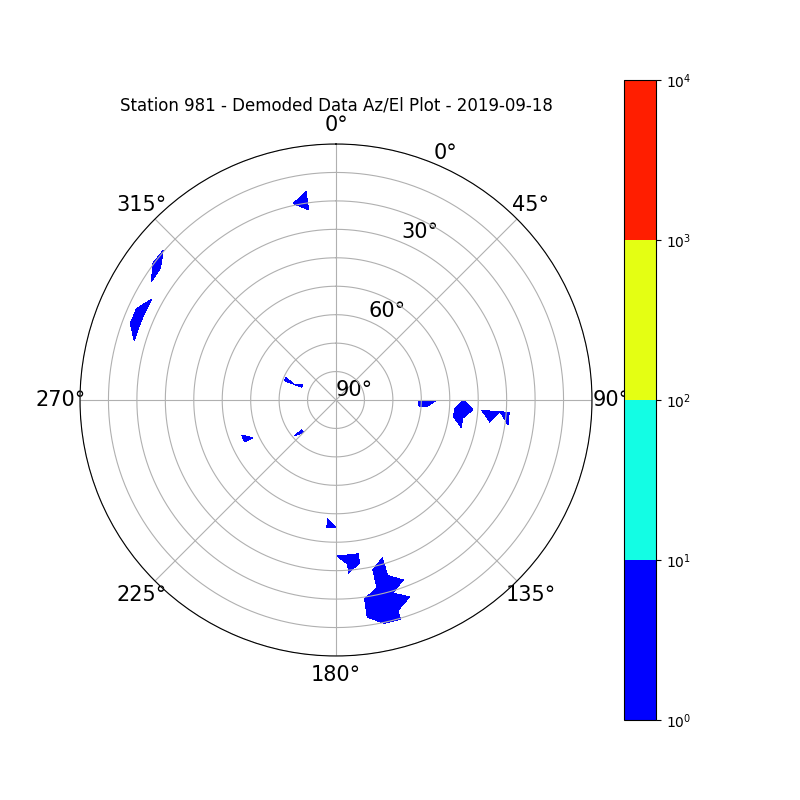
Bellow you can see az/el plots by https://gitlab.com/kerel-fs/satnogs-AzEl-plots script of @kerel based on @pierros initial script . Data used for these plots were extracted from satnogs-network and can be found in their csv format in this zipped file: 2019-09-18.zip (9.4 MB) .
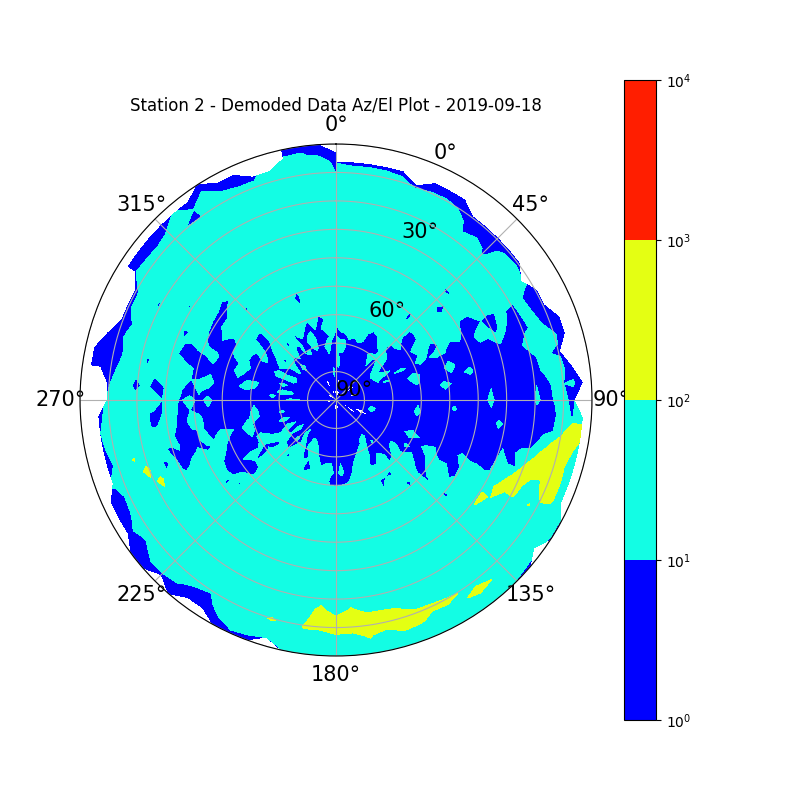
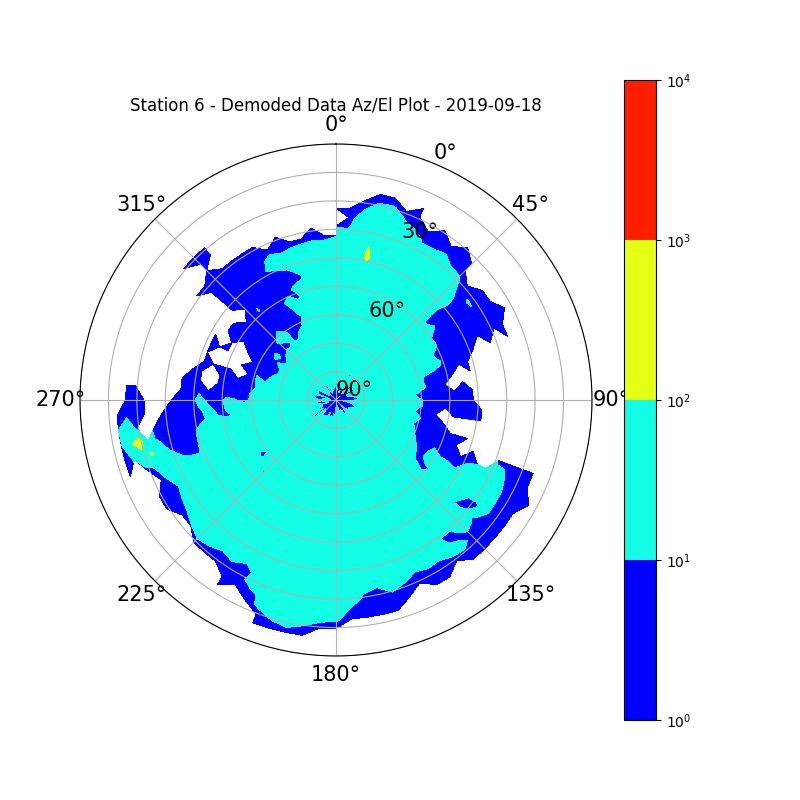
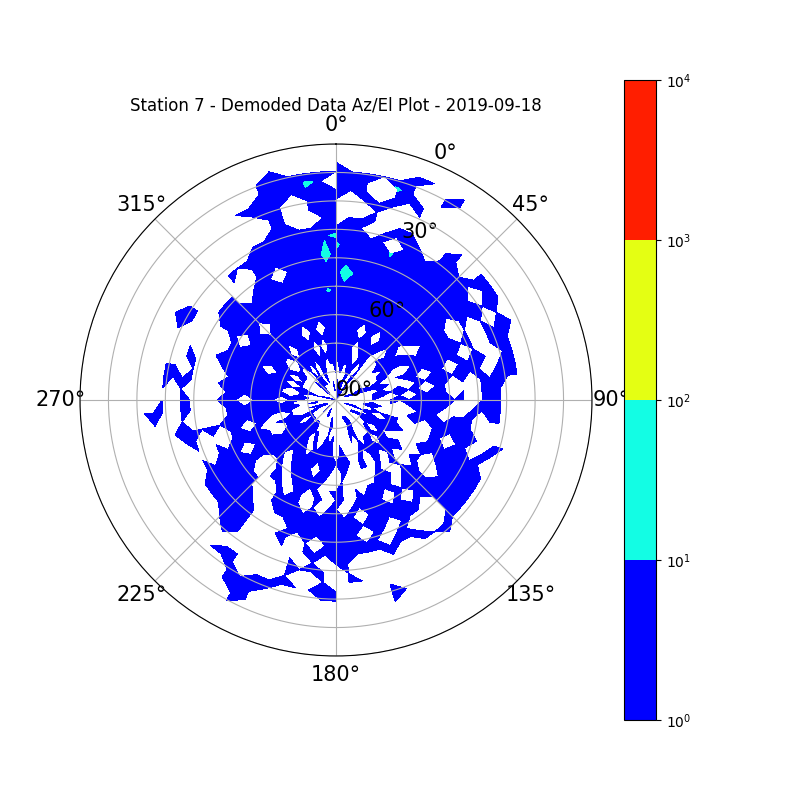
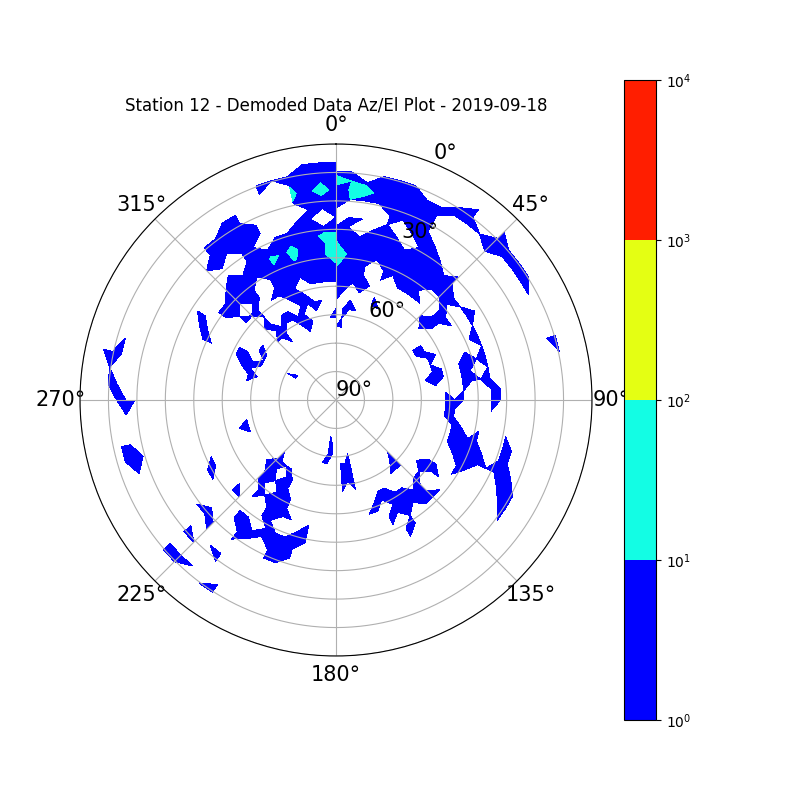
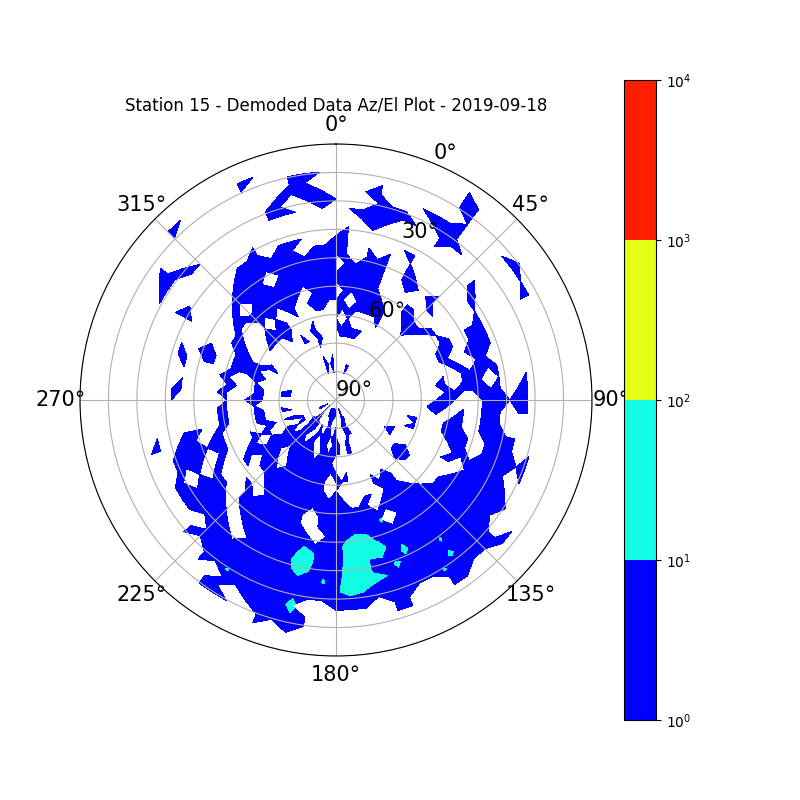
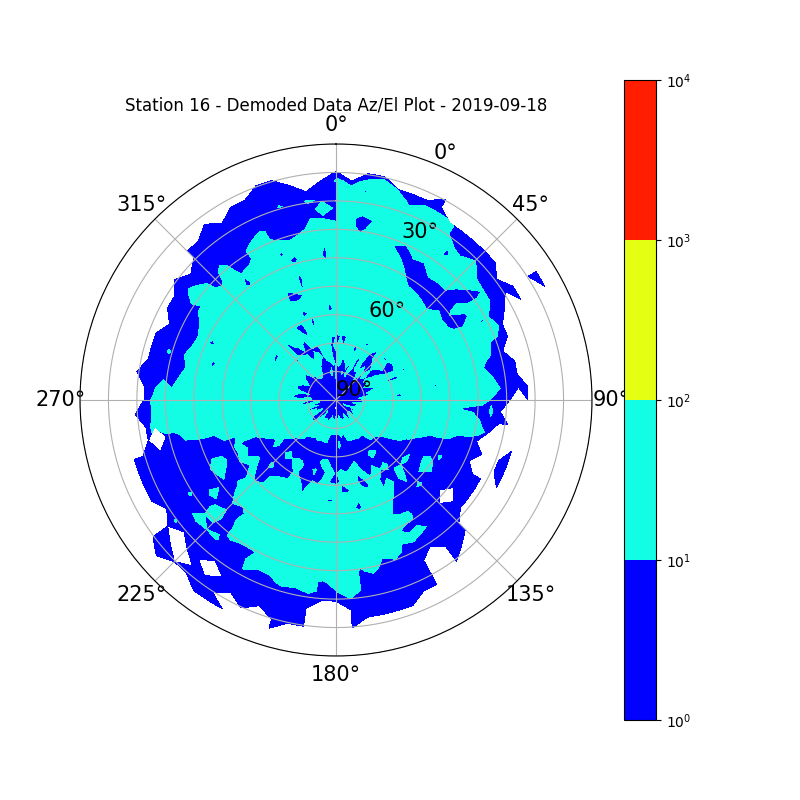
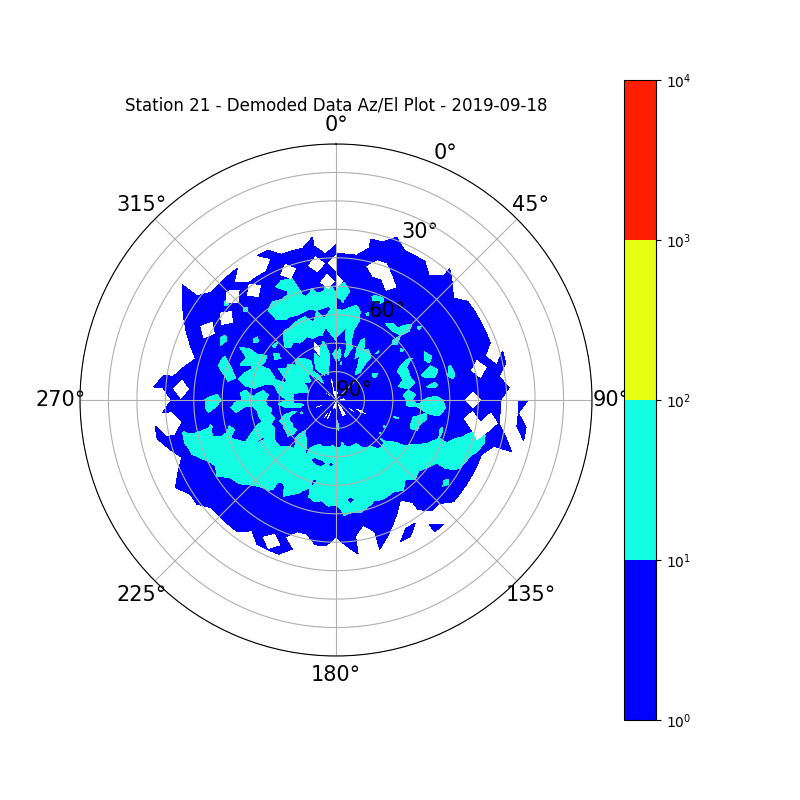
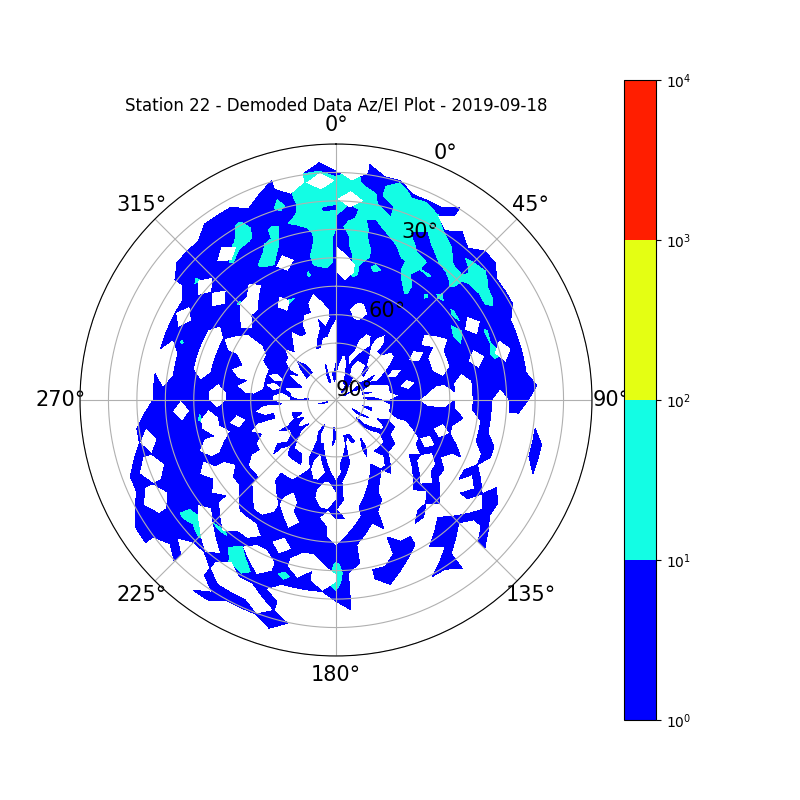
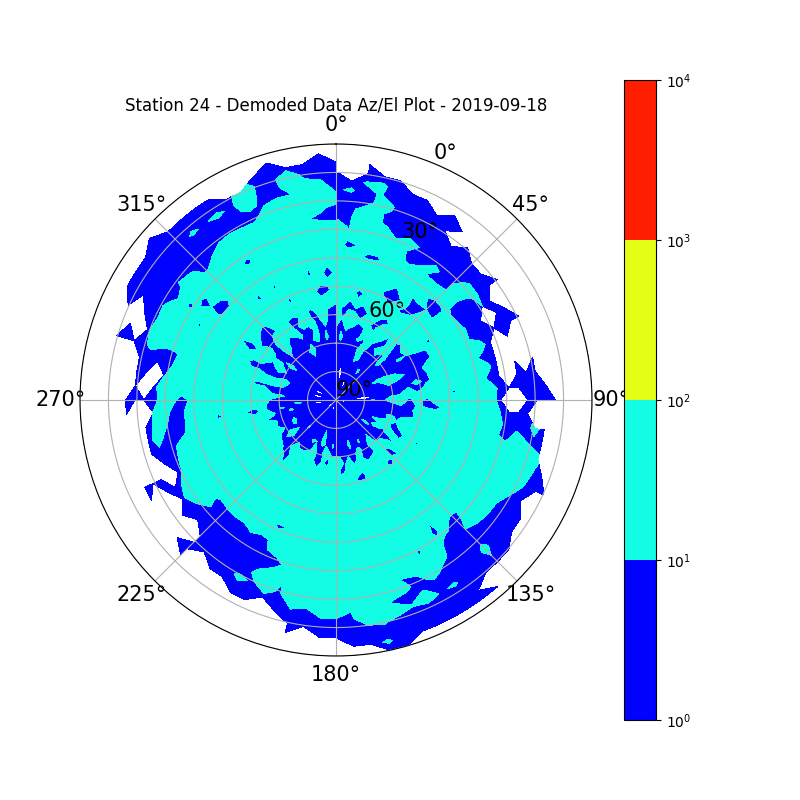
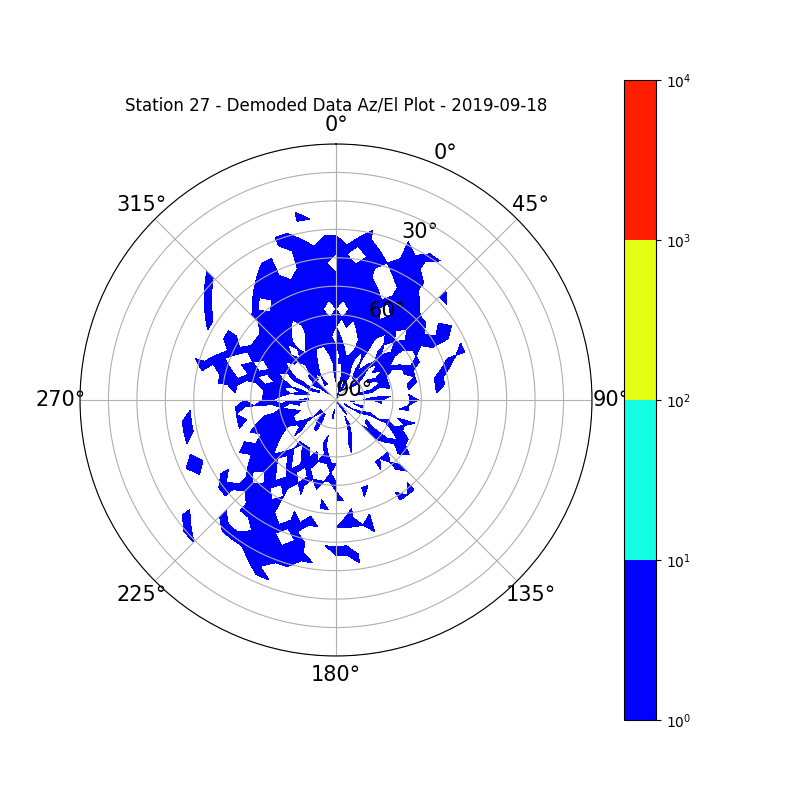
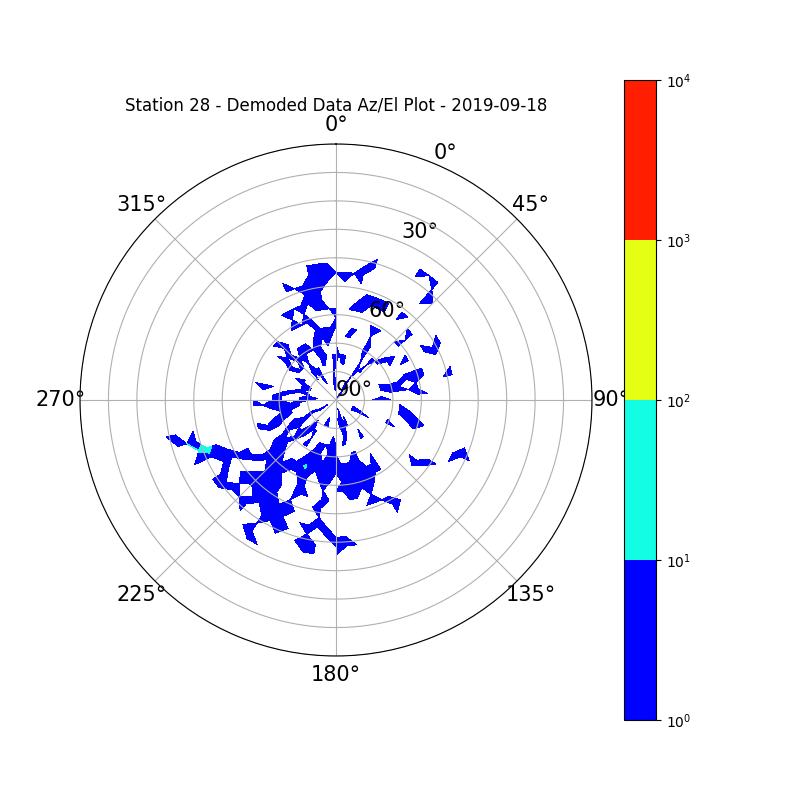
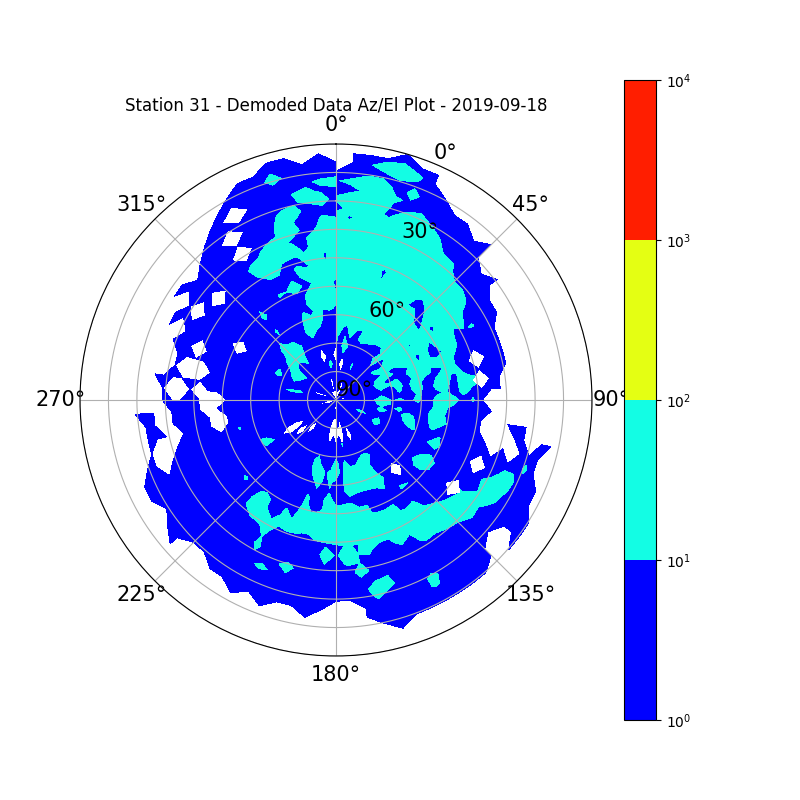
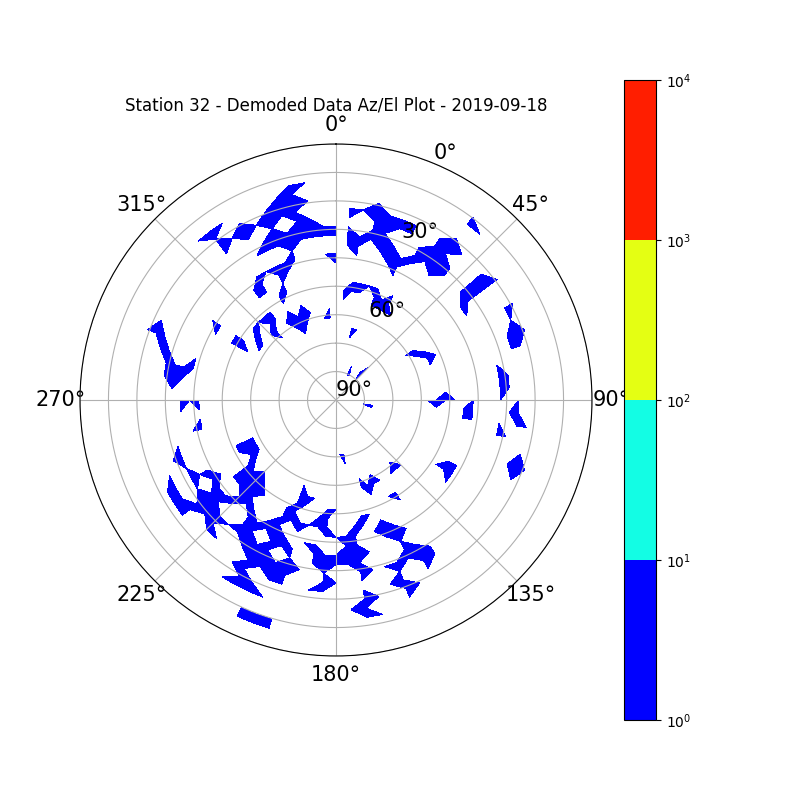
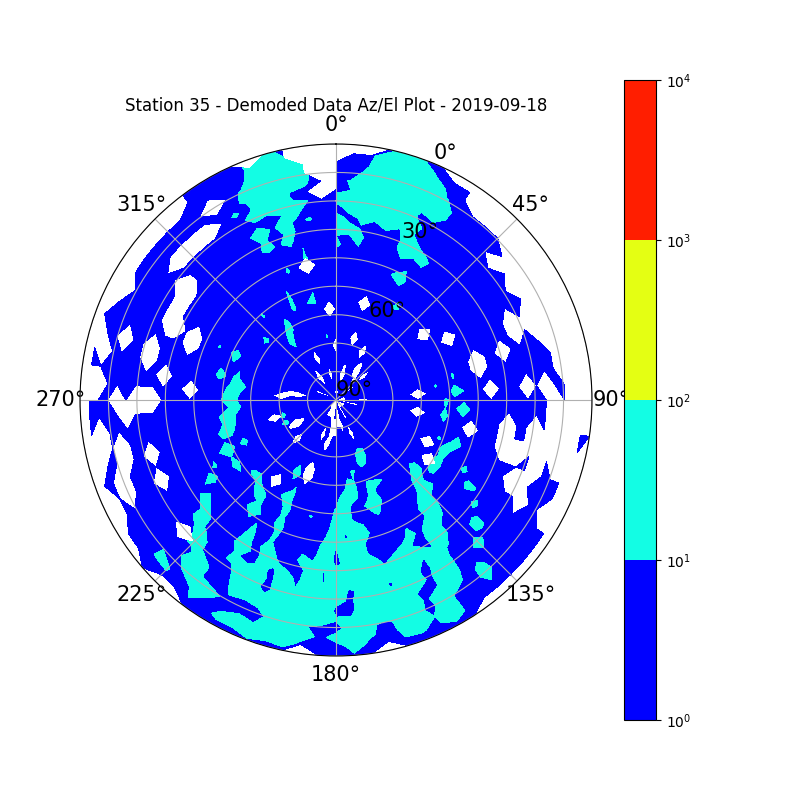
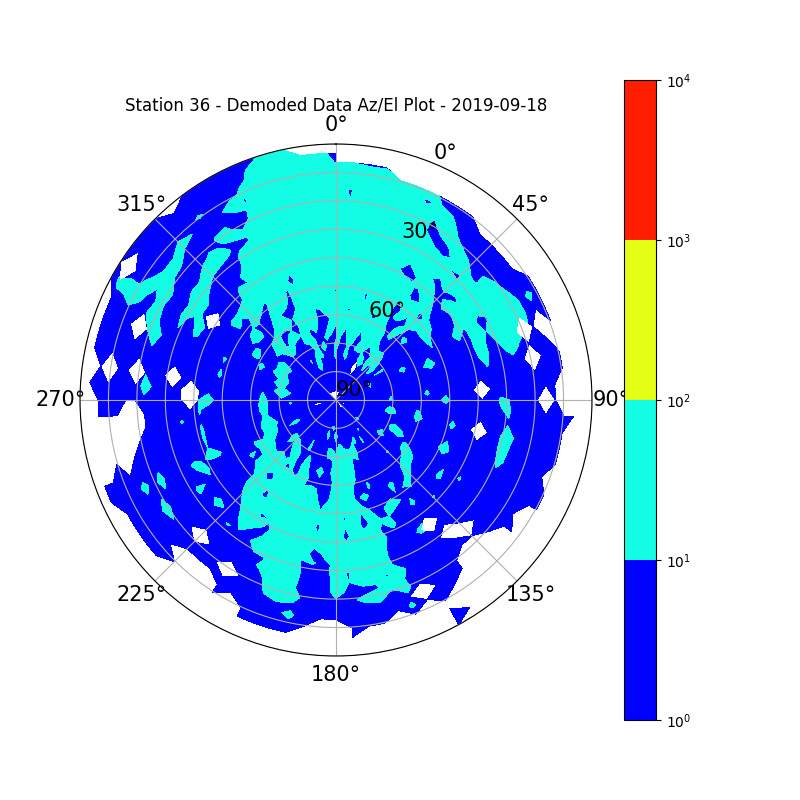
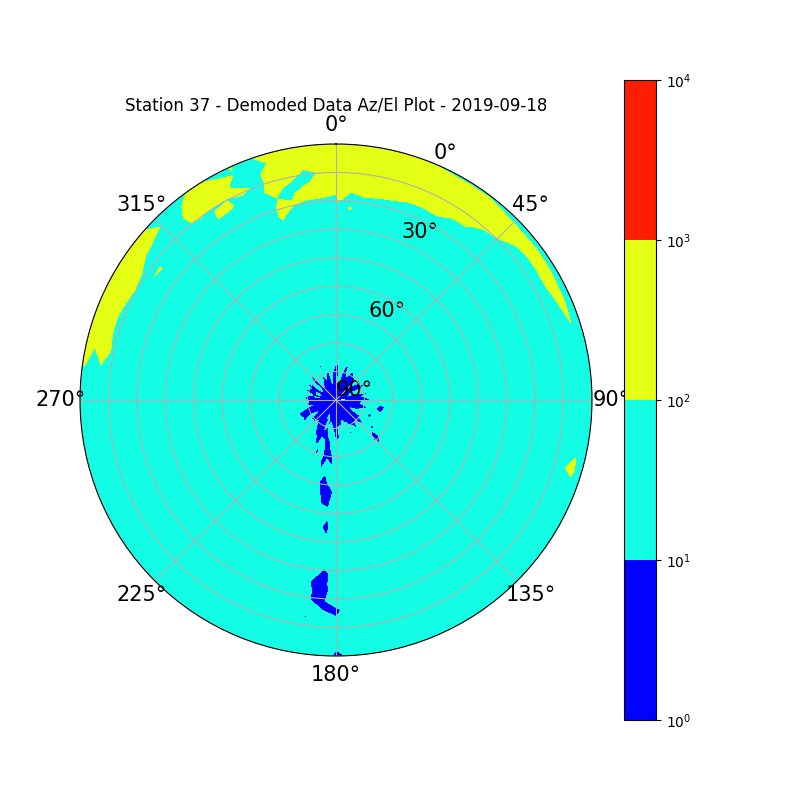
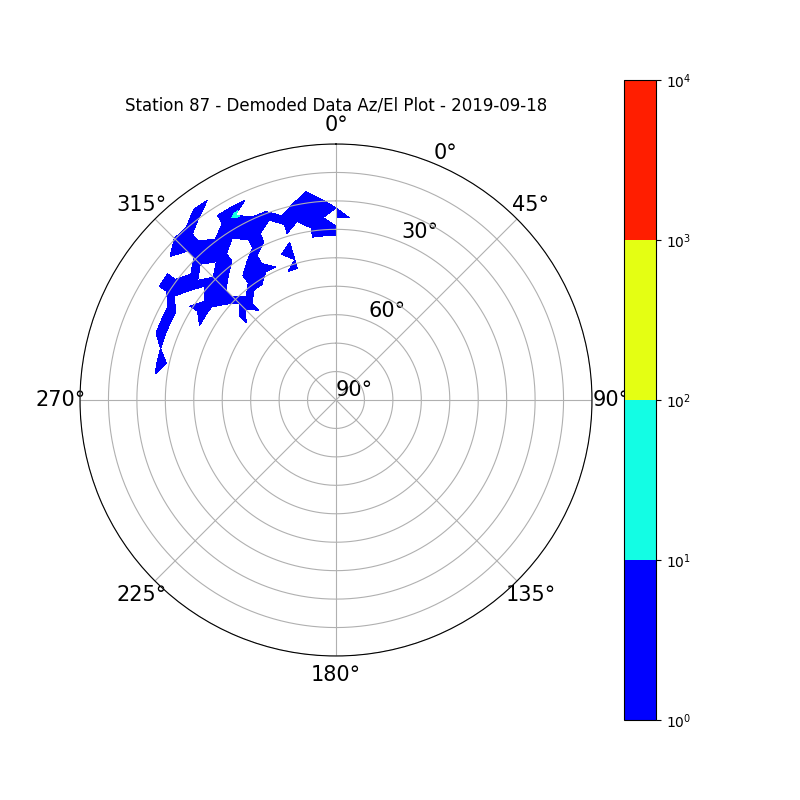
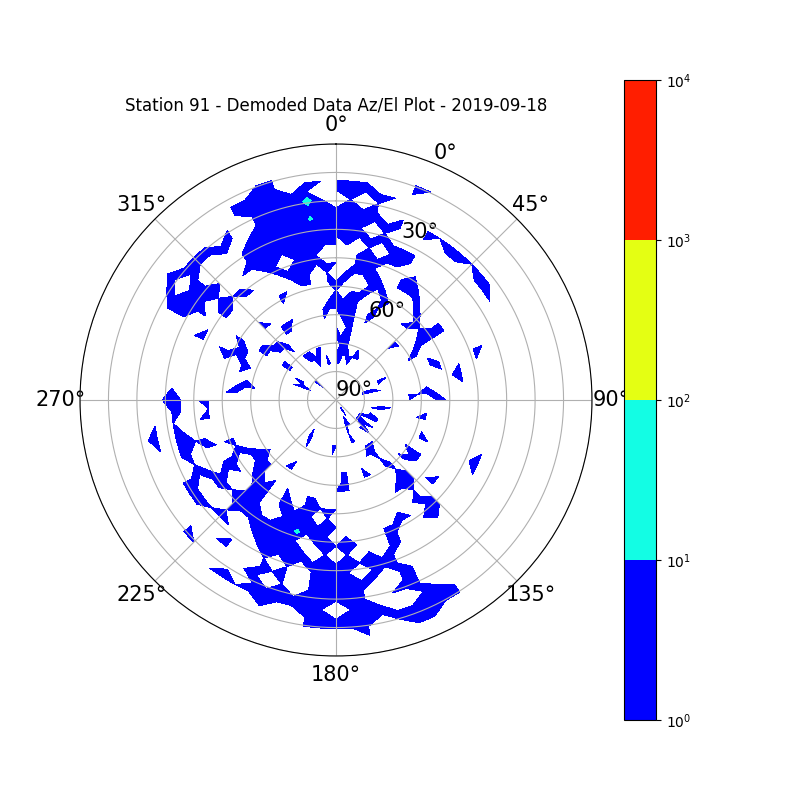
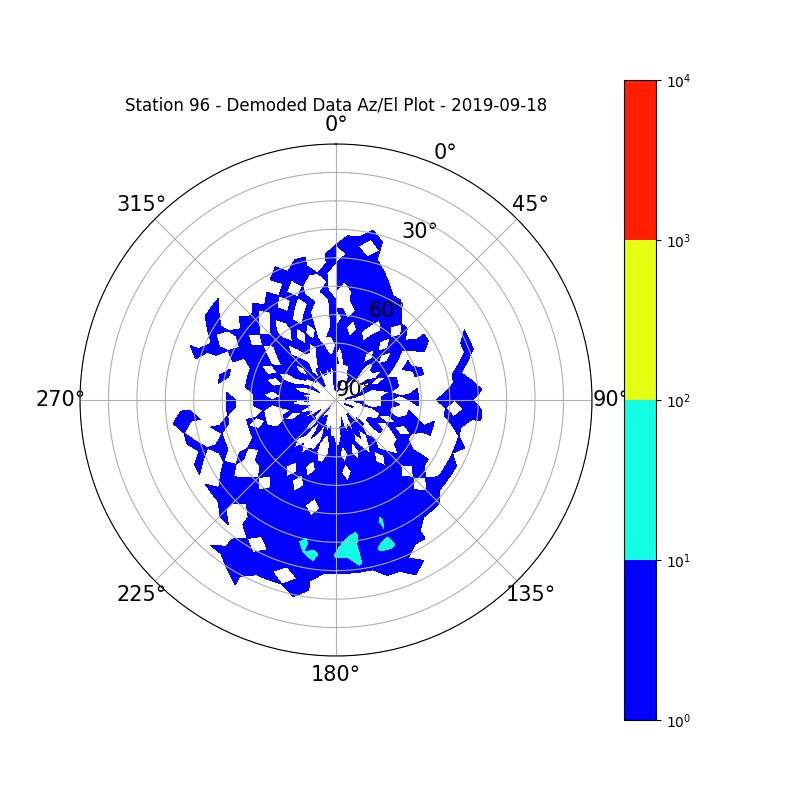
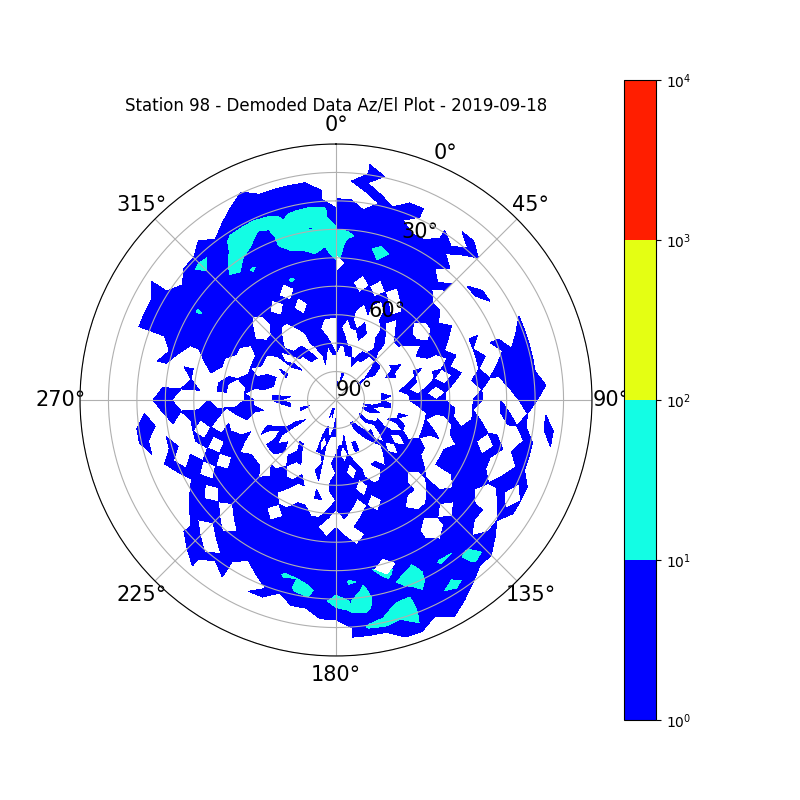
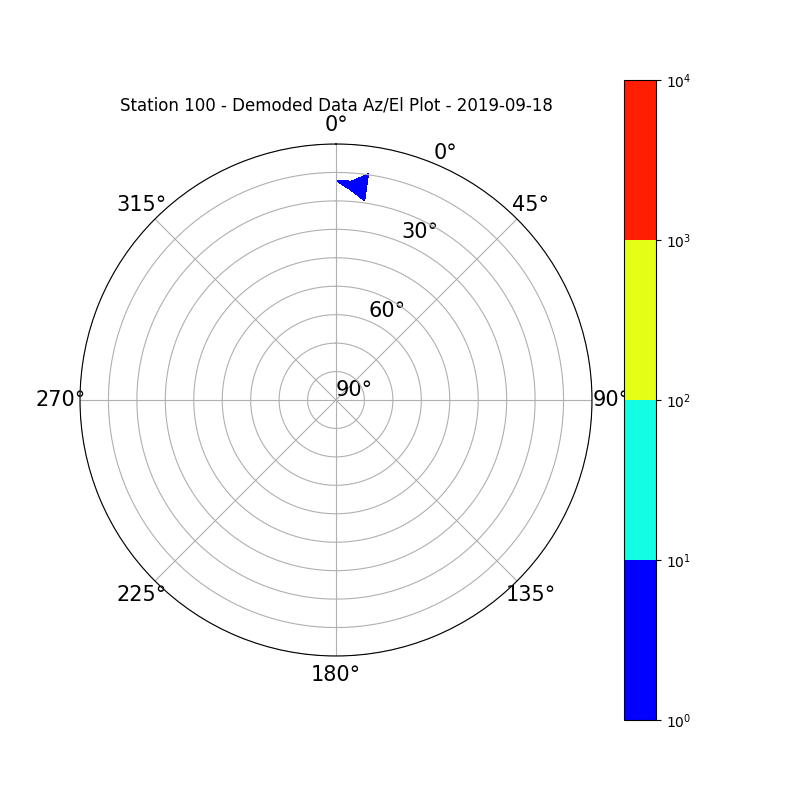
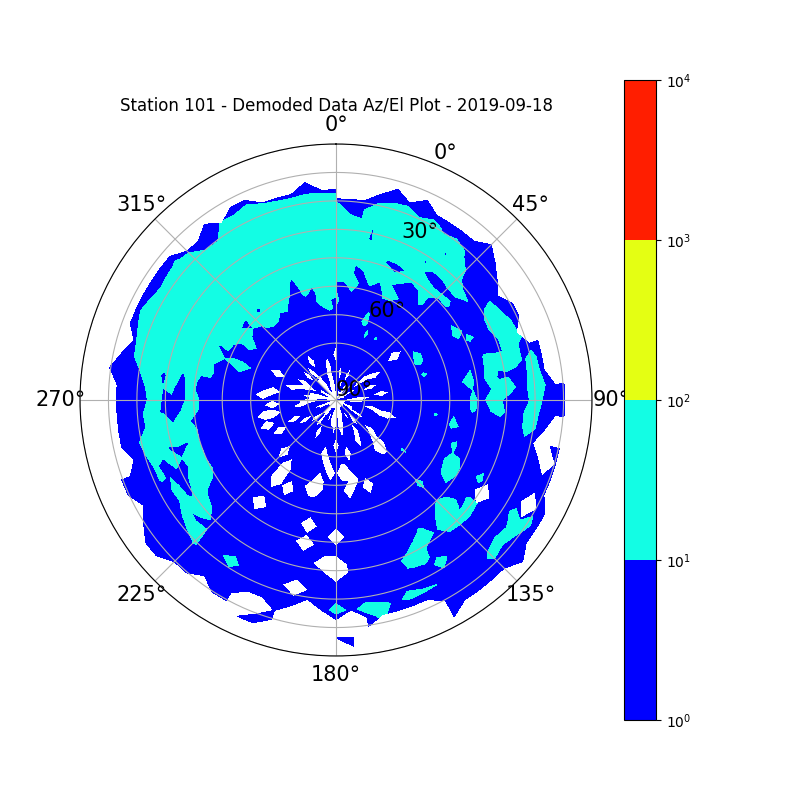
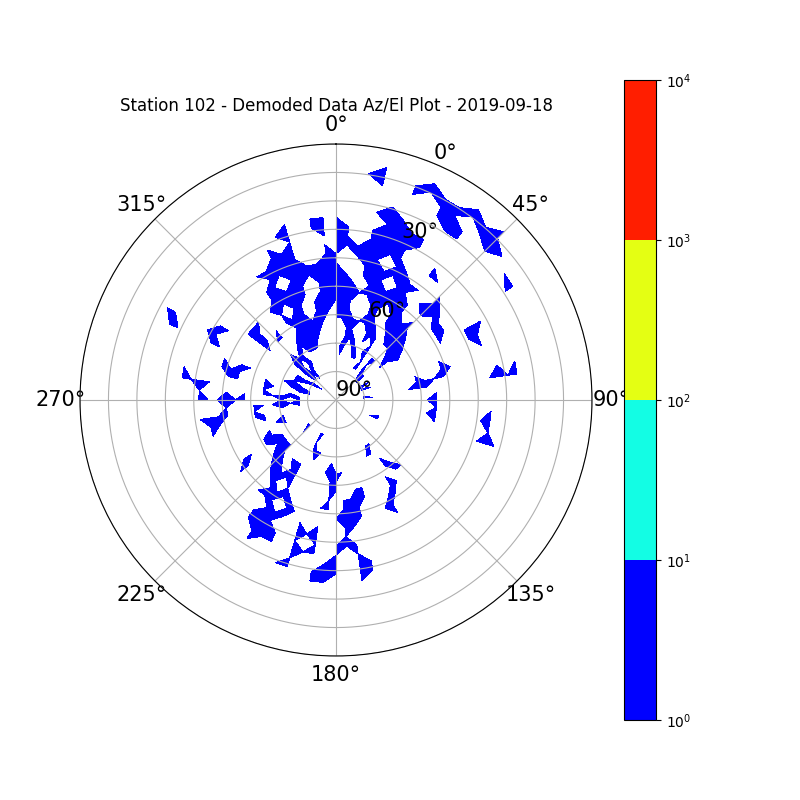
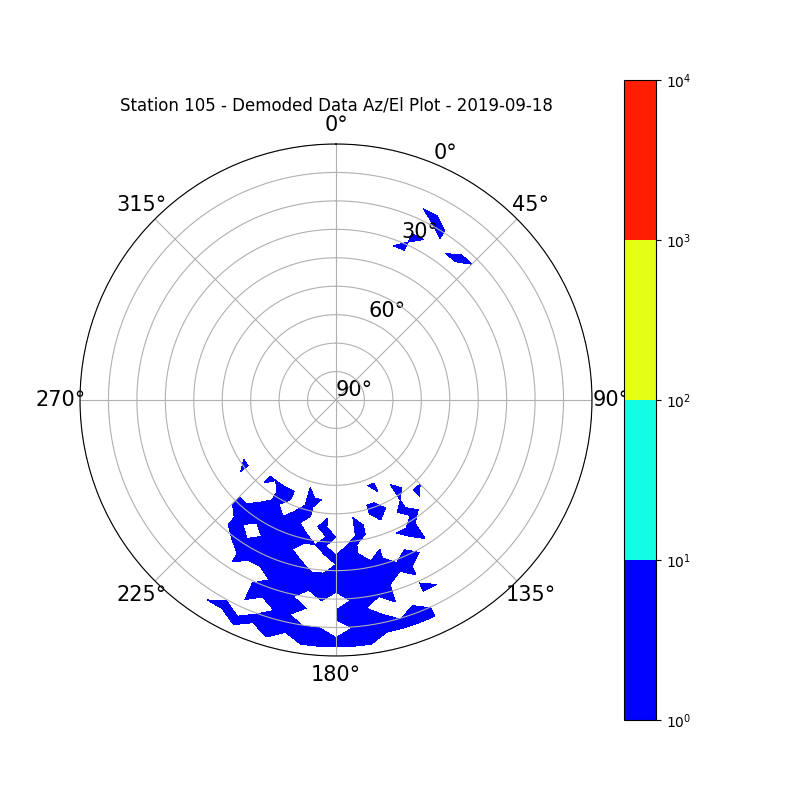
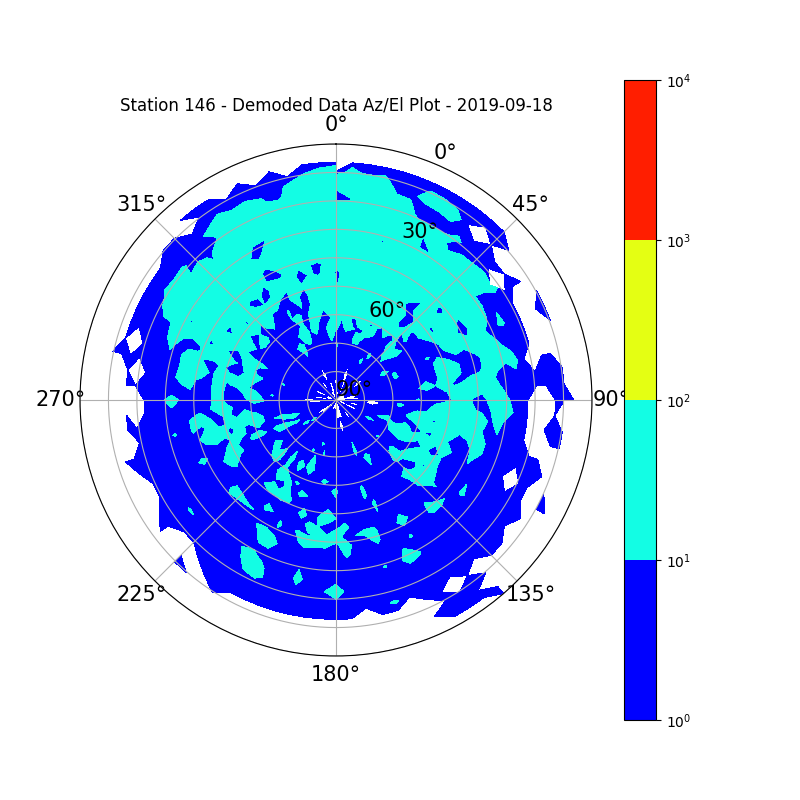
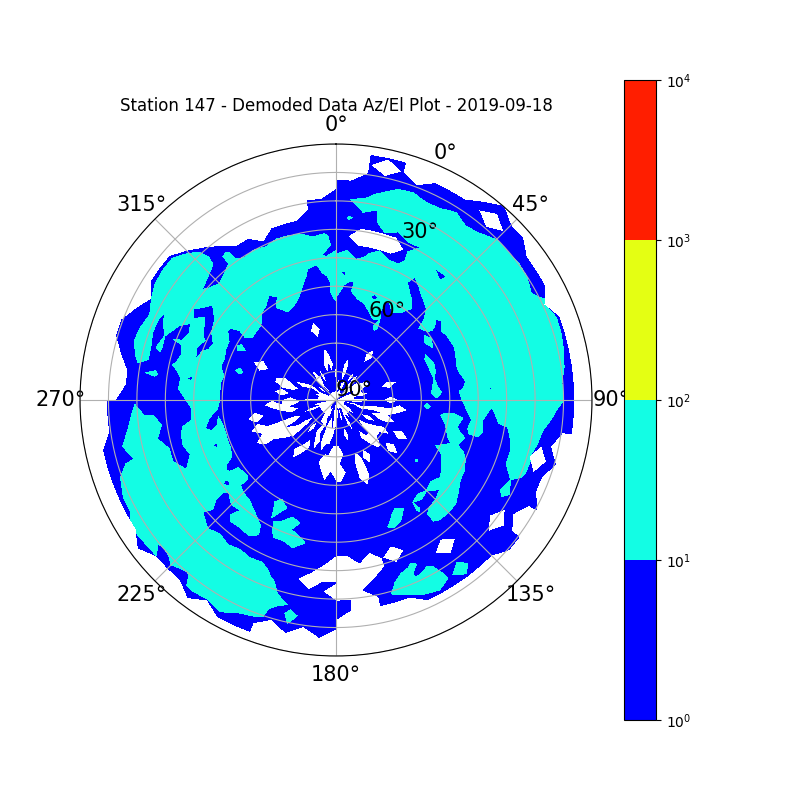
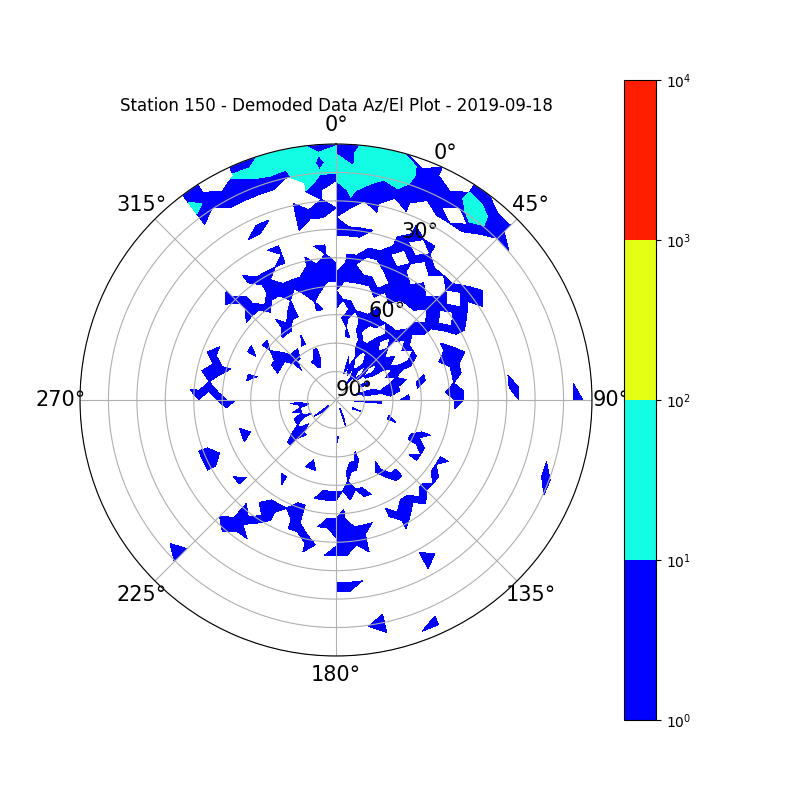
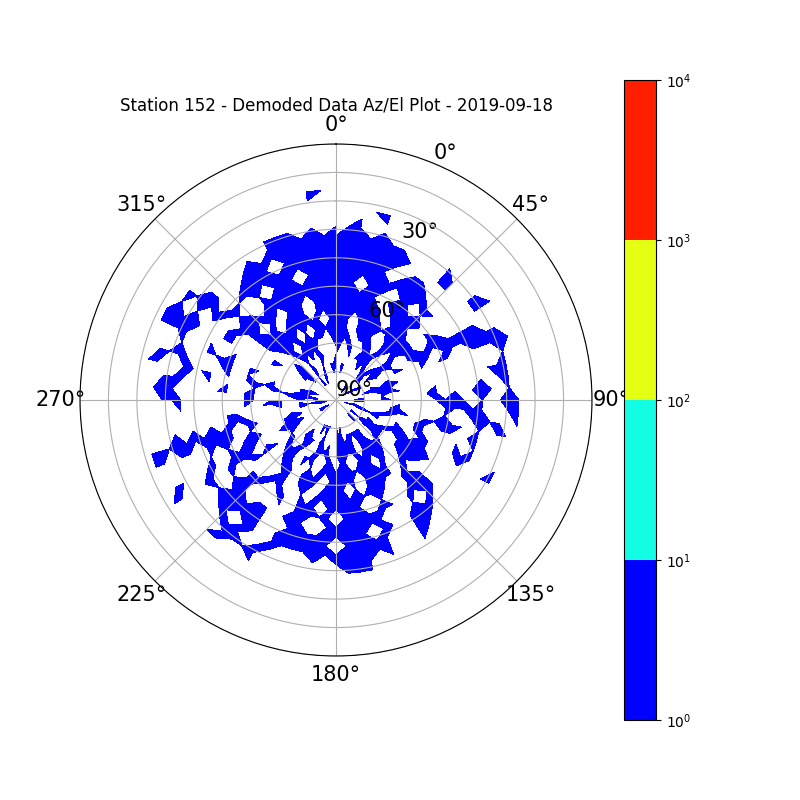
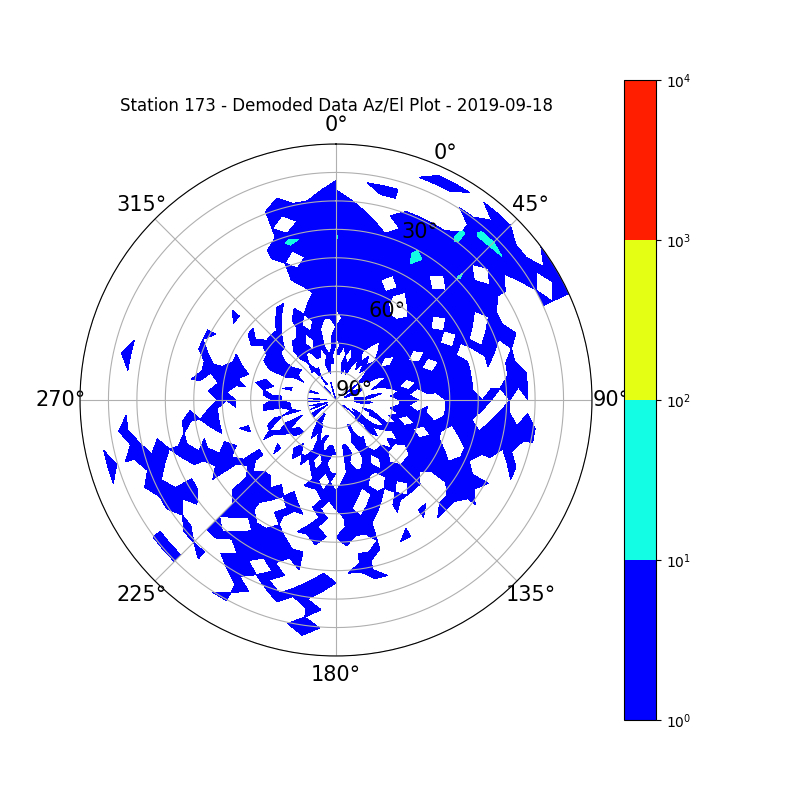
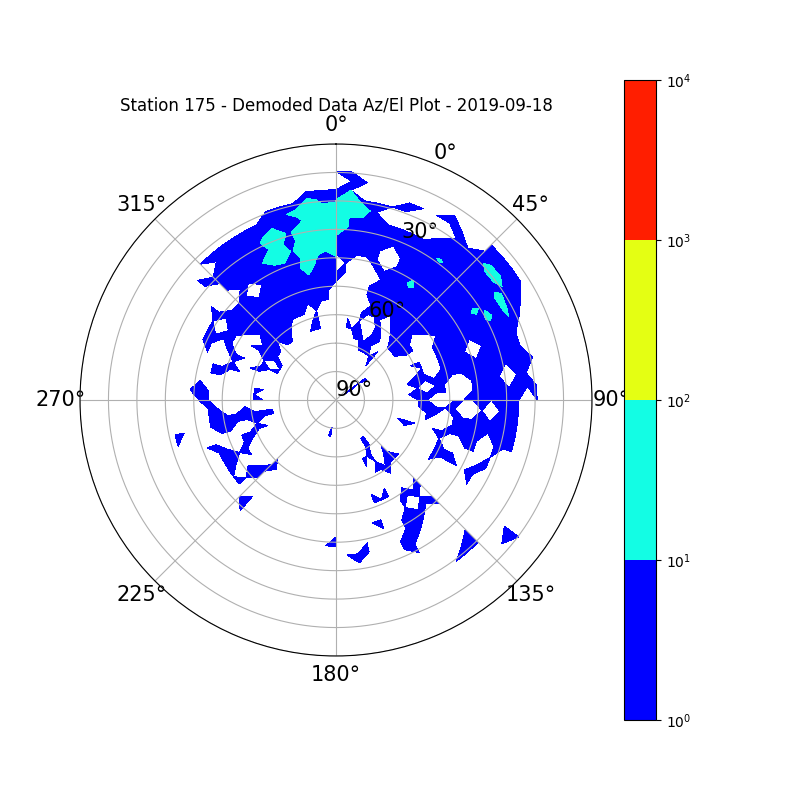
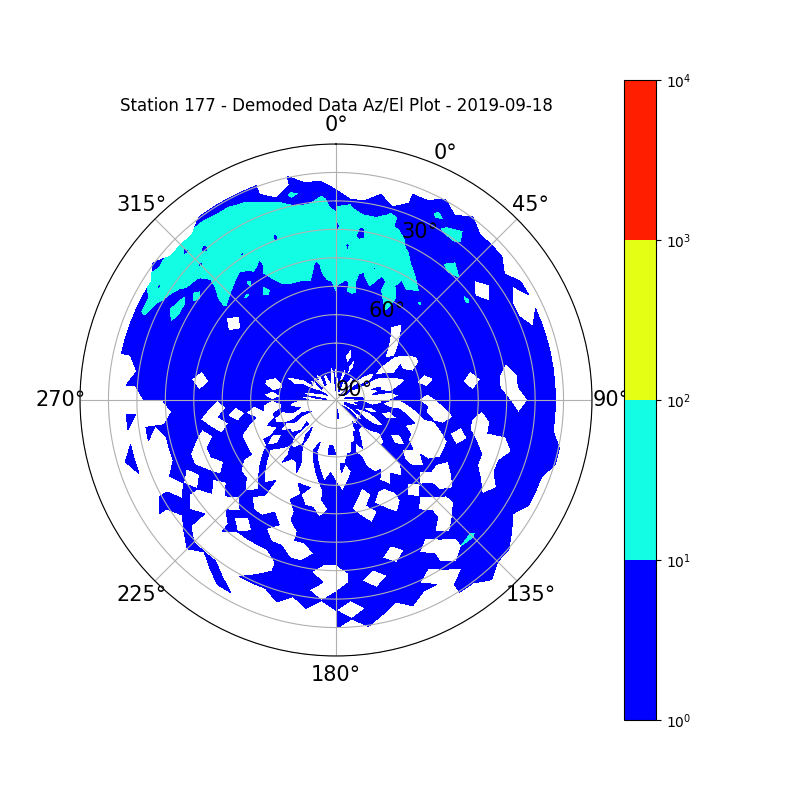
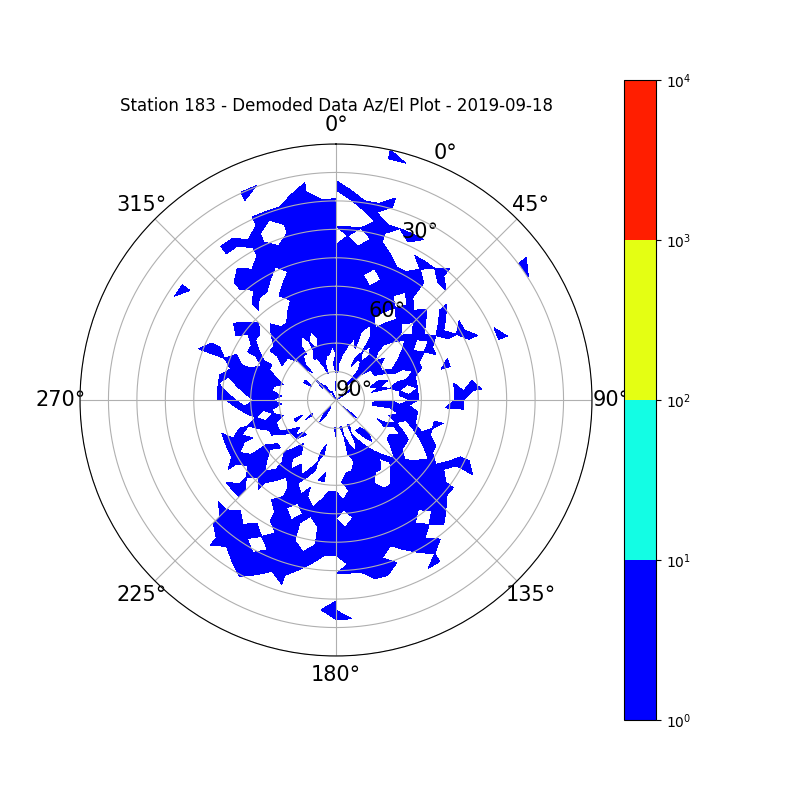
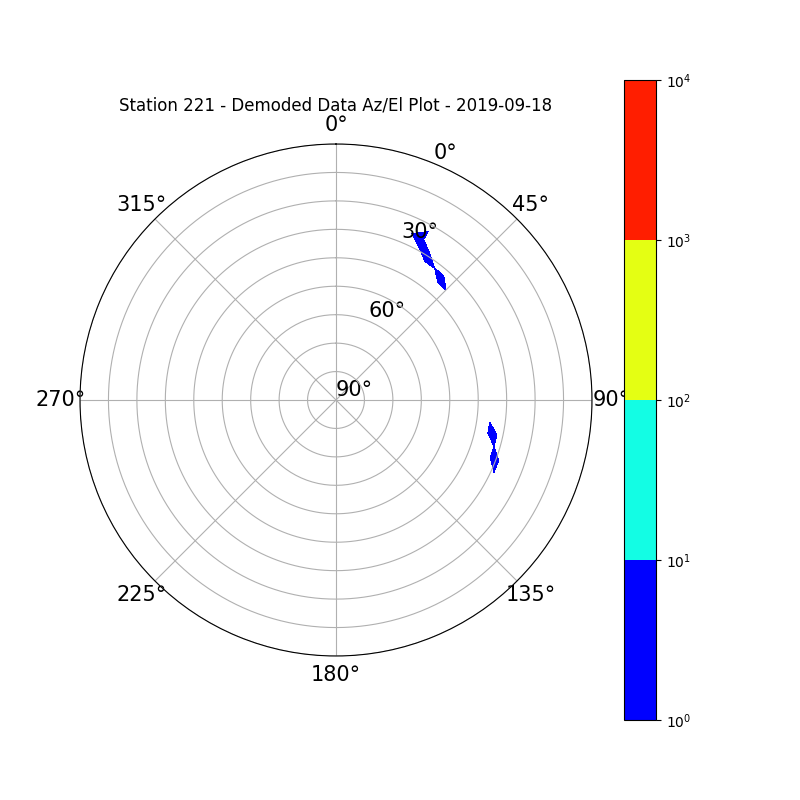
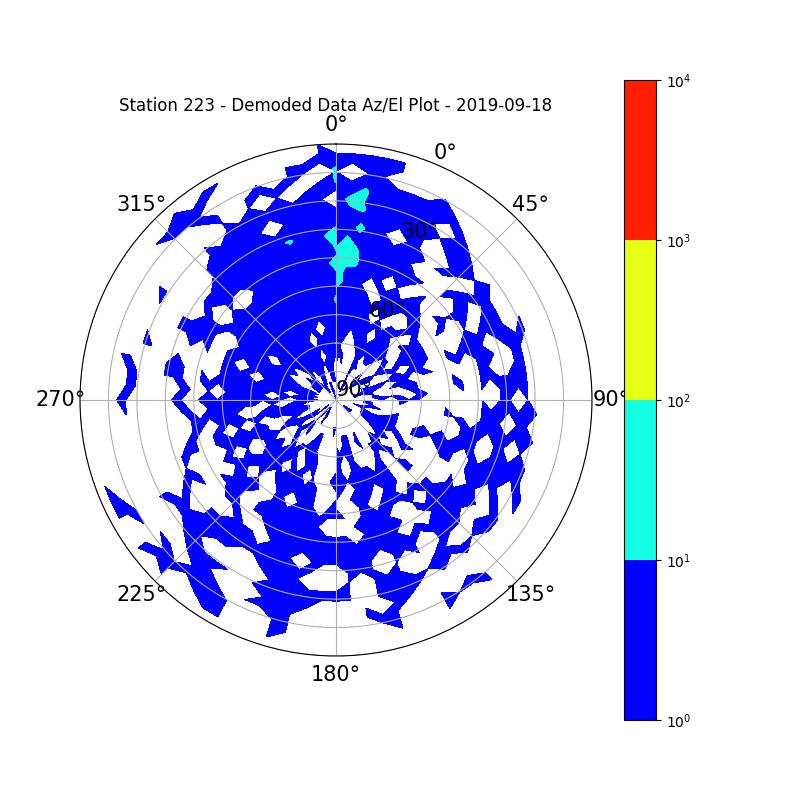
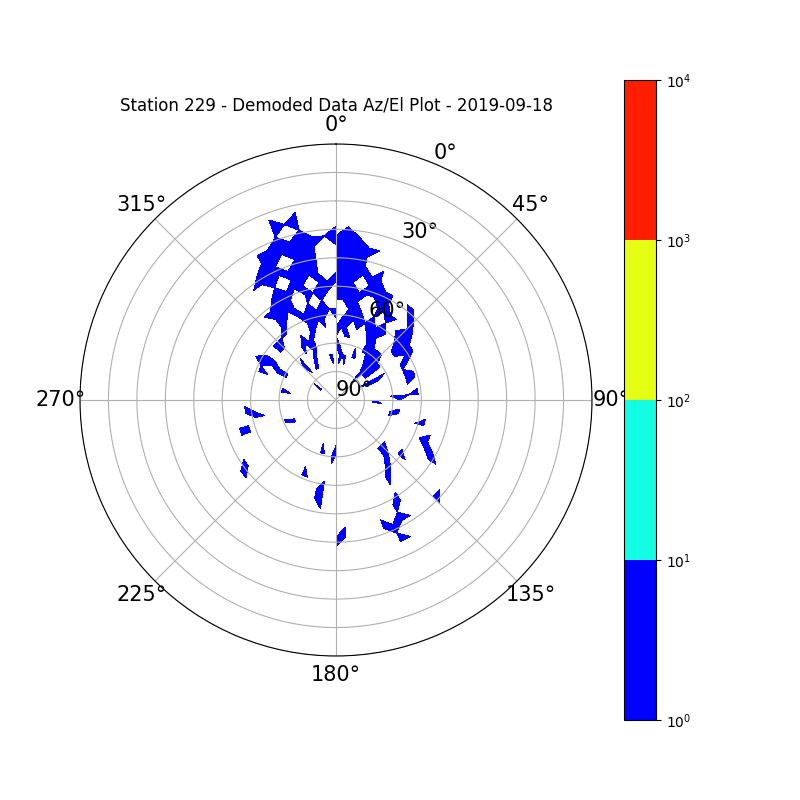
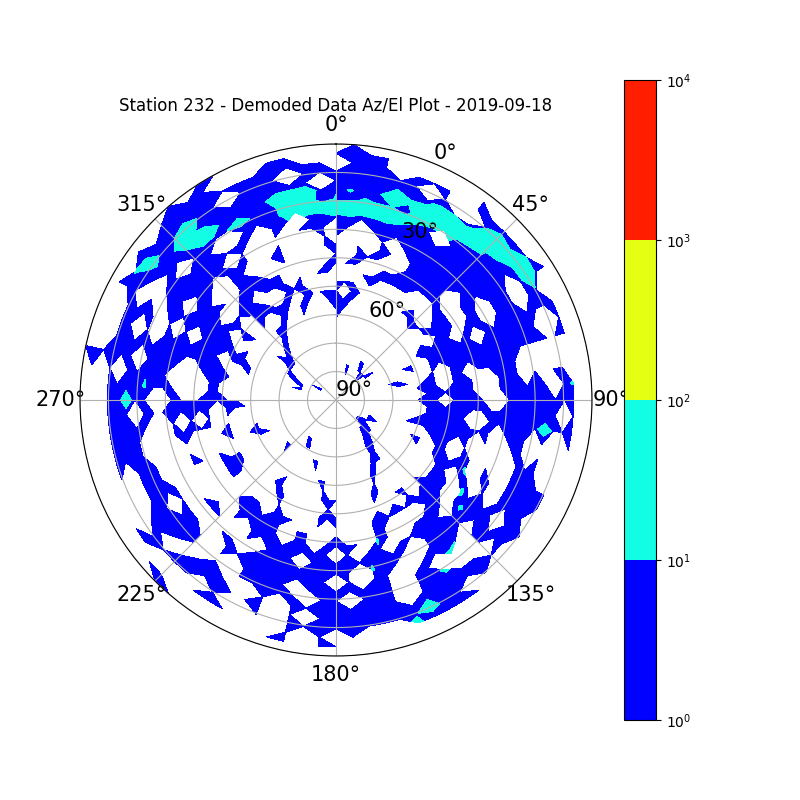
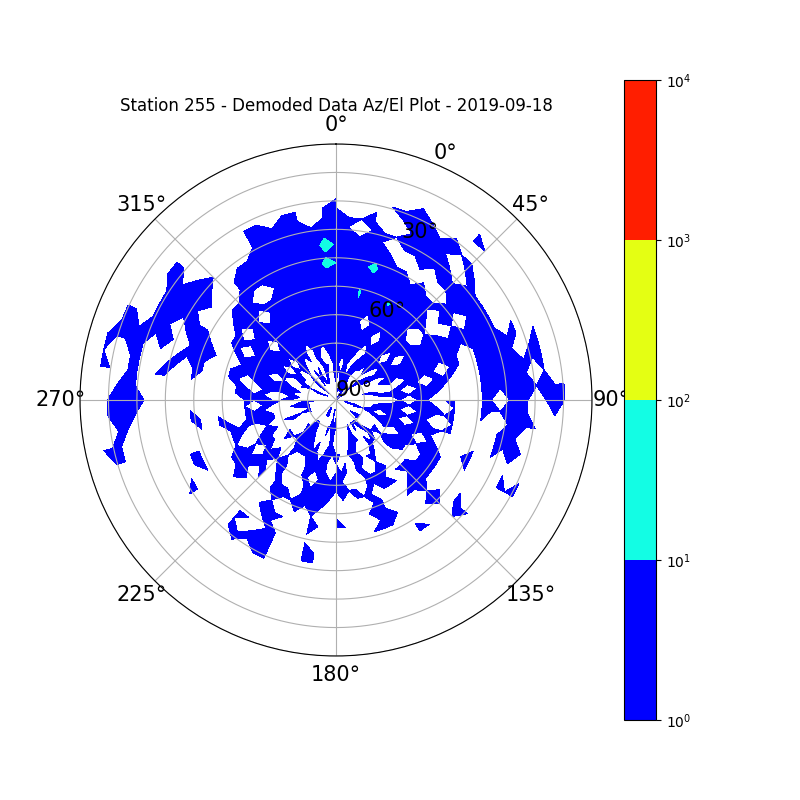
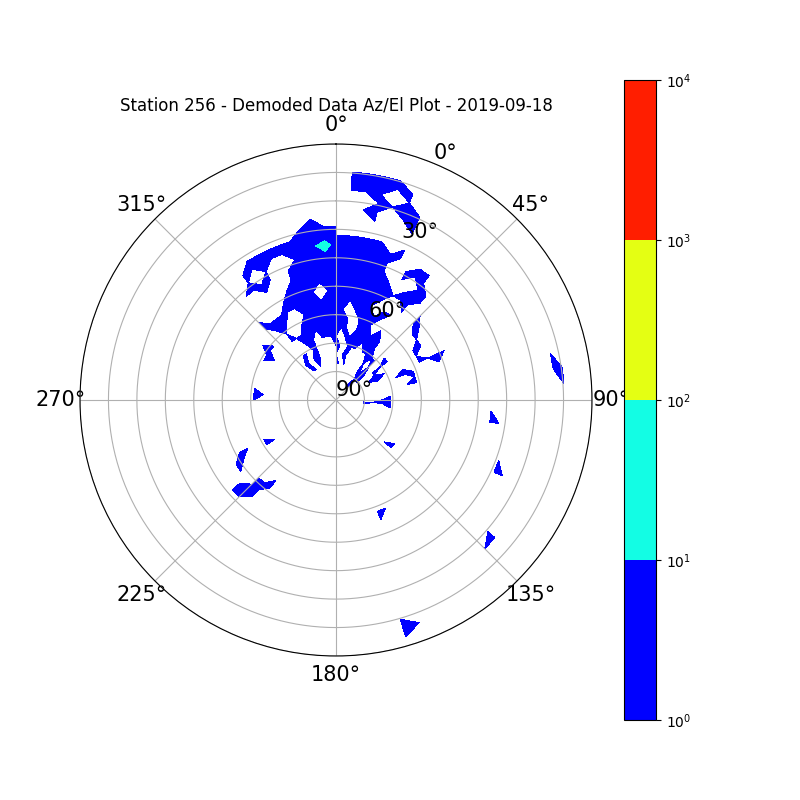
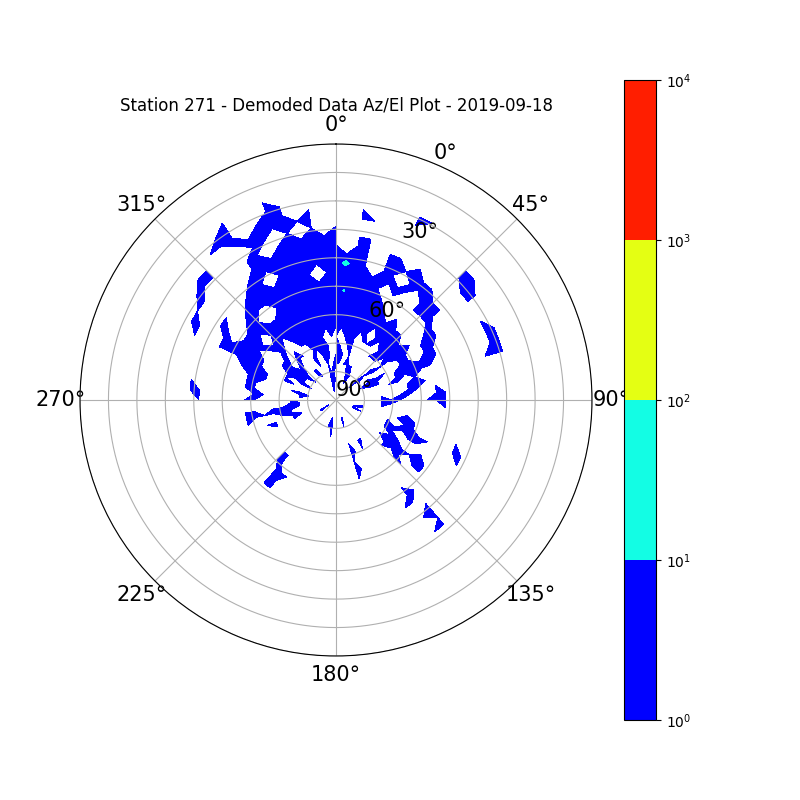
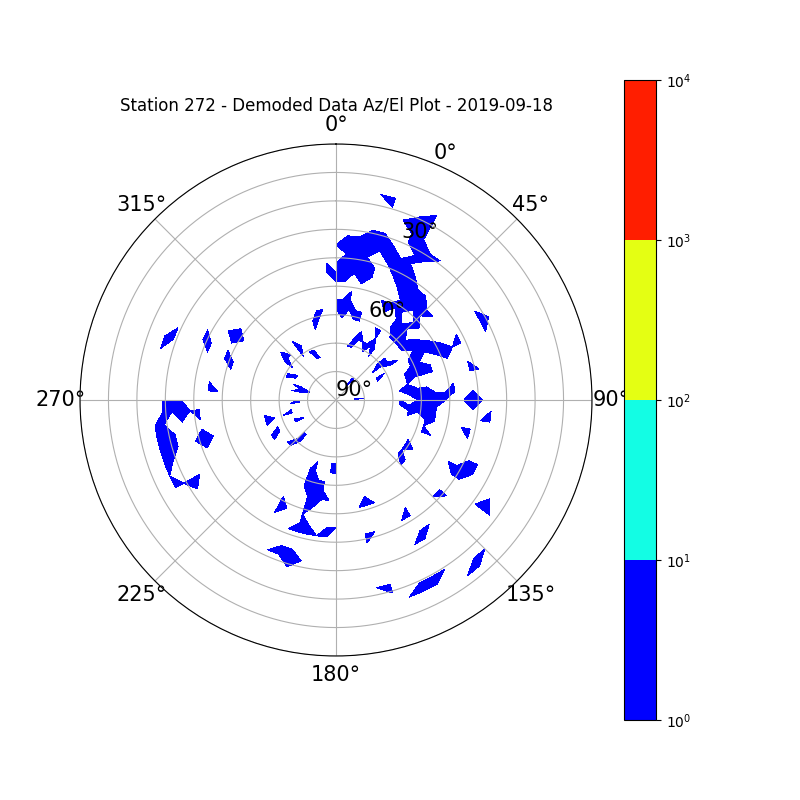
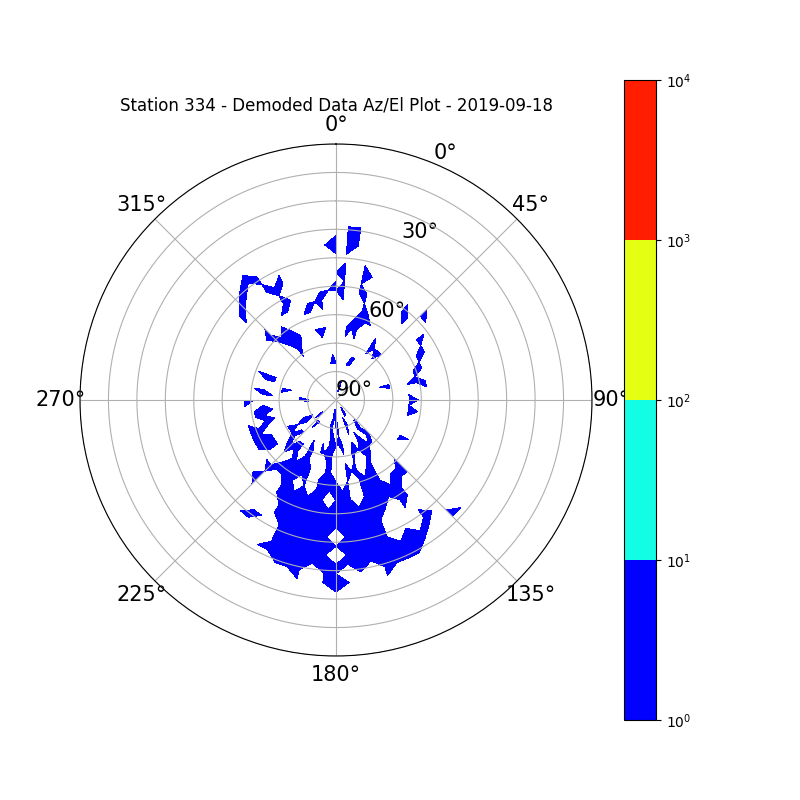
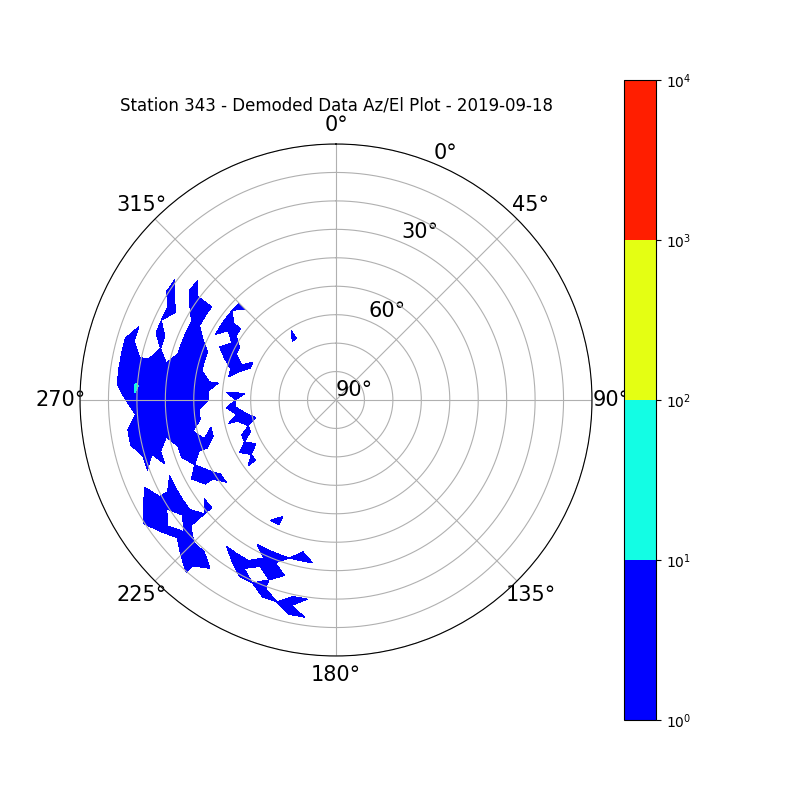
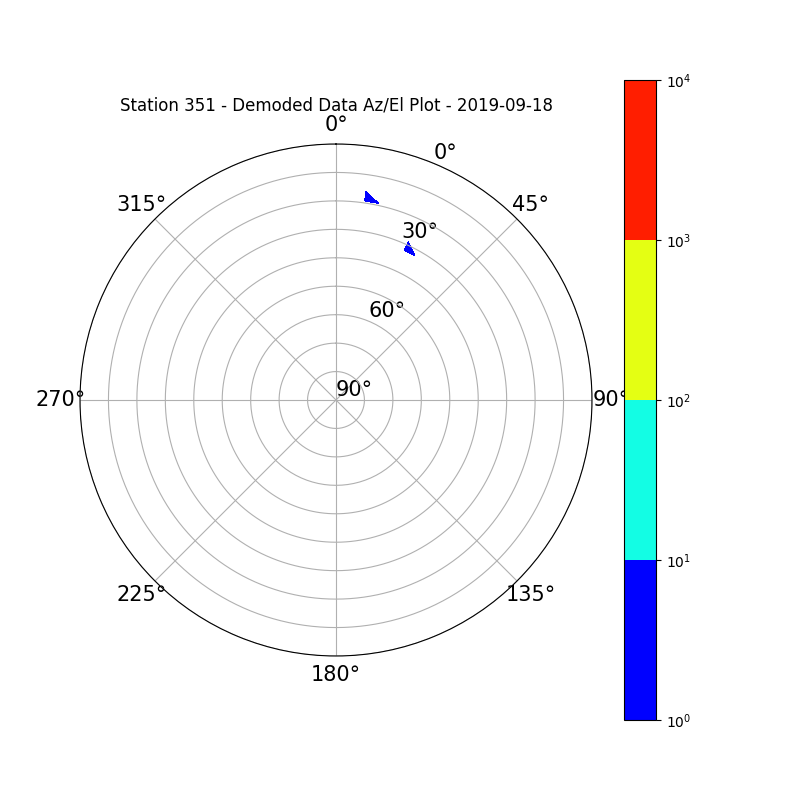
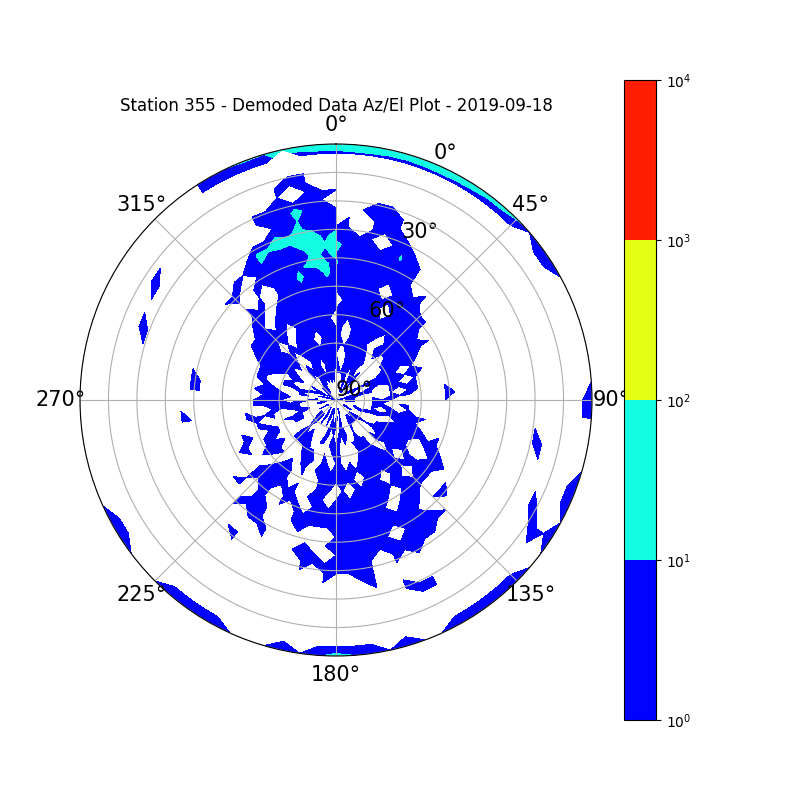
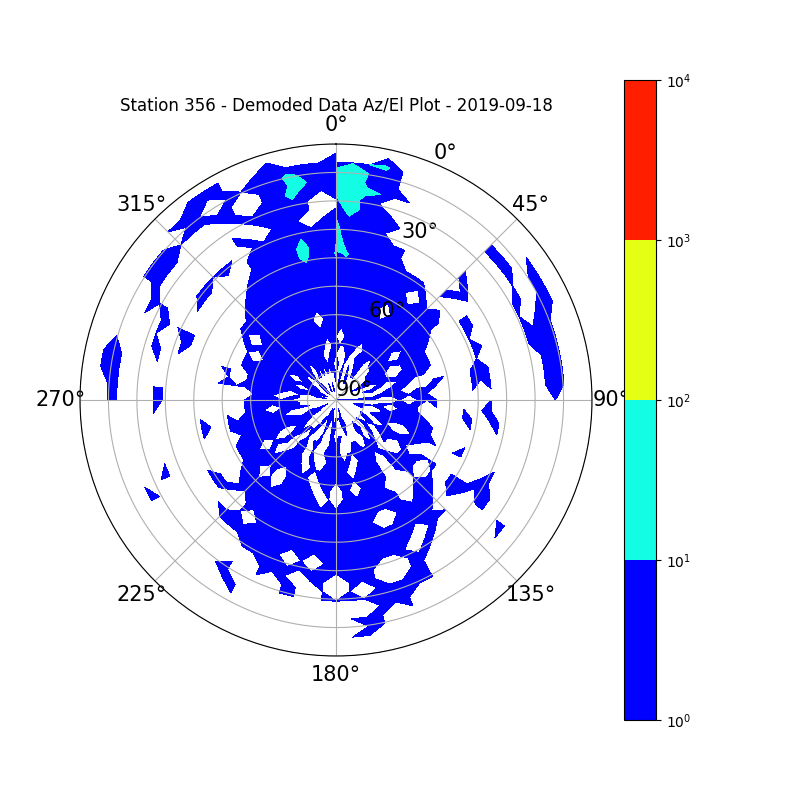
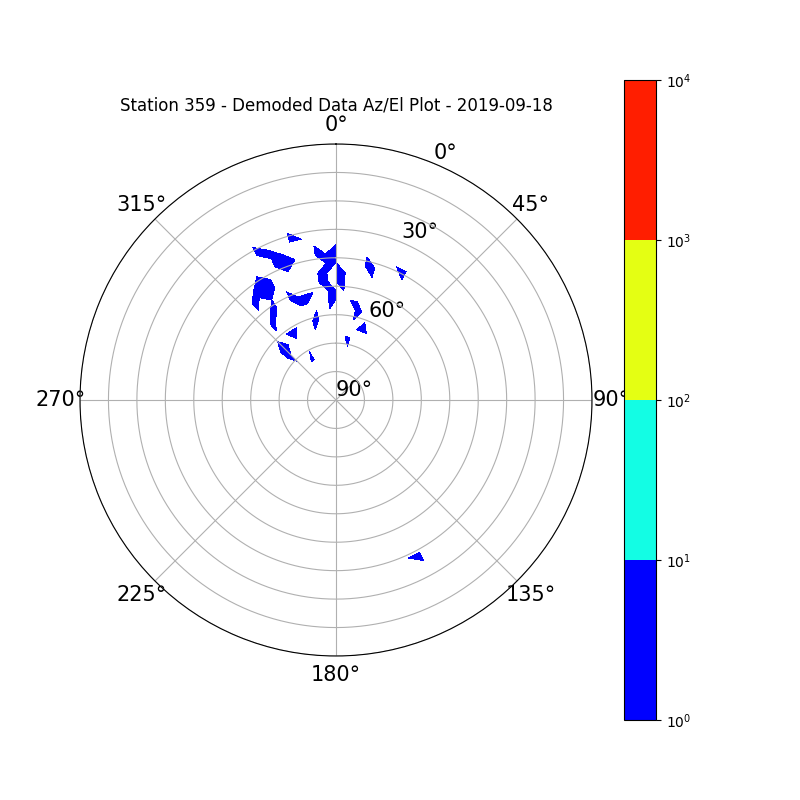
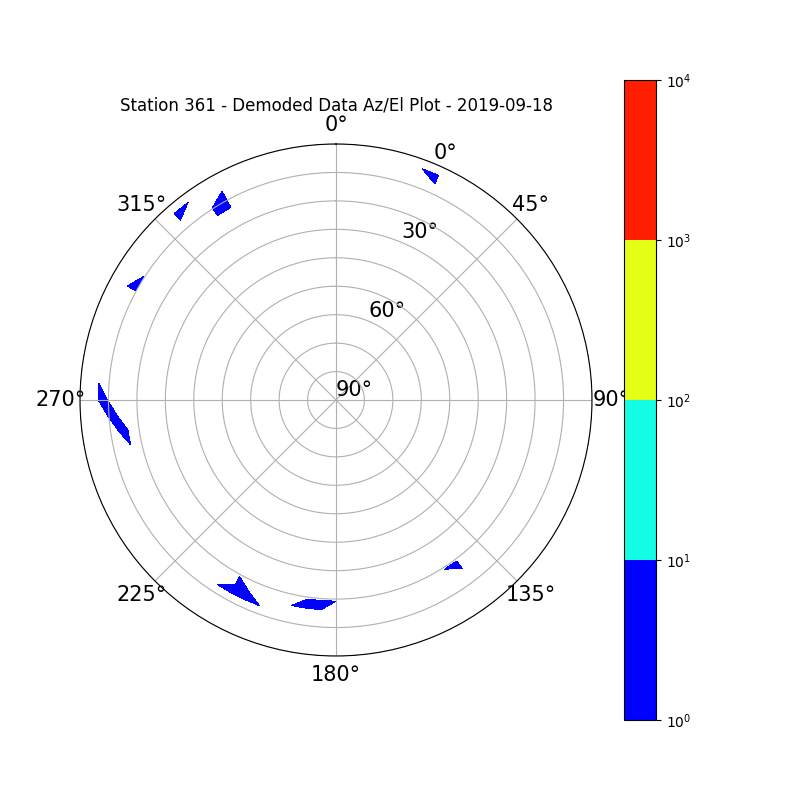
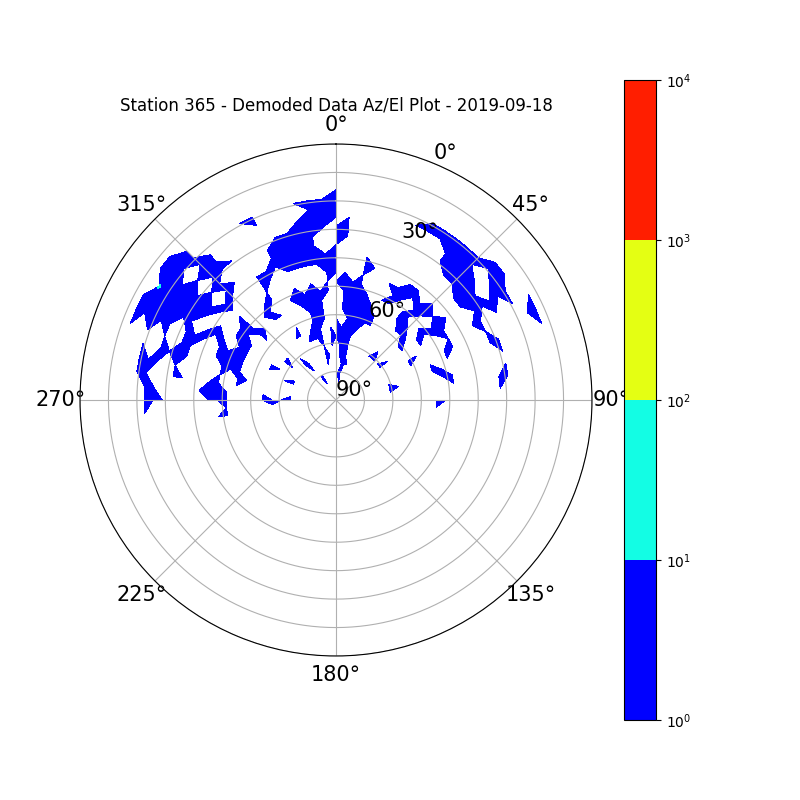
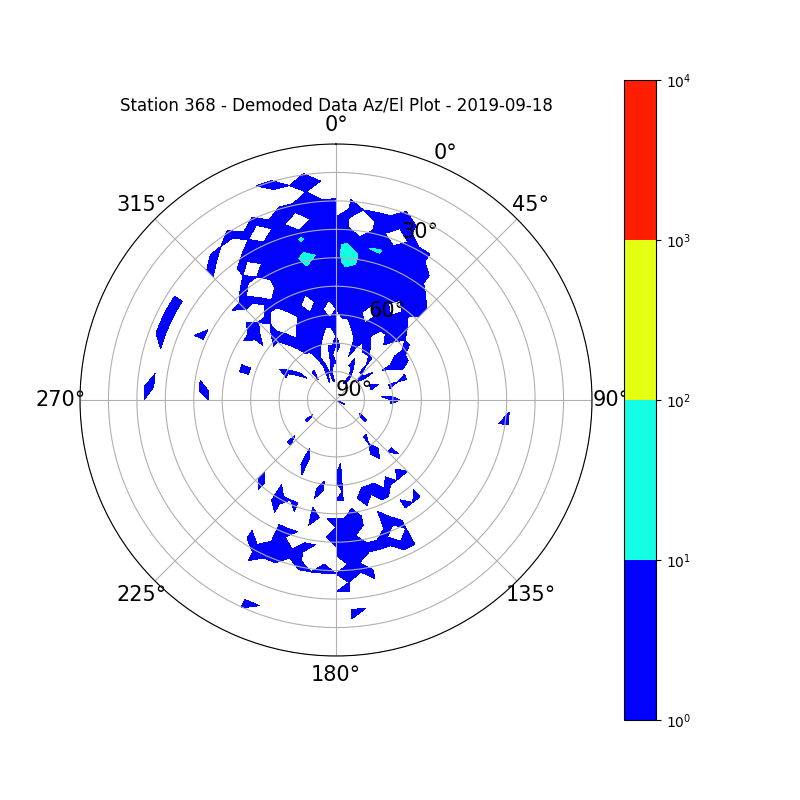
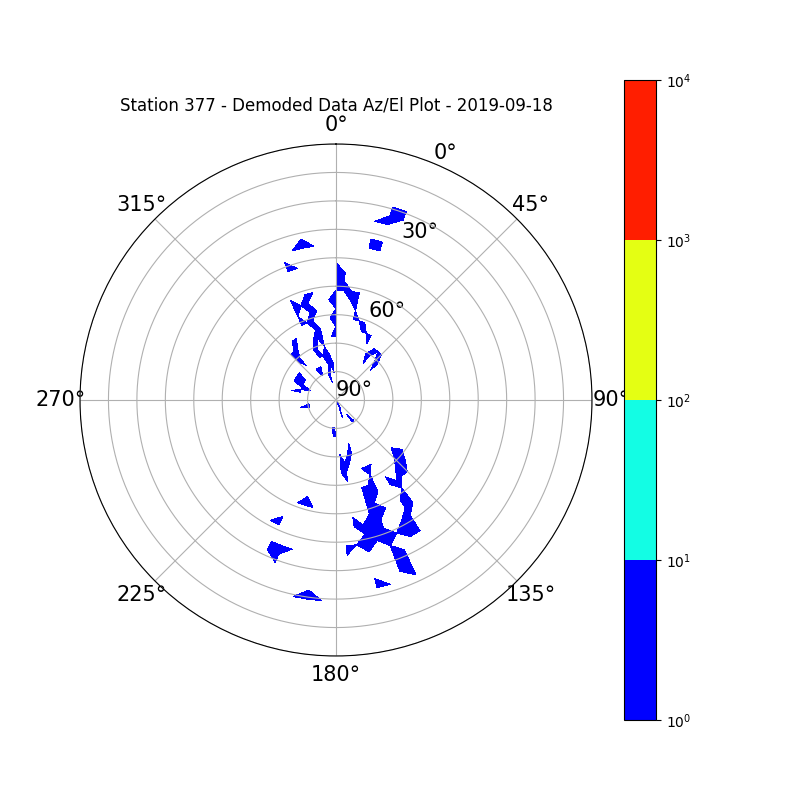
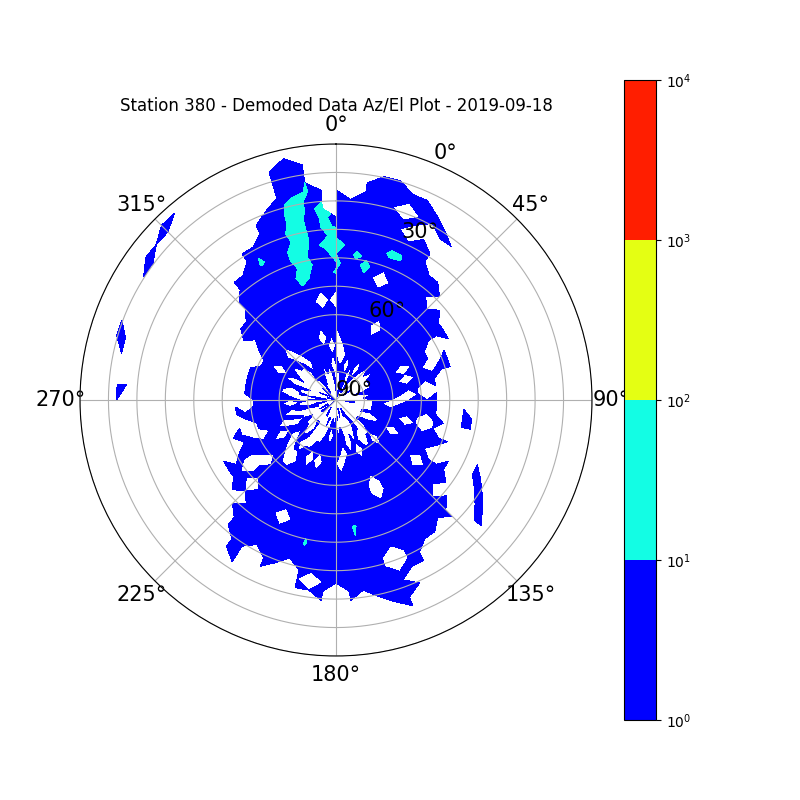
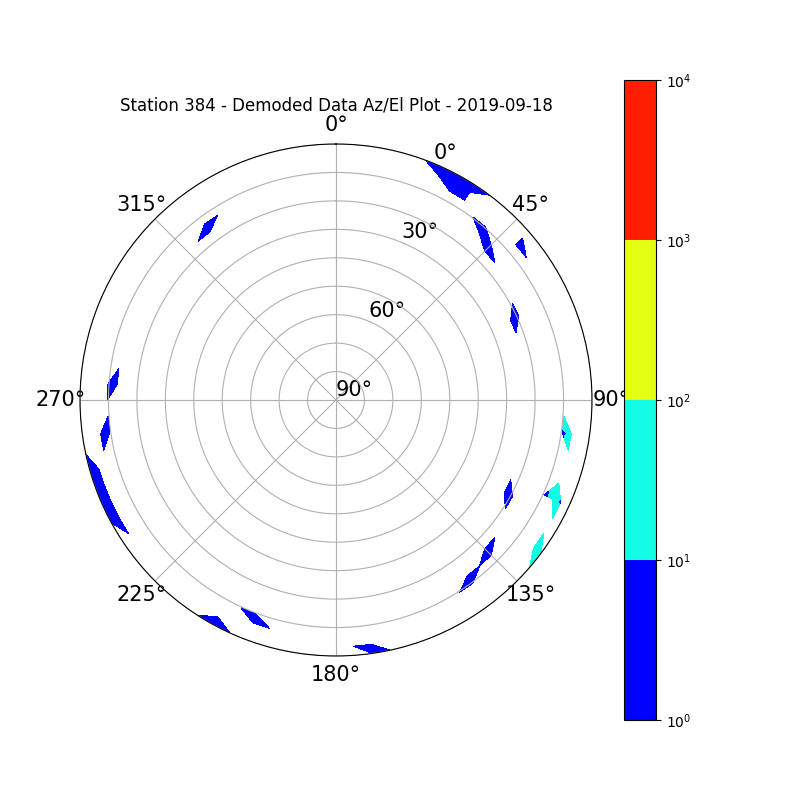
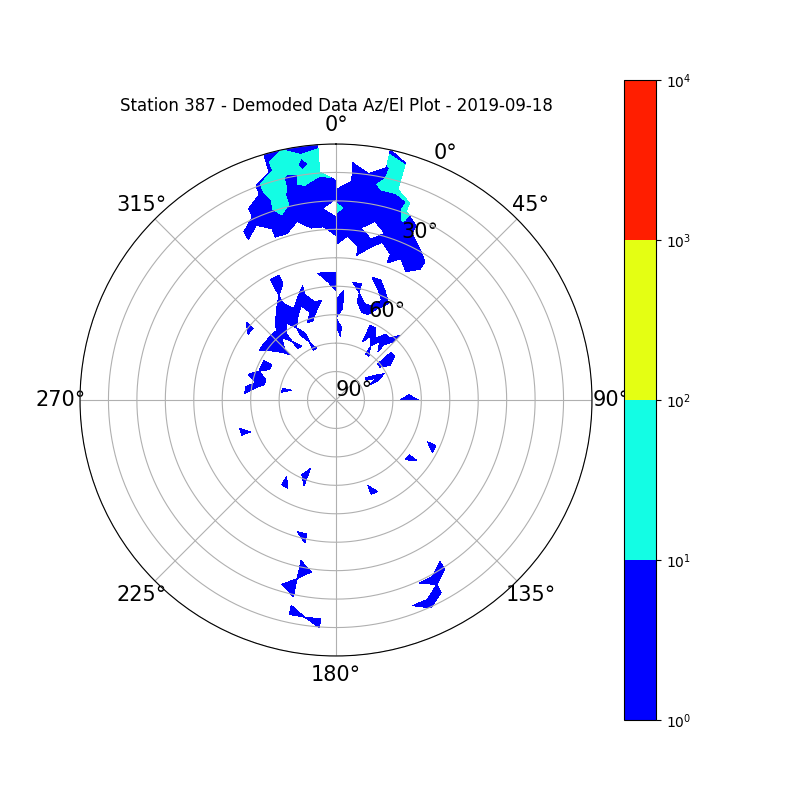
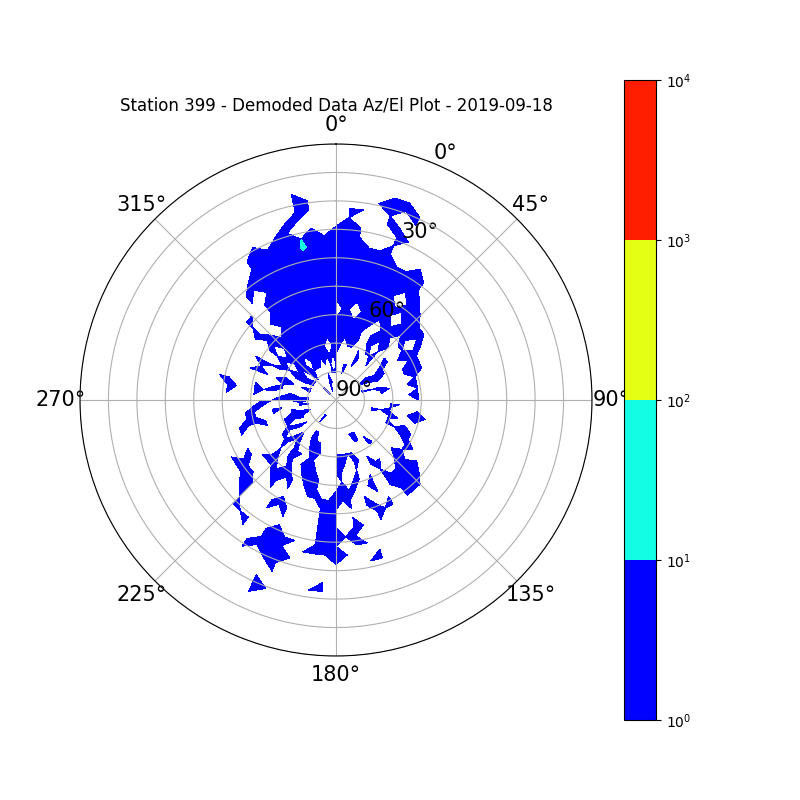
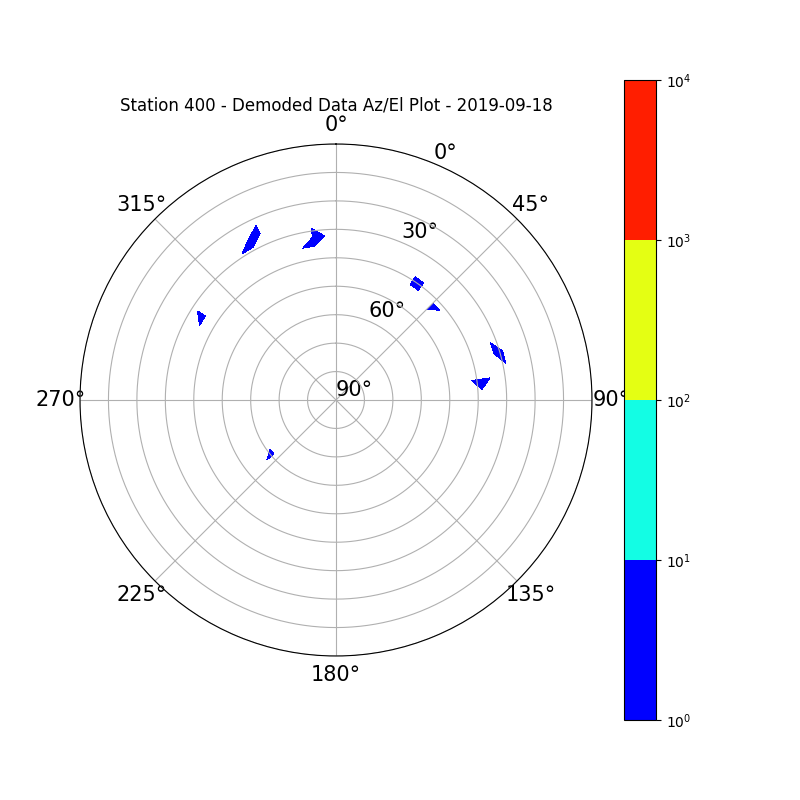
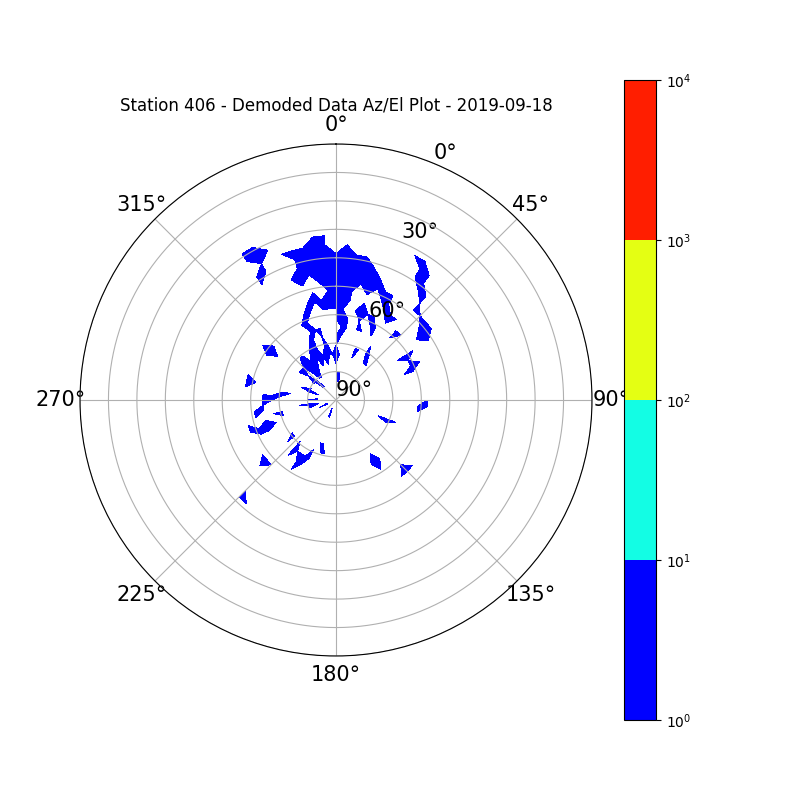
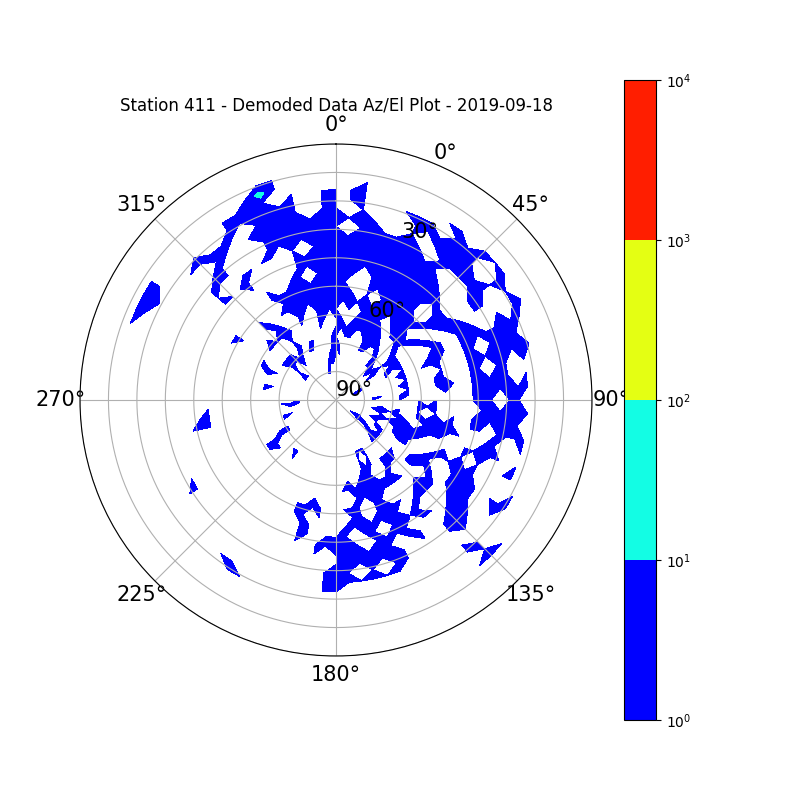
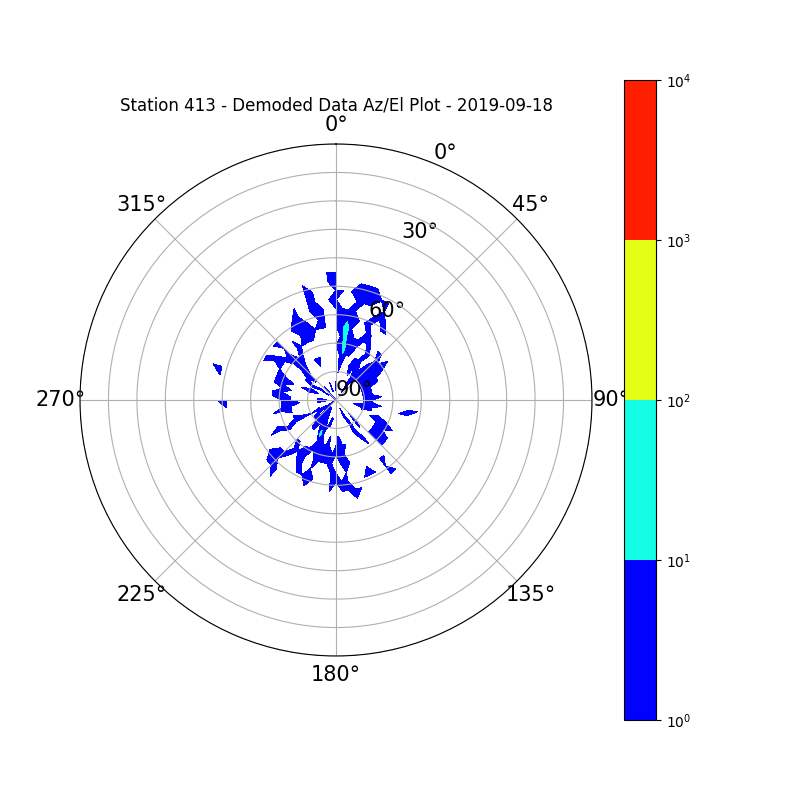
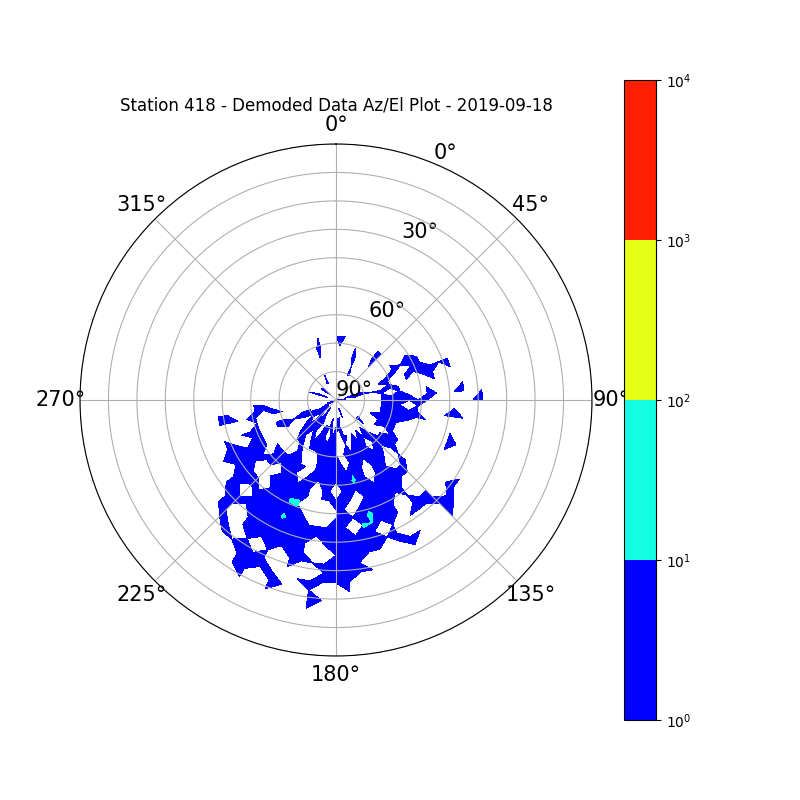
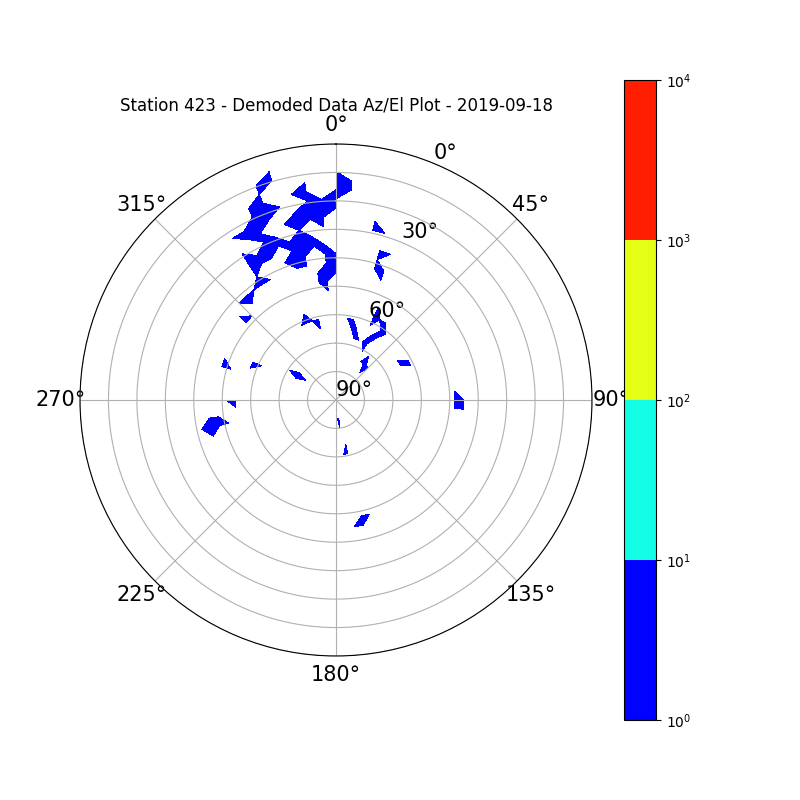
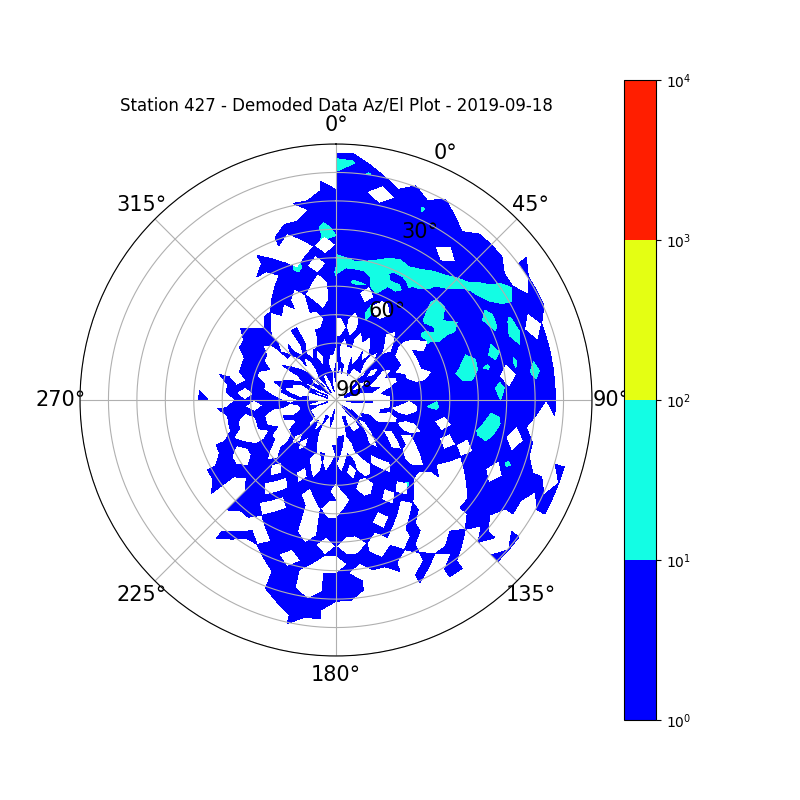
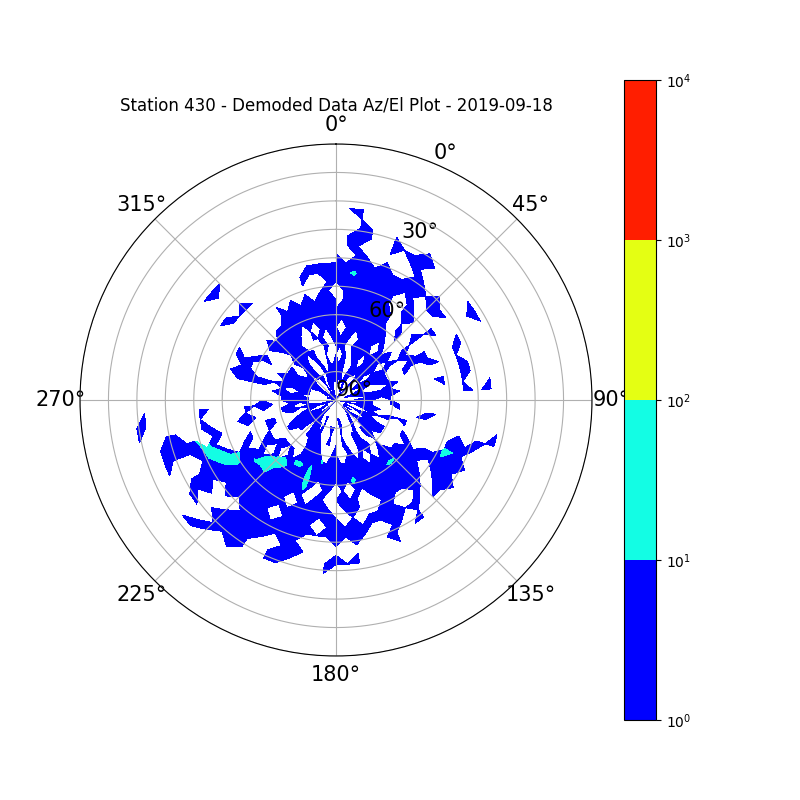
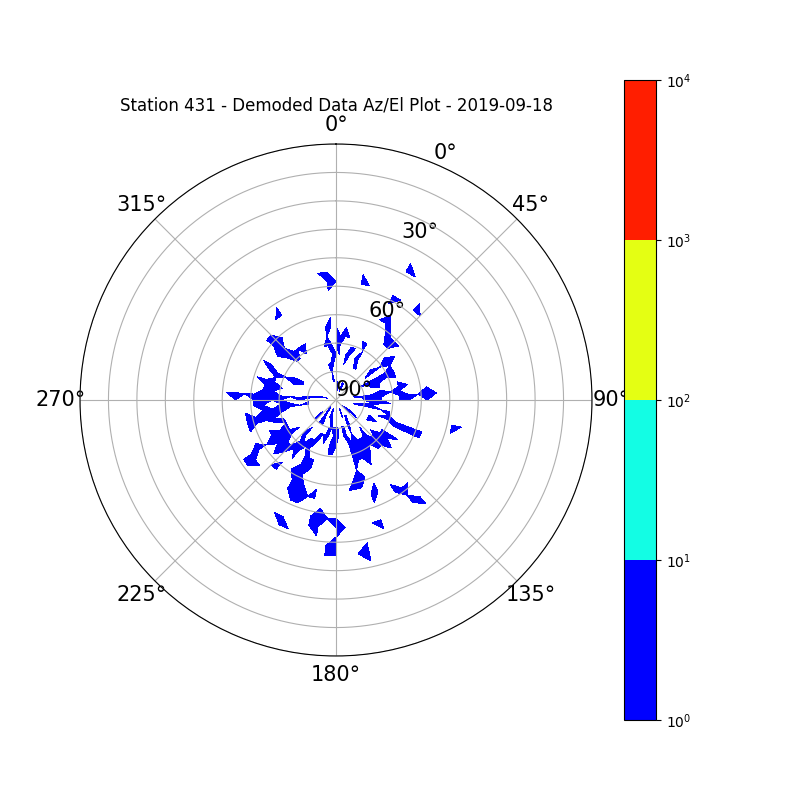
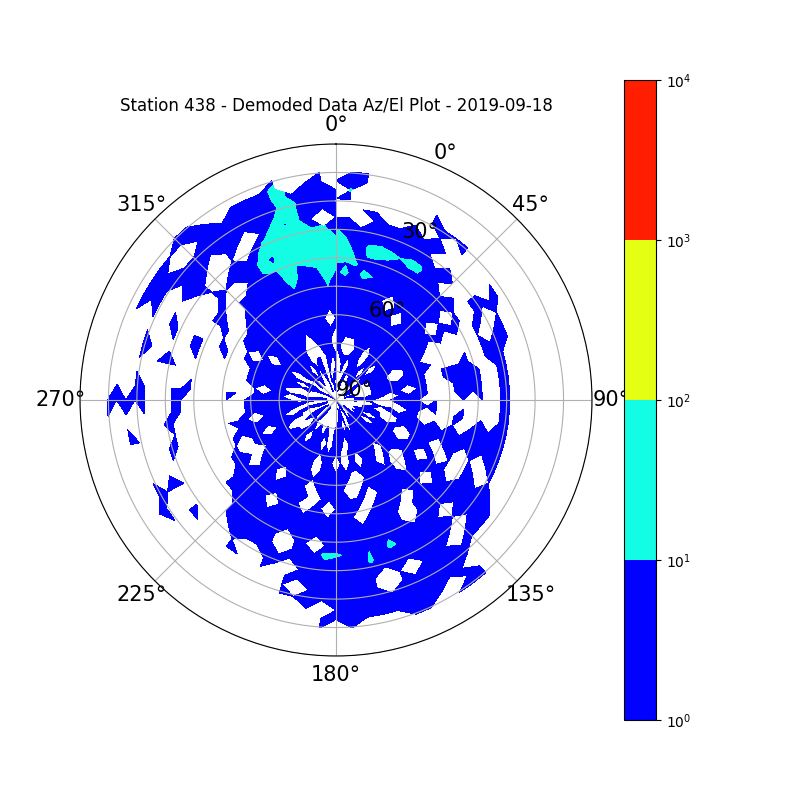
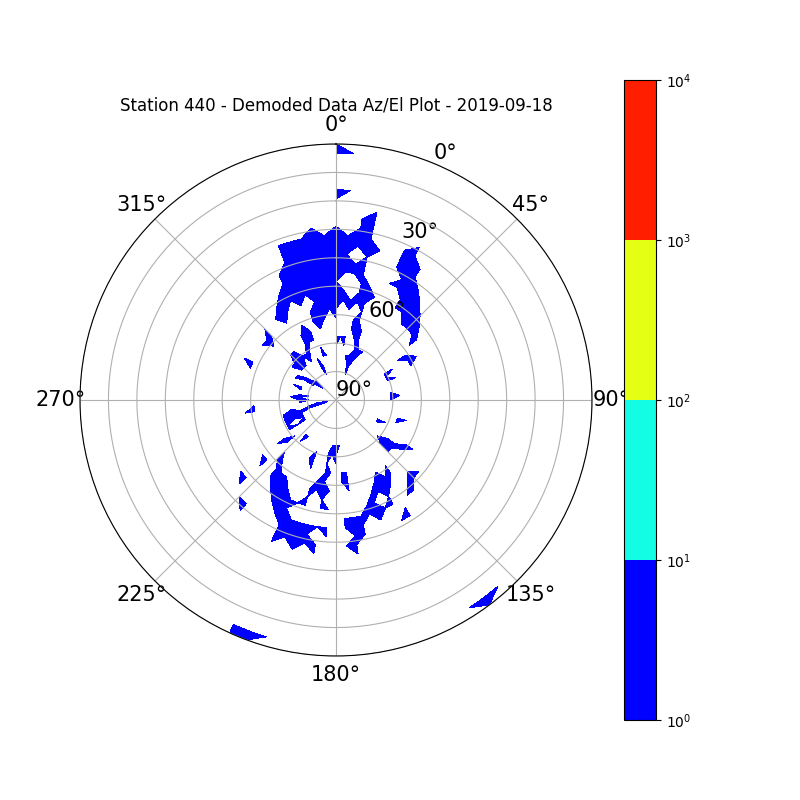
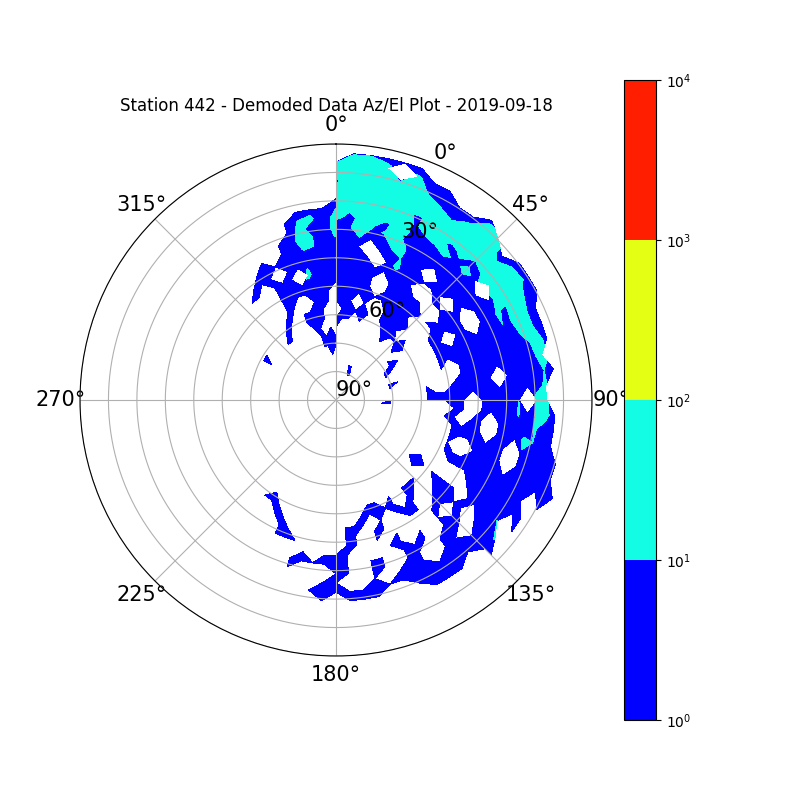
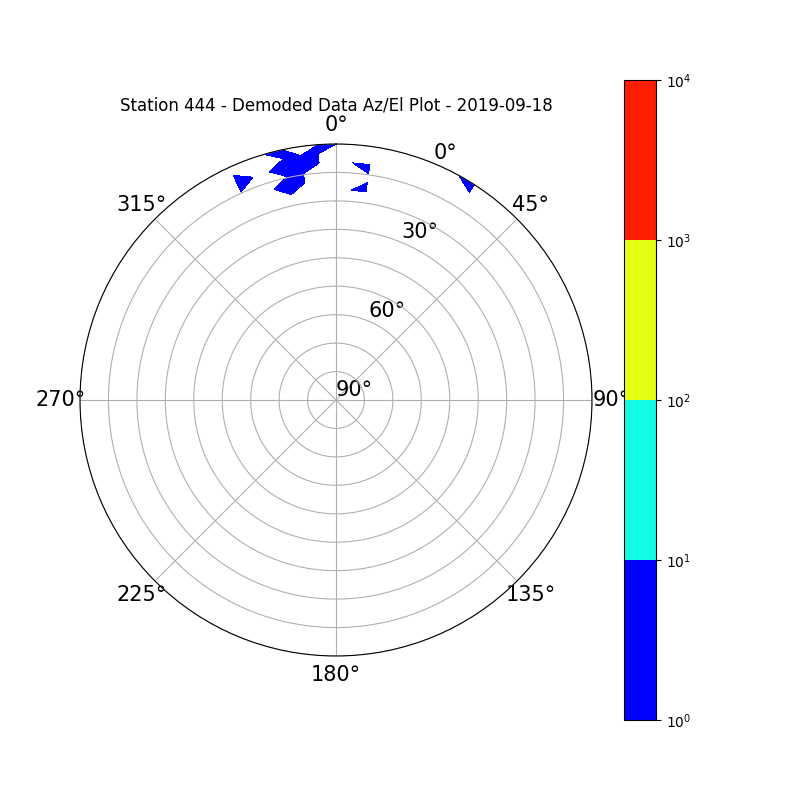
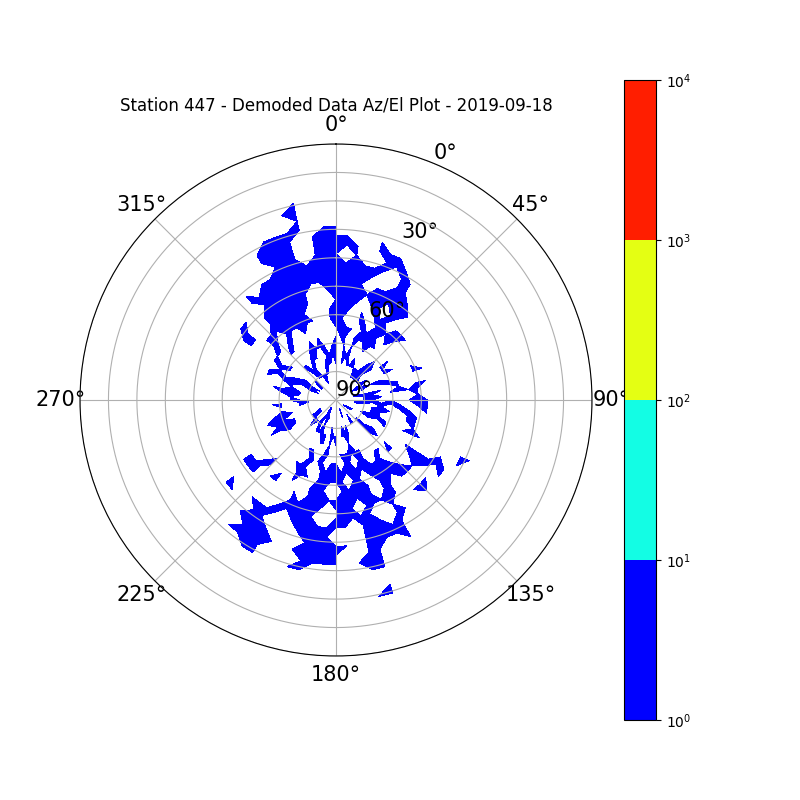
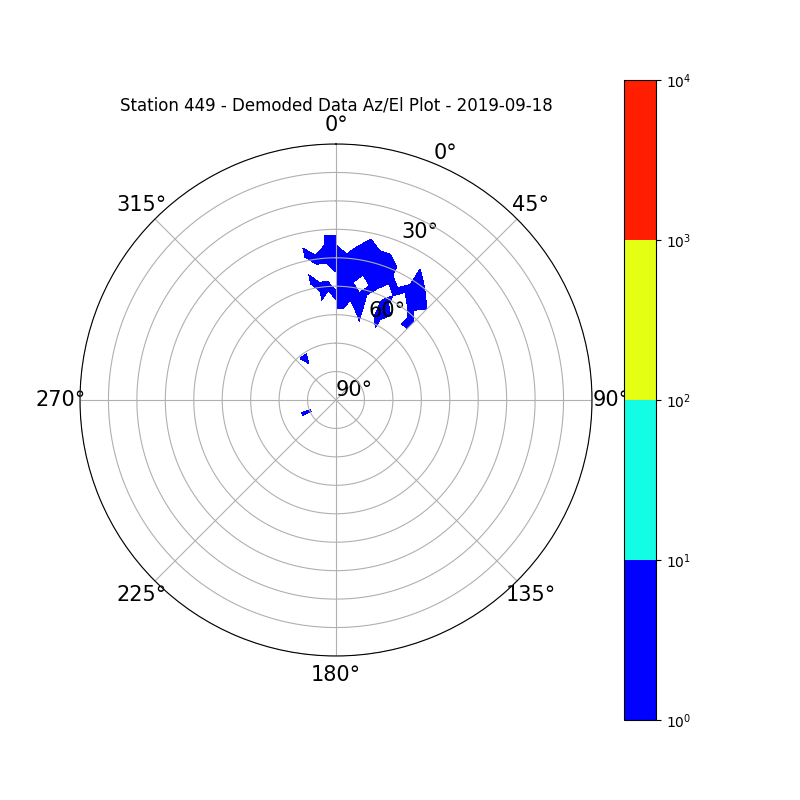
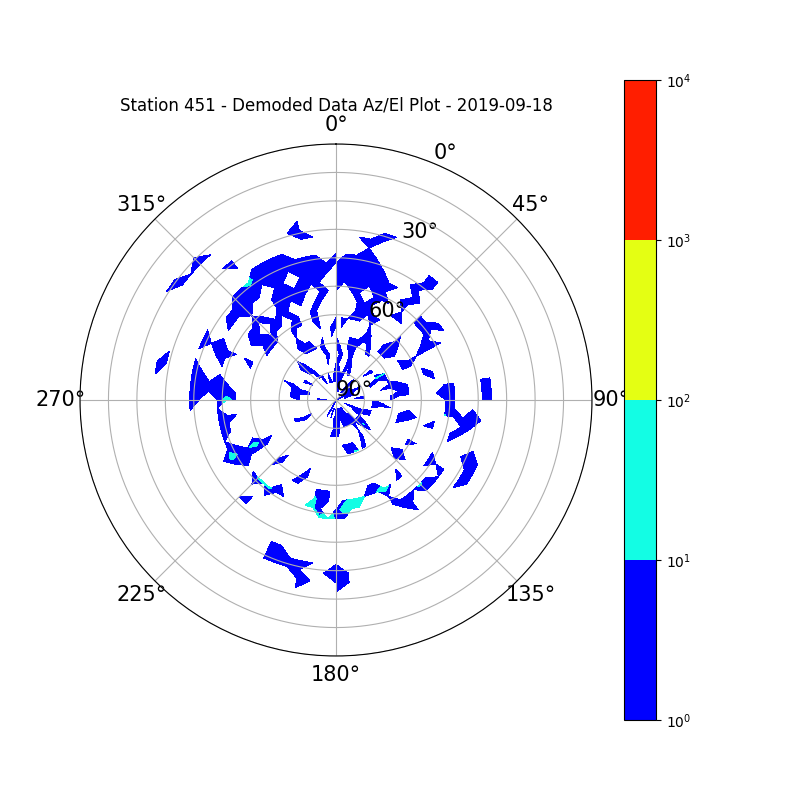
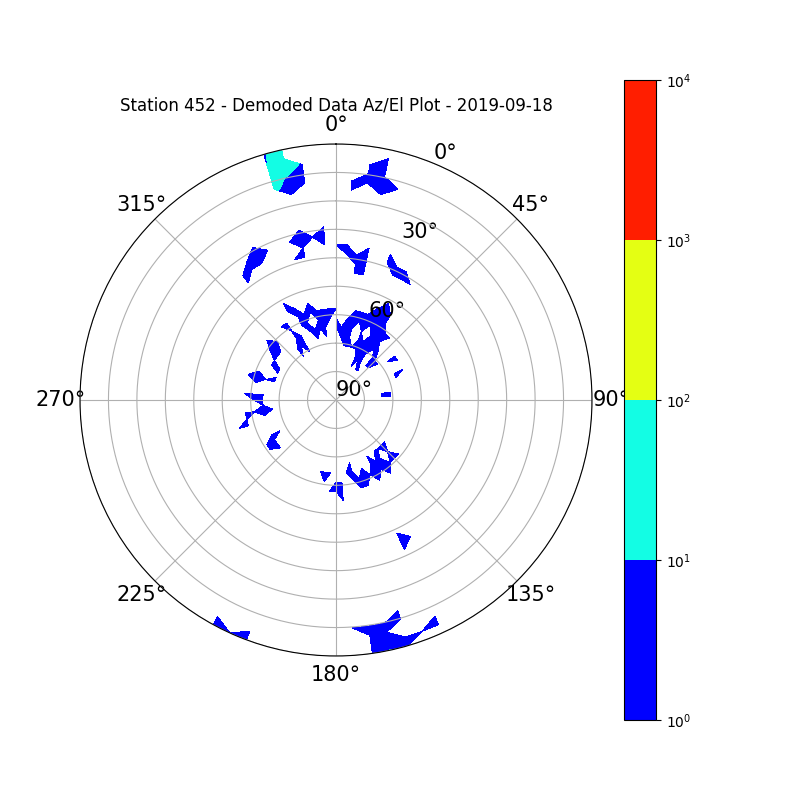
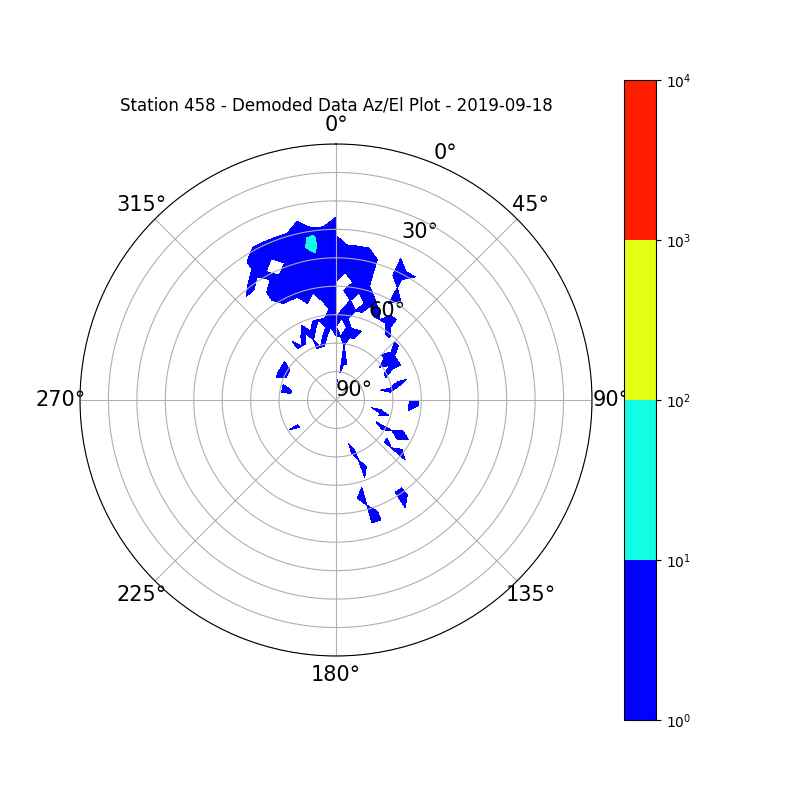
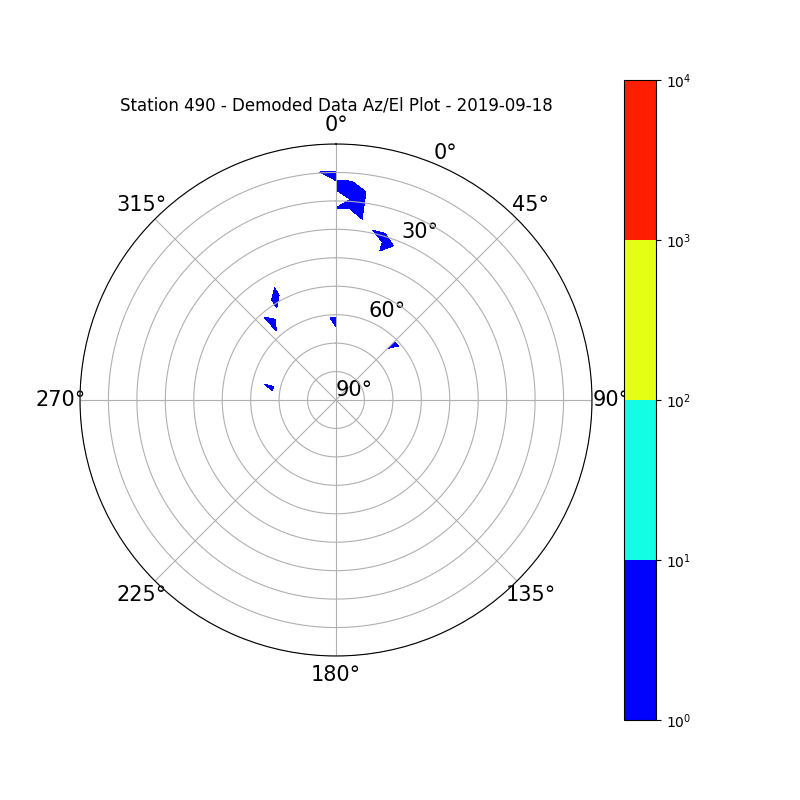
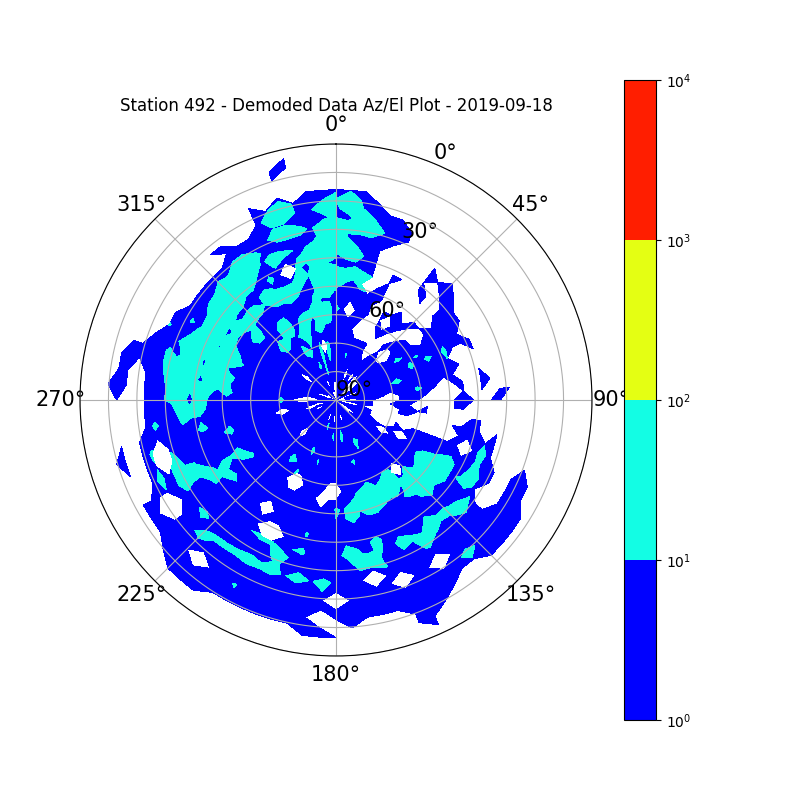
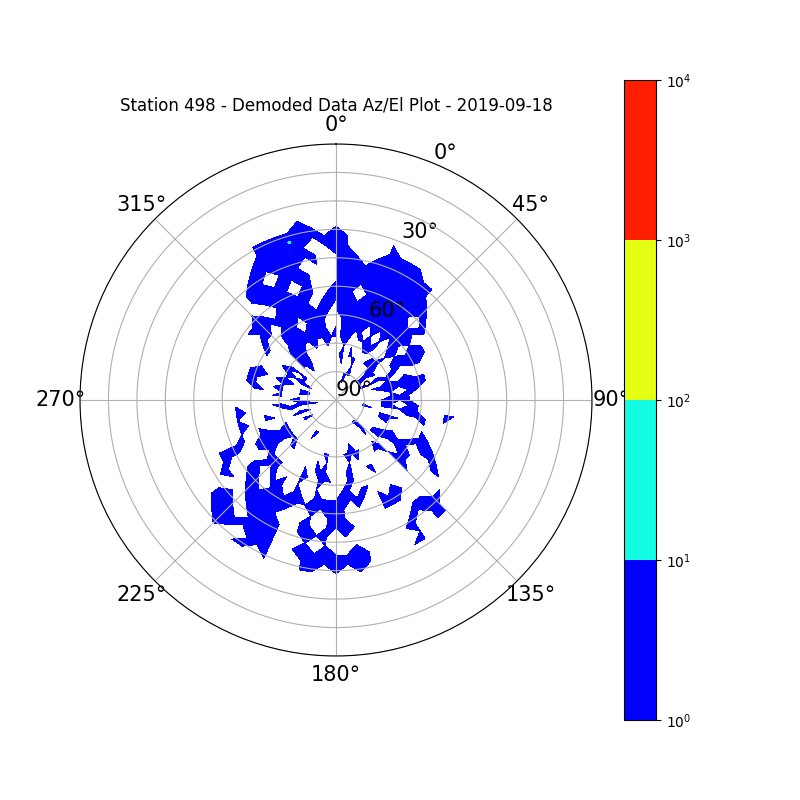
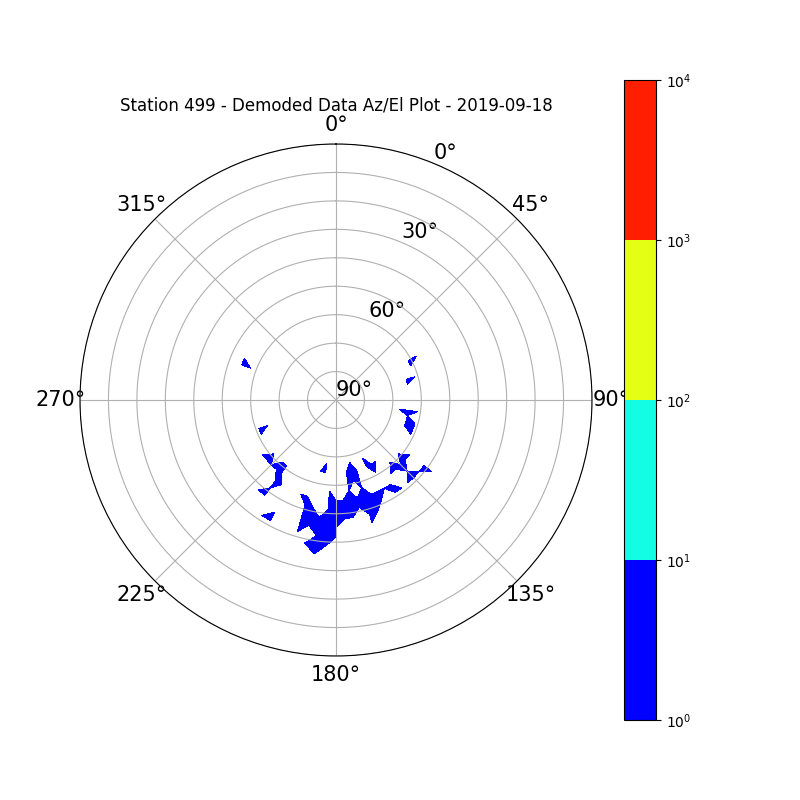
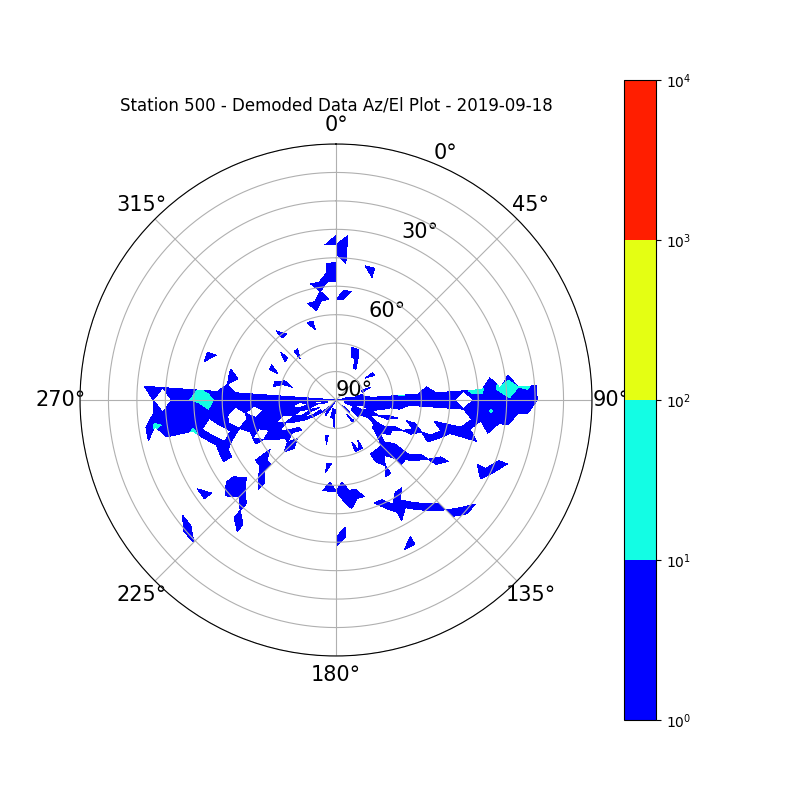
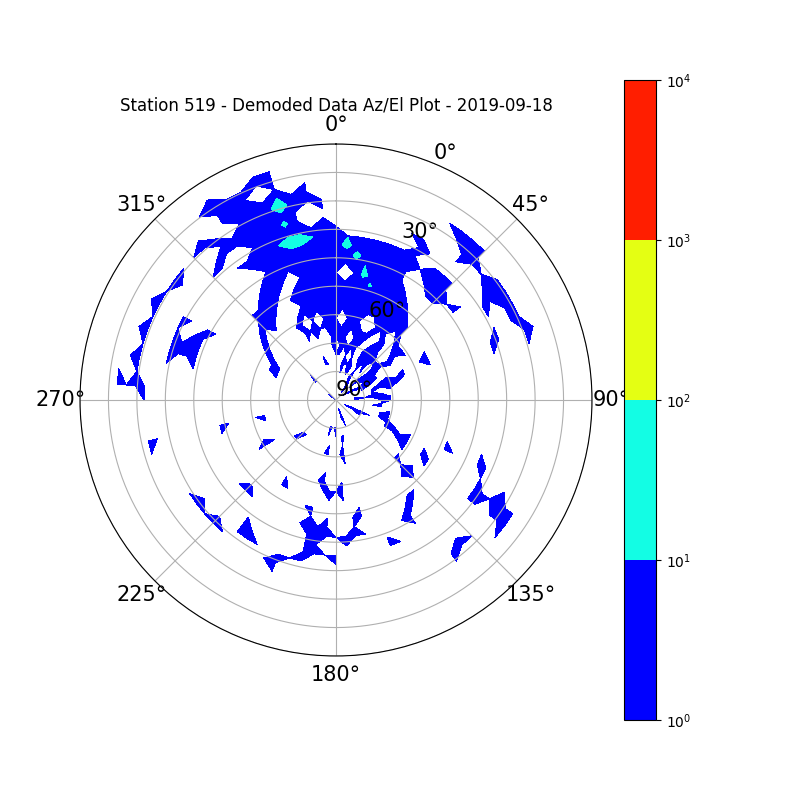
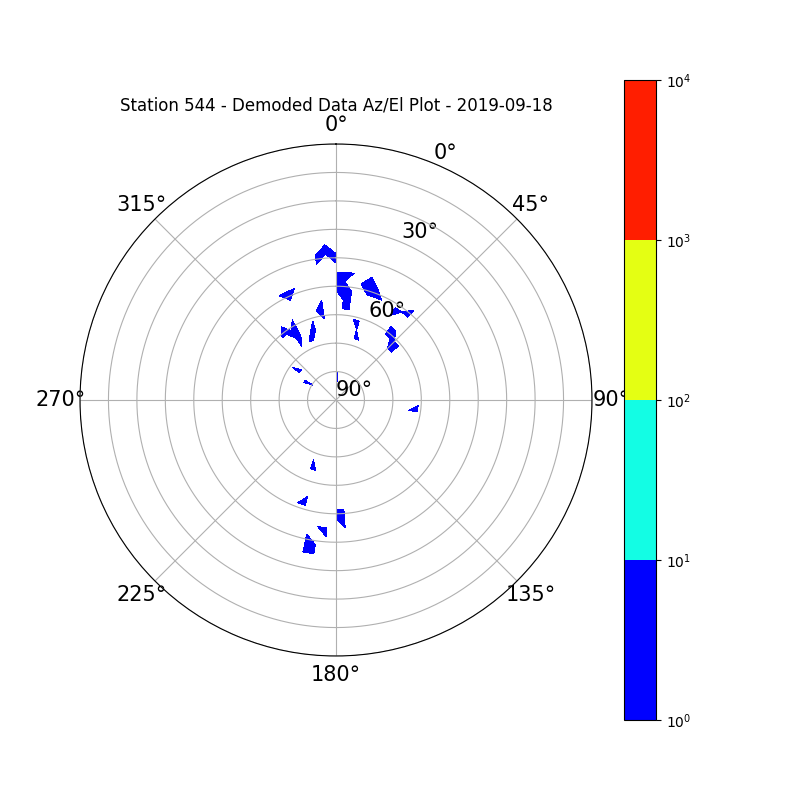
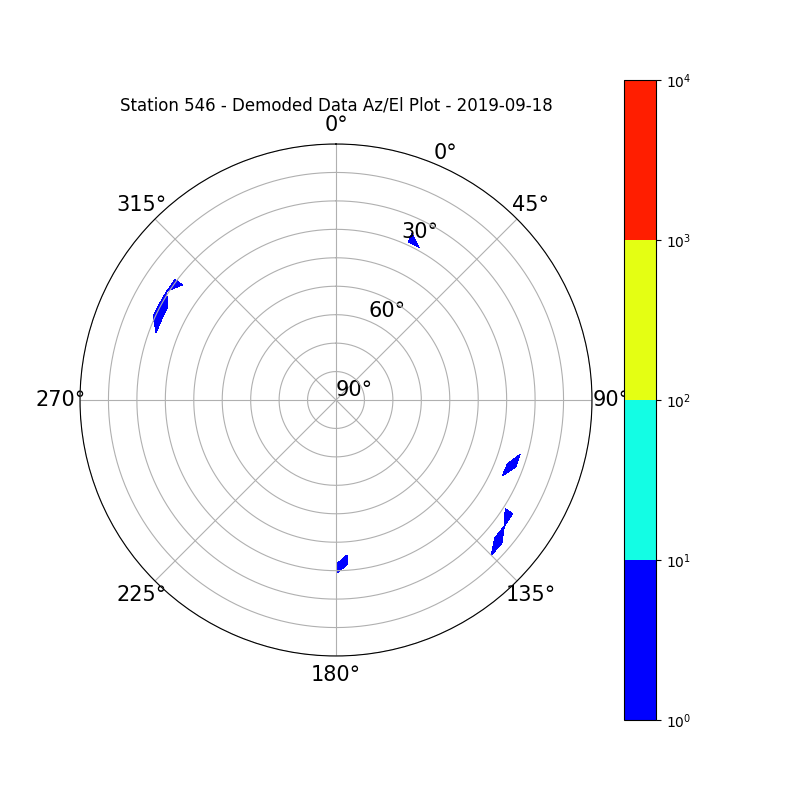
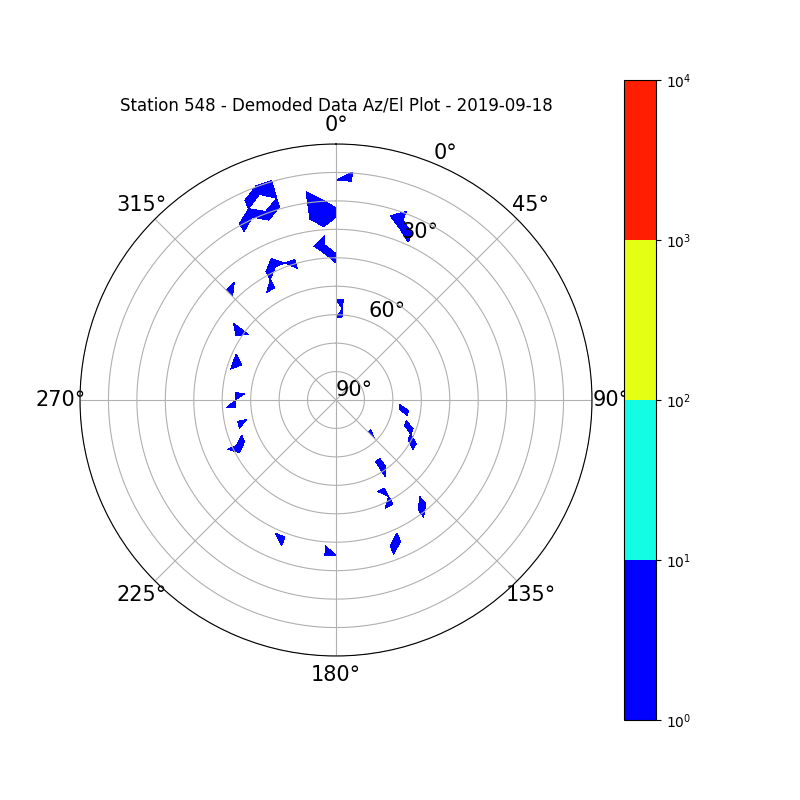
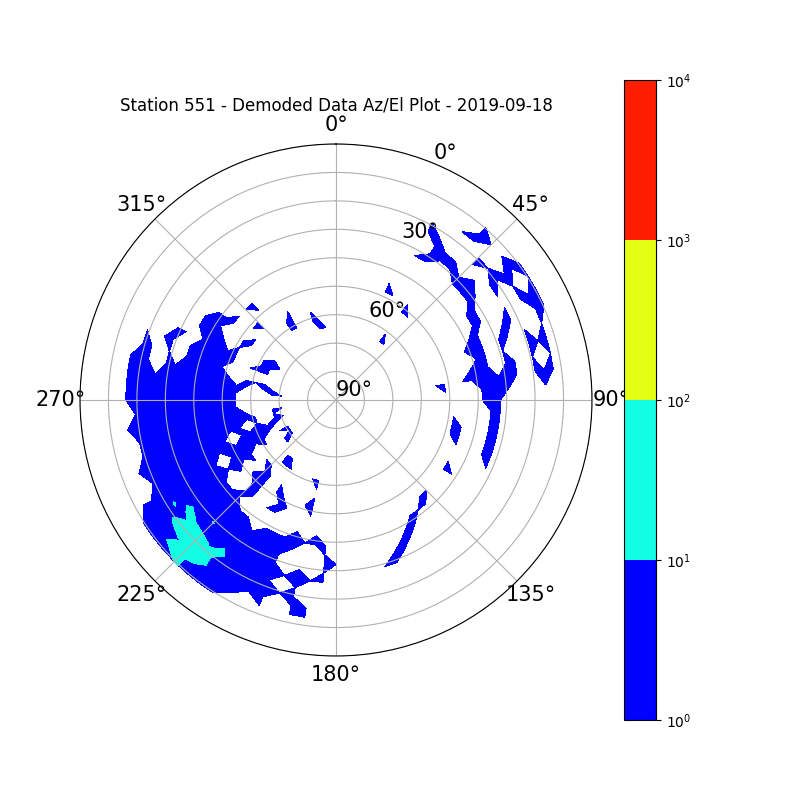
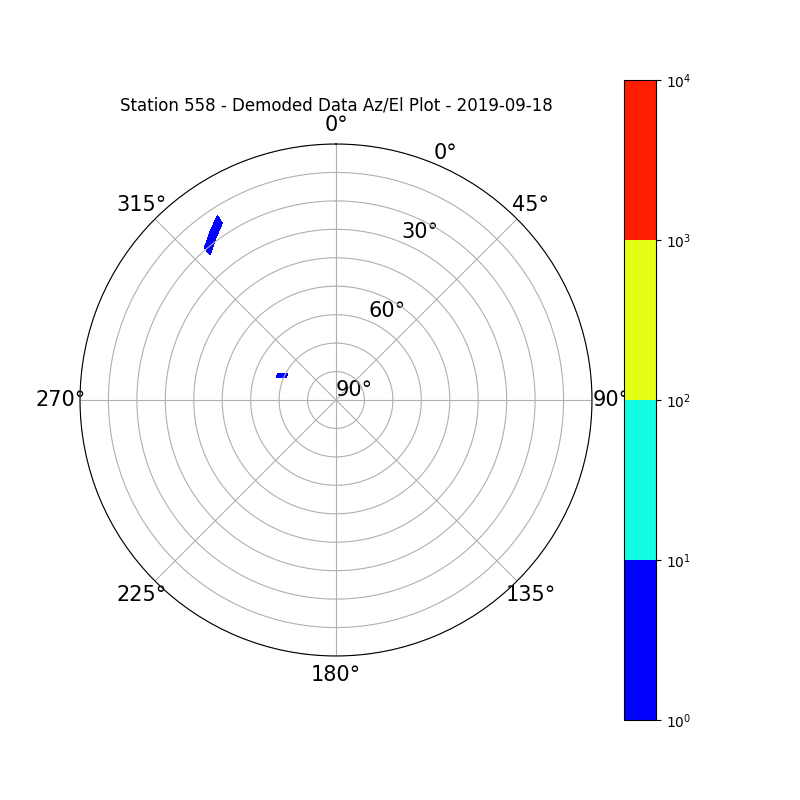
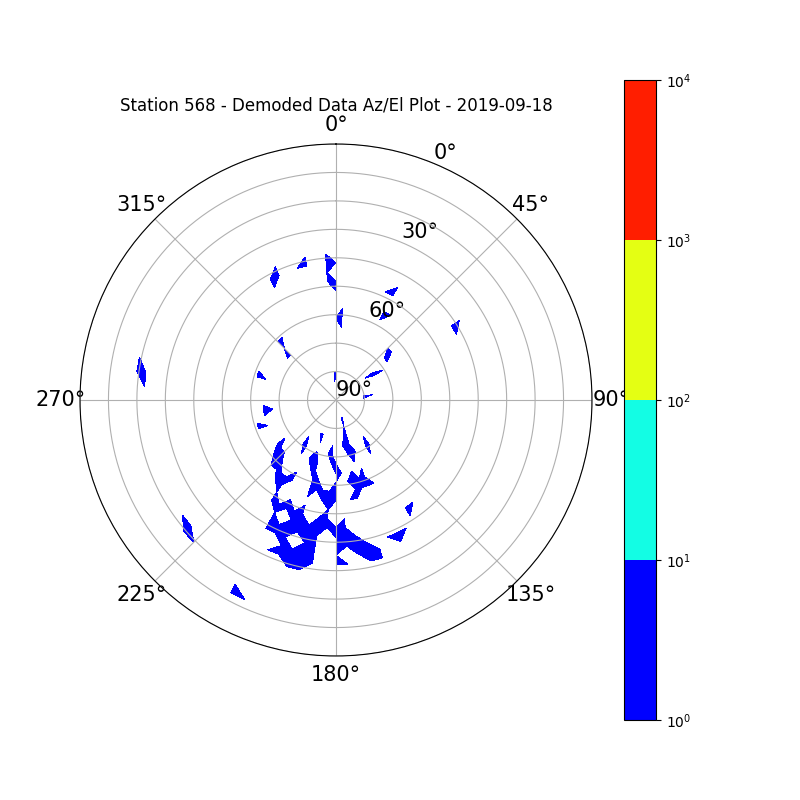
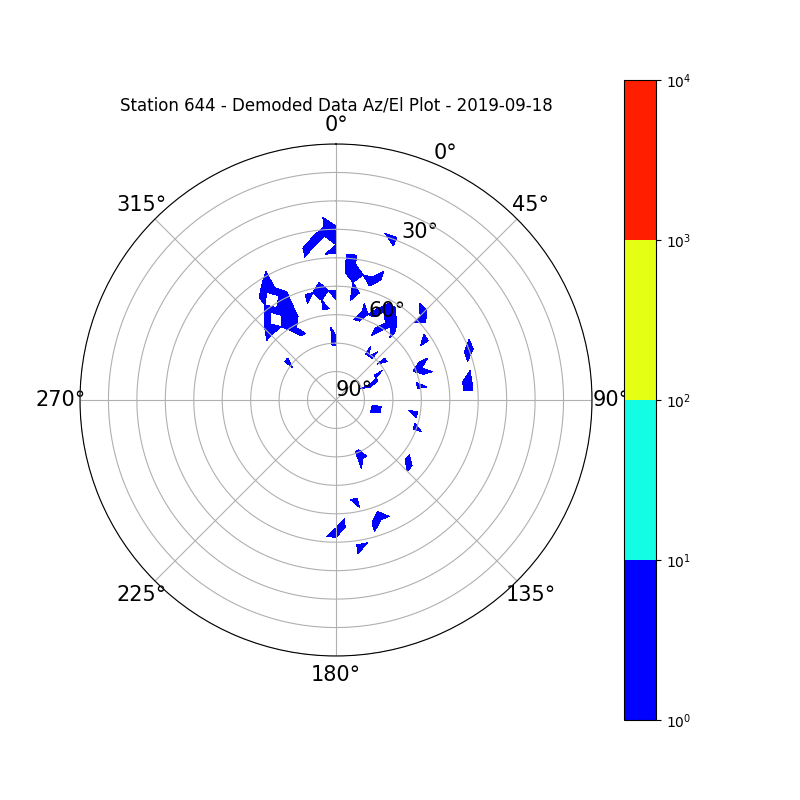
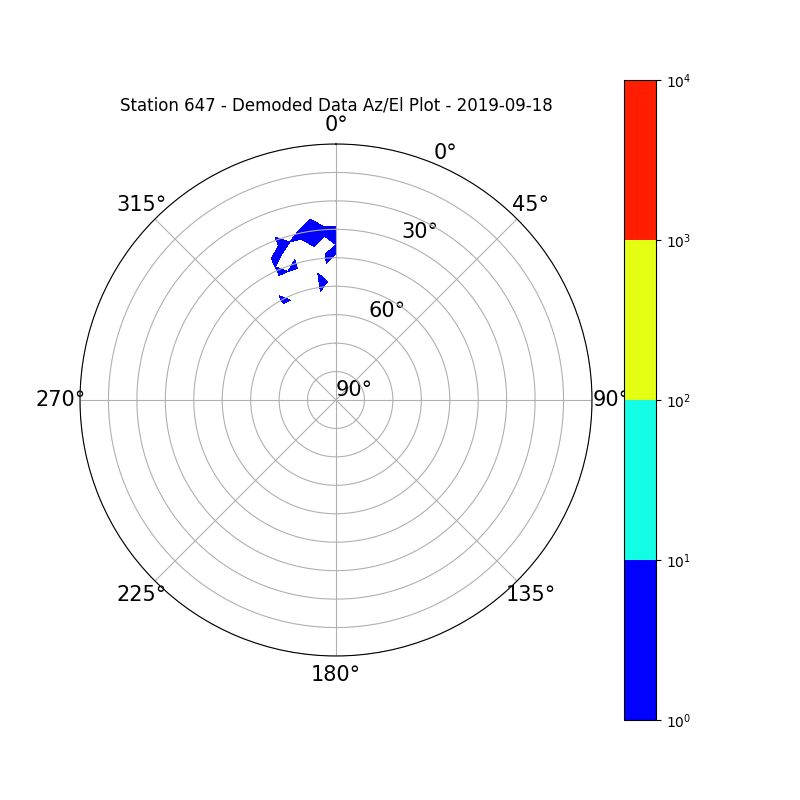
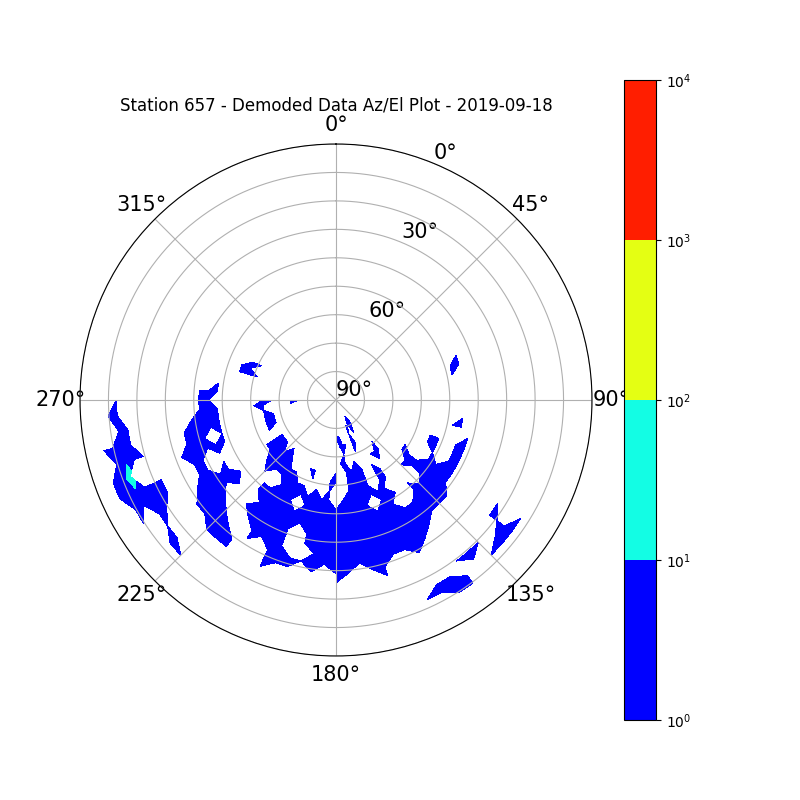
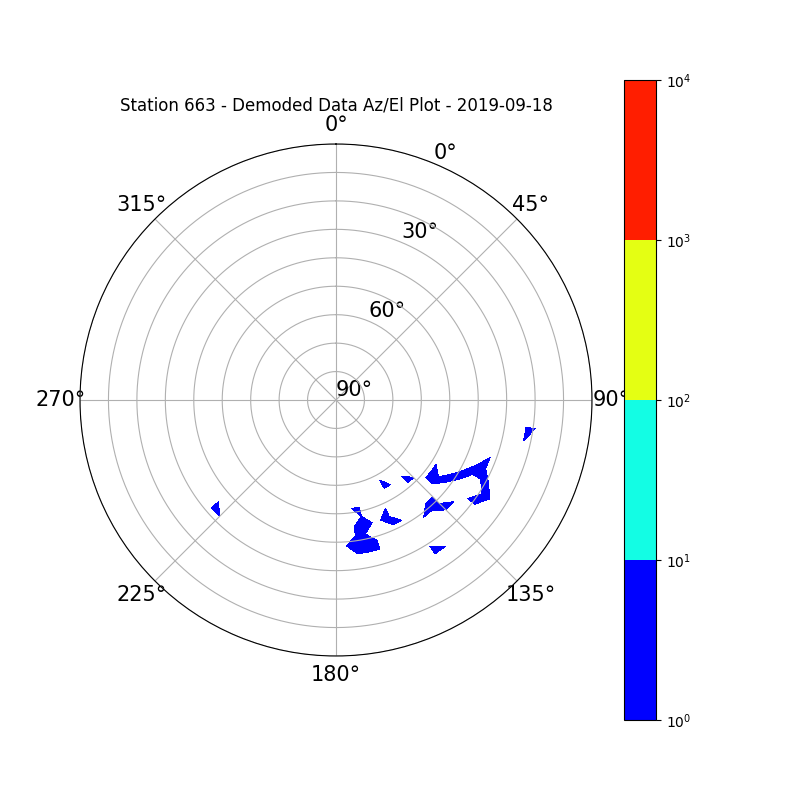
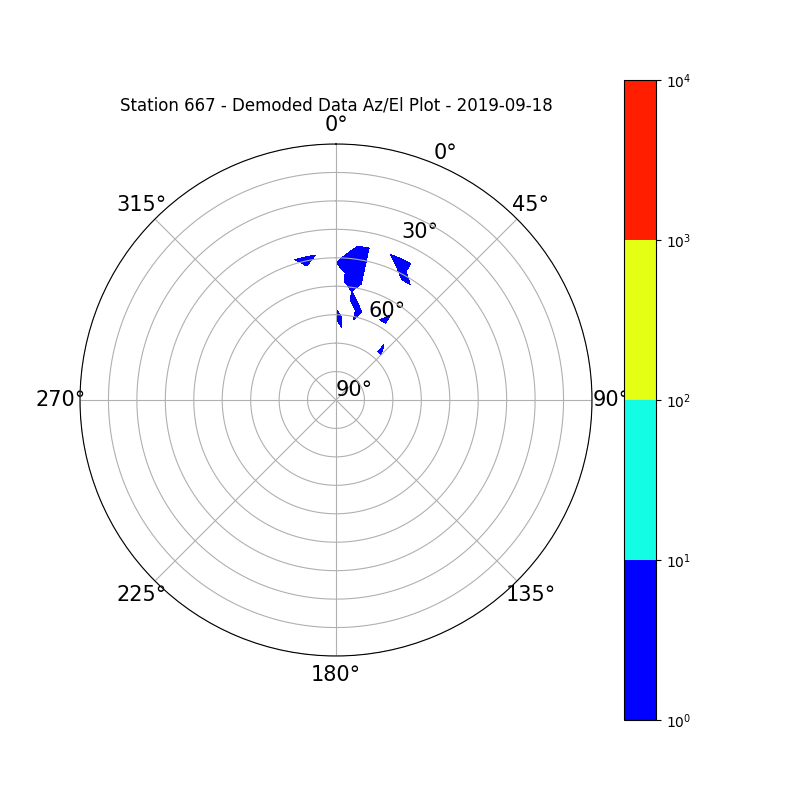
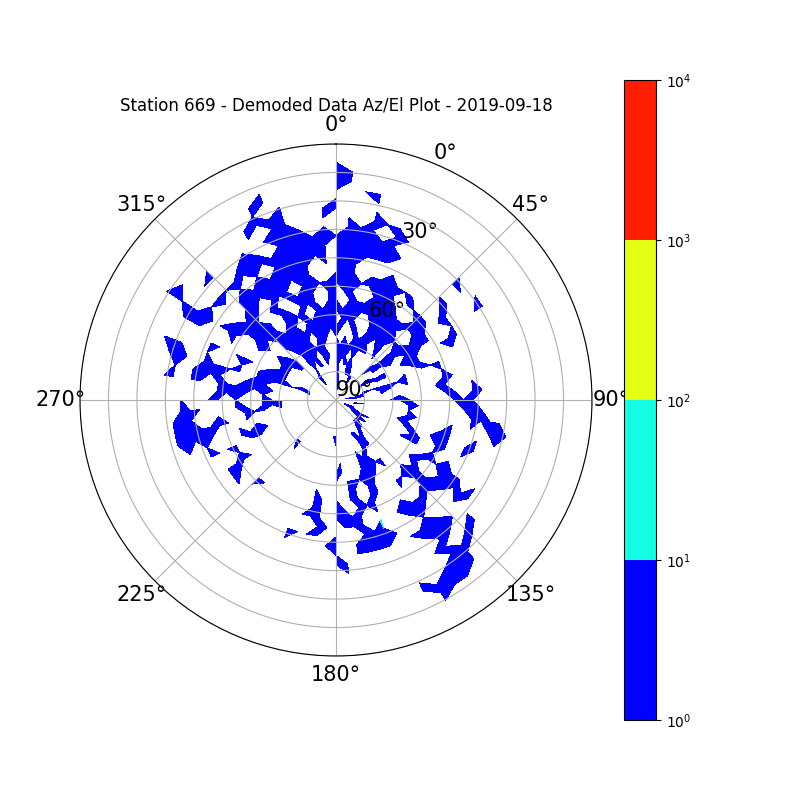
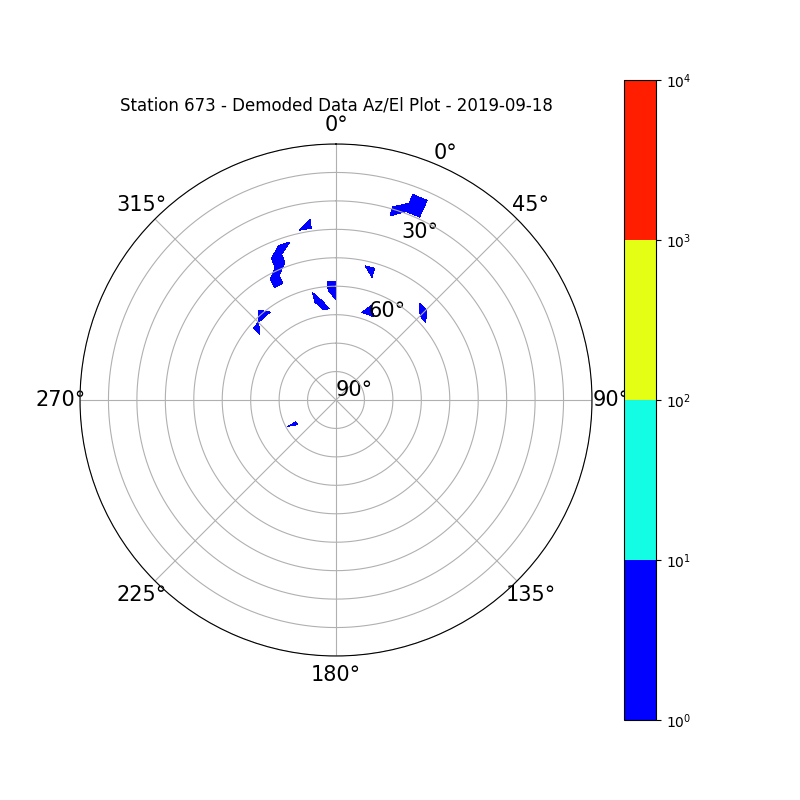
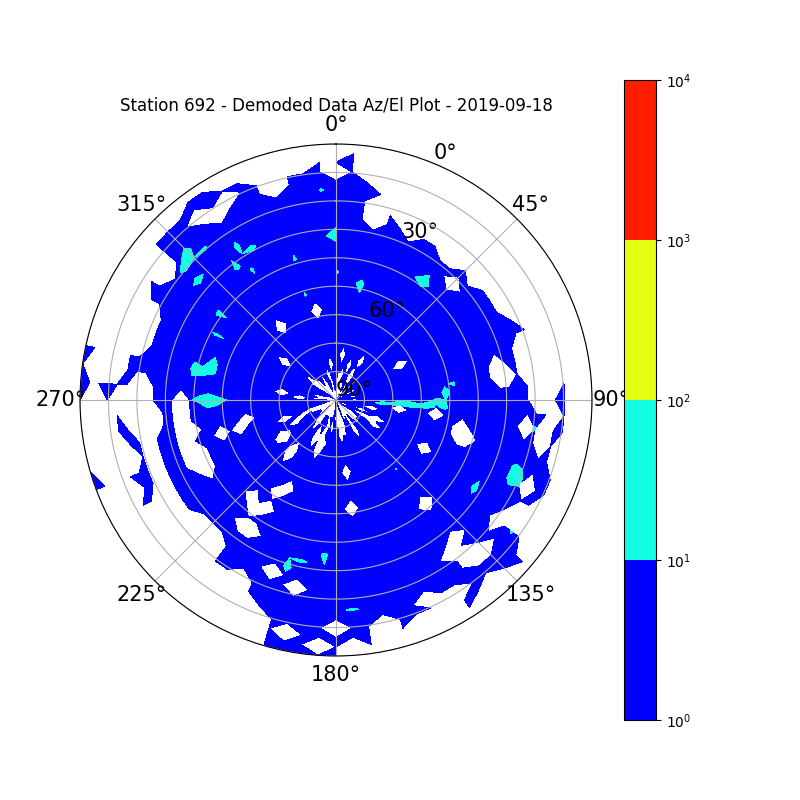
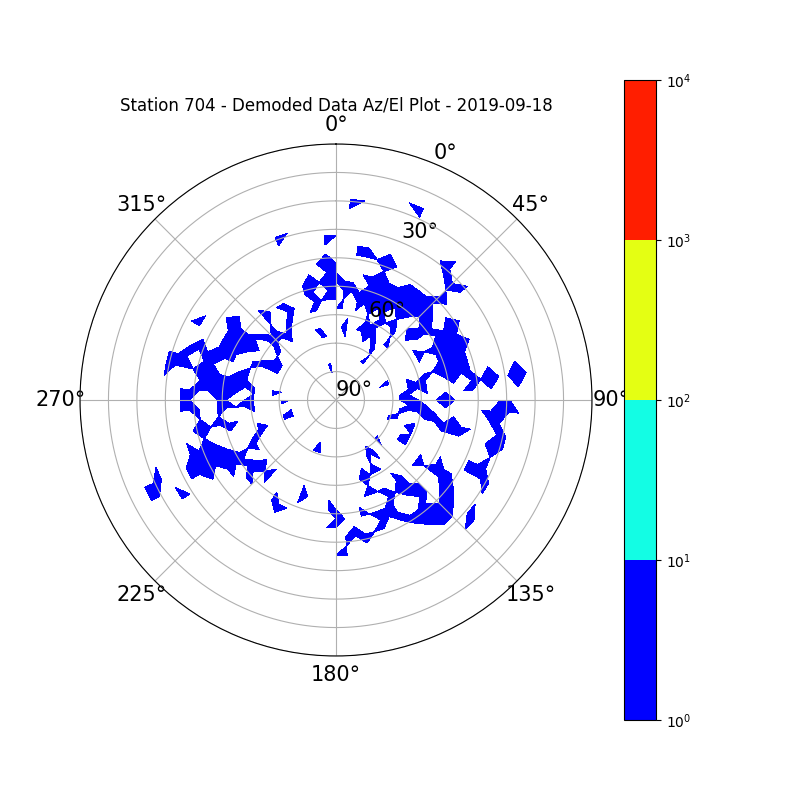
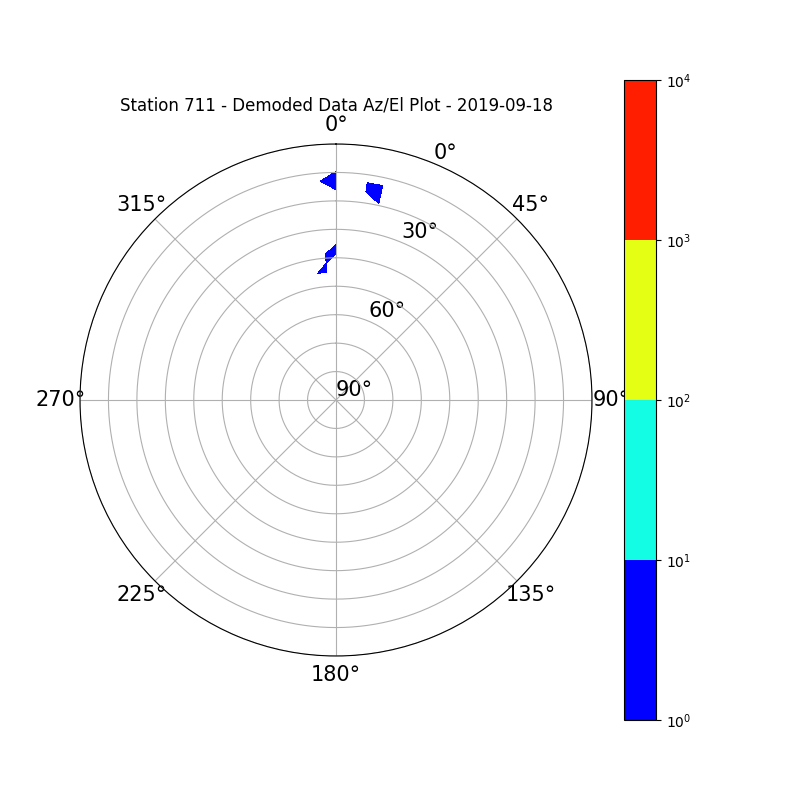
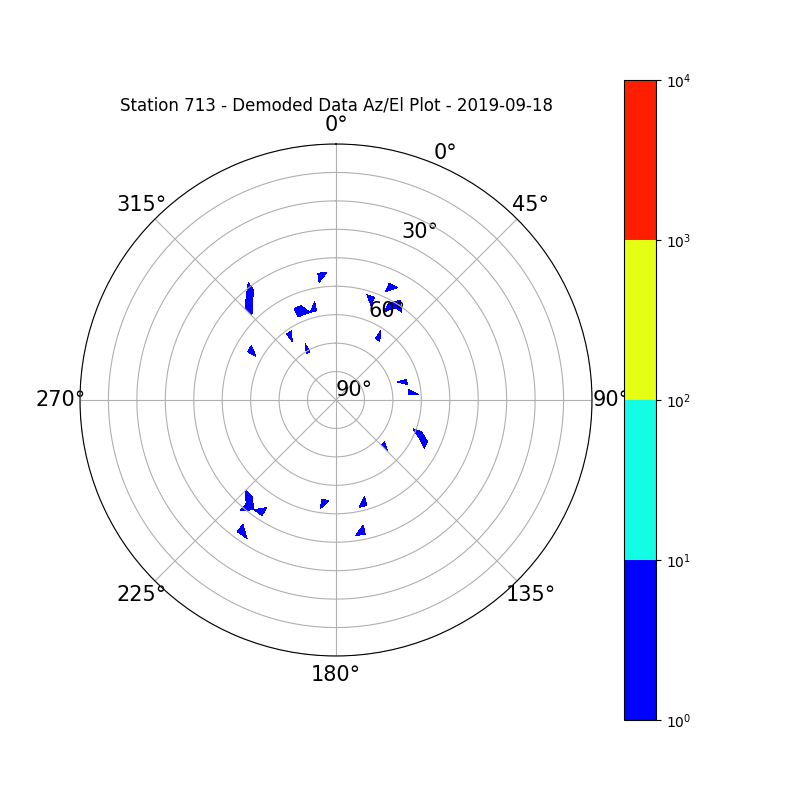
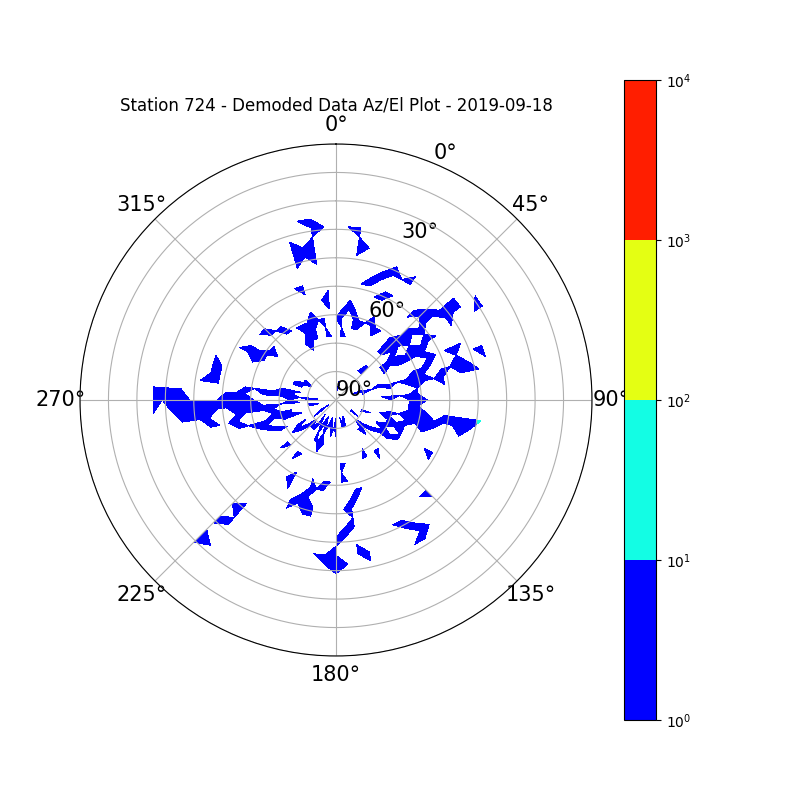
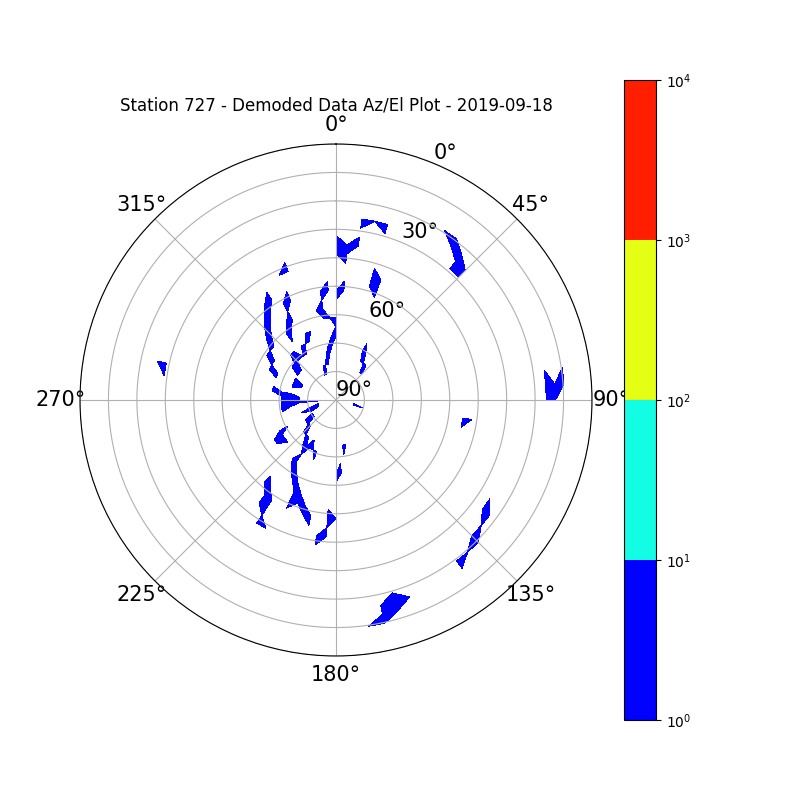
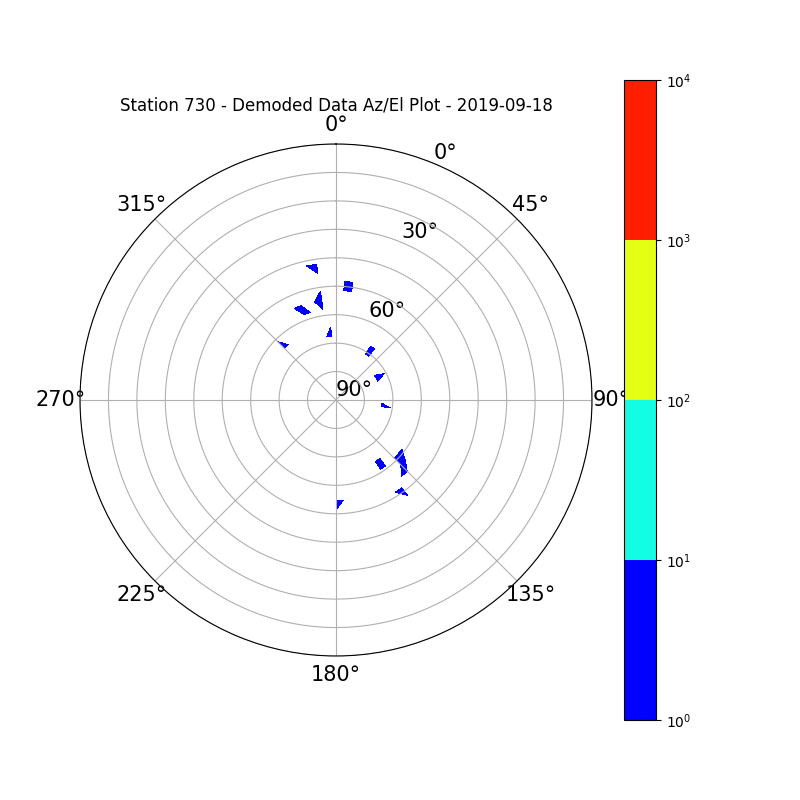
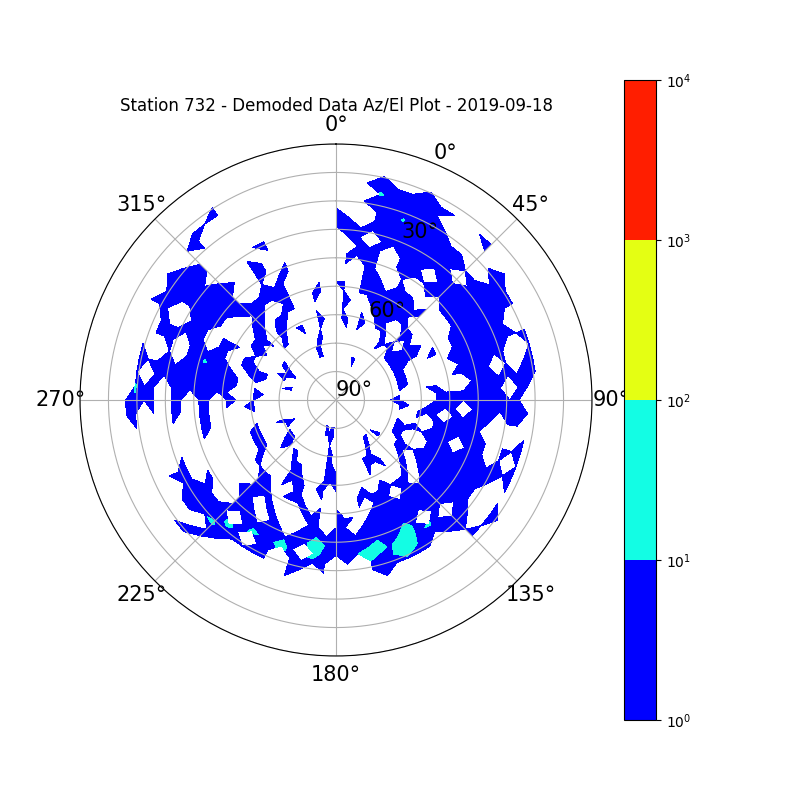
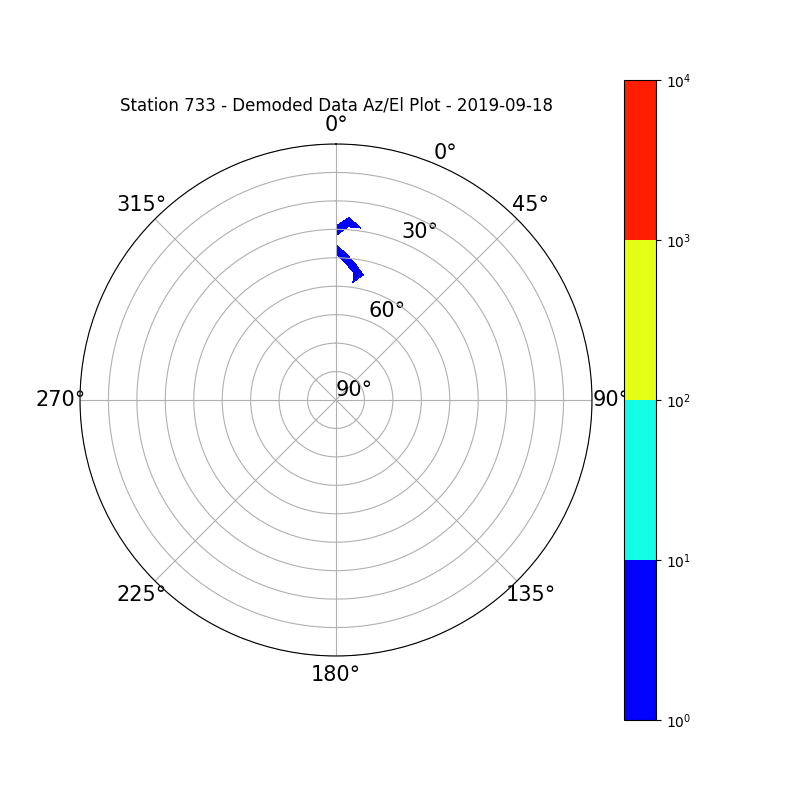
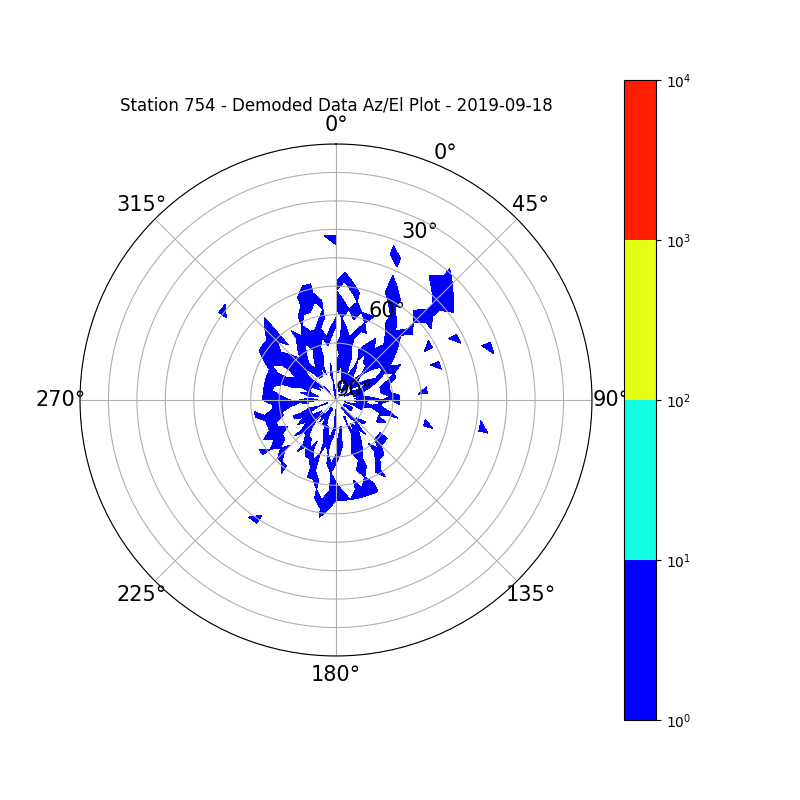
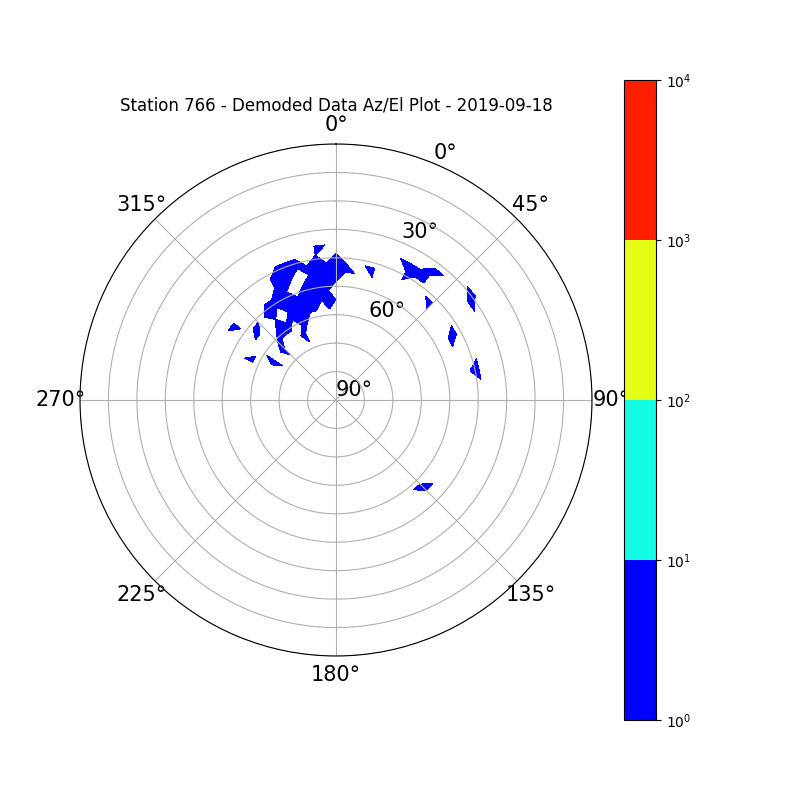
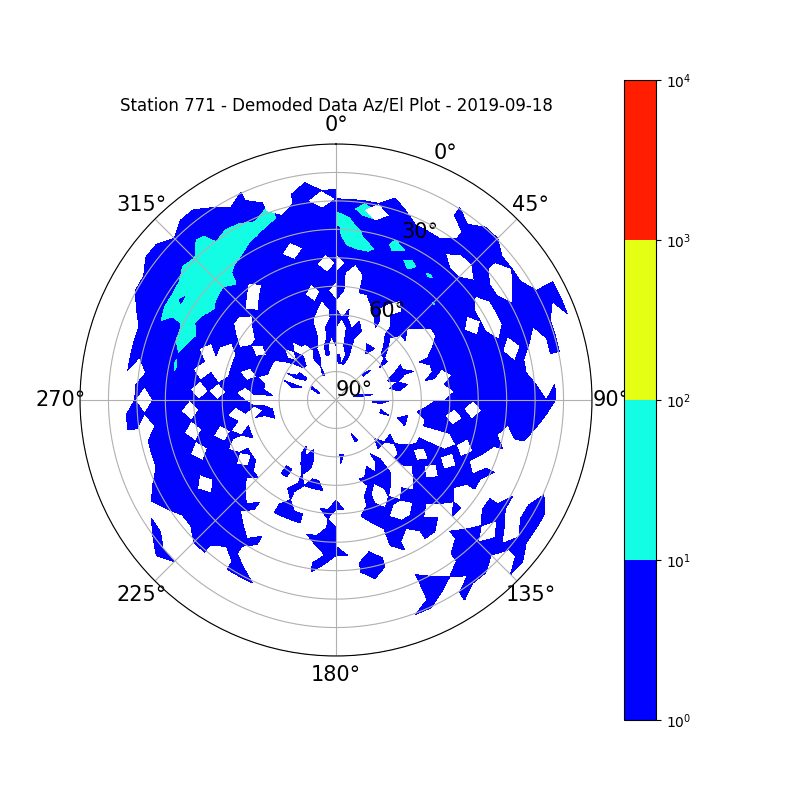
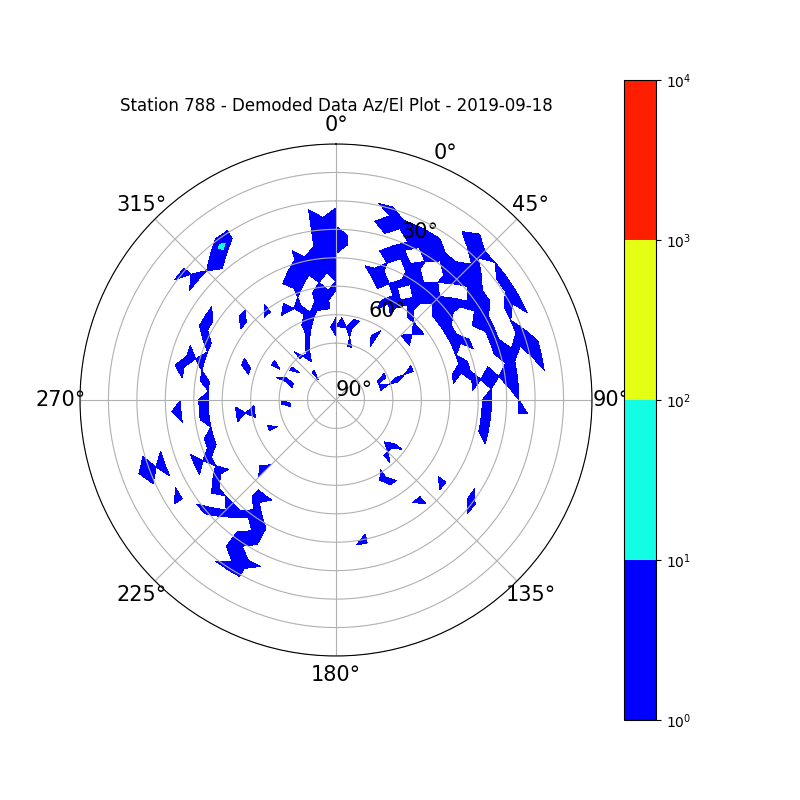
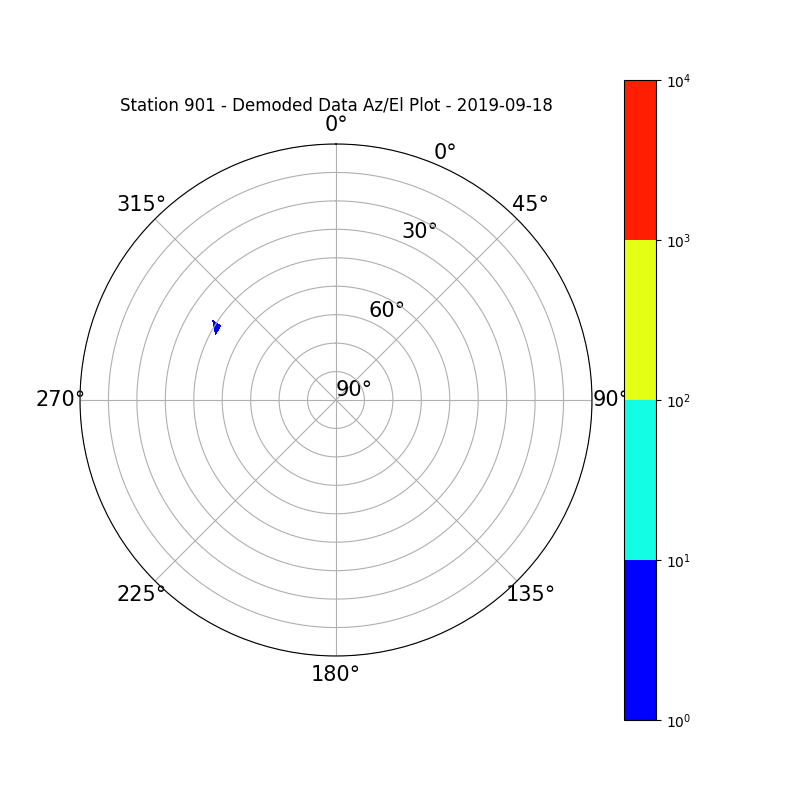
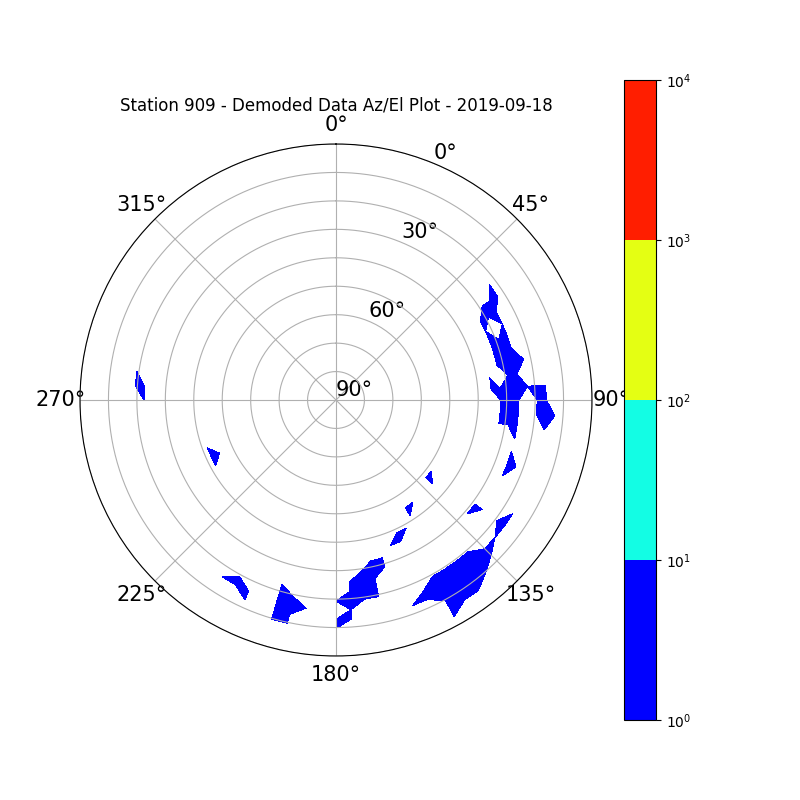
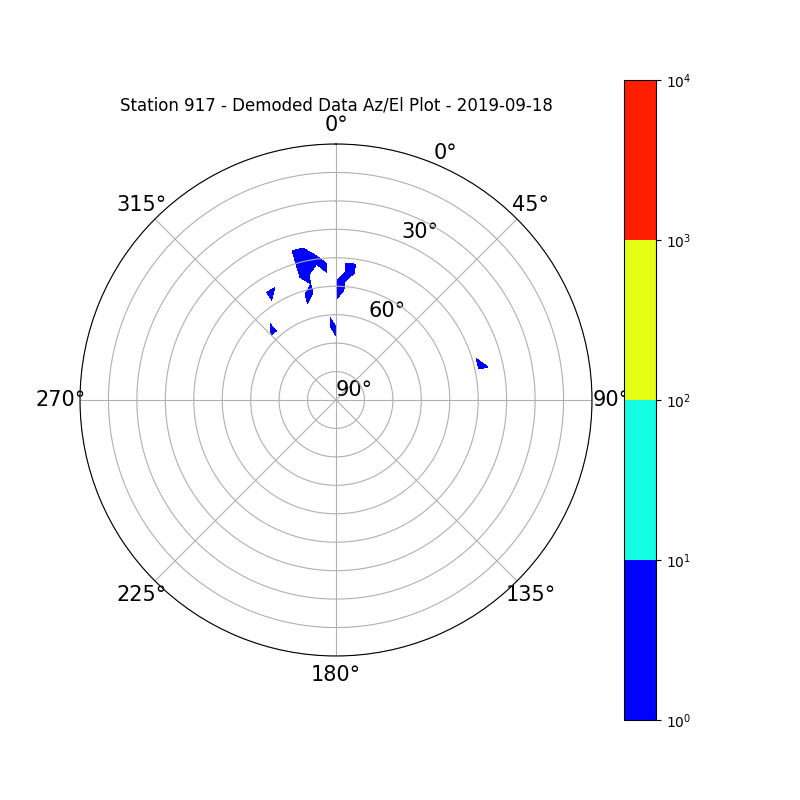
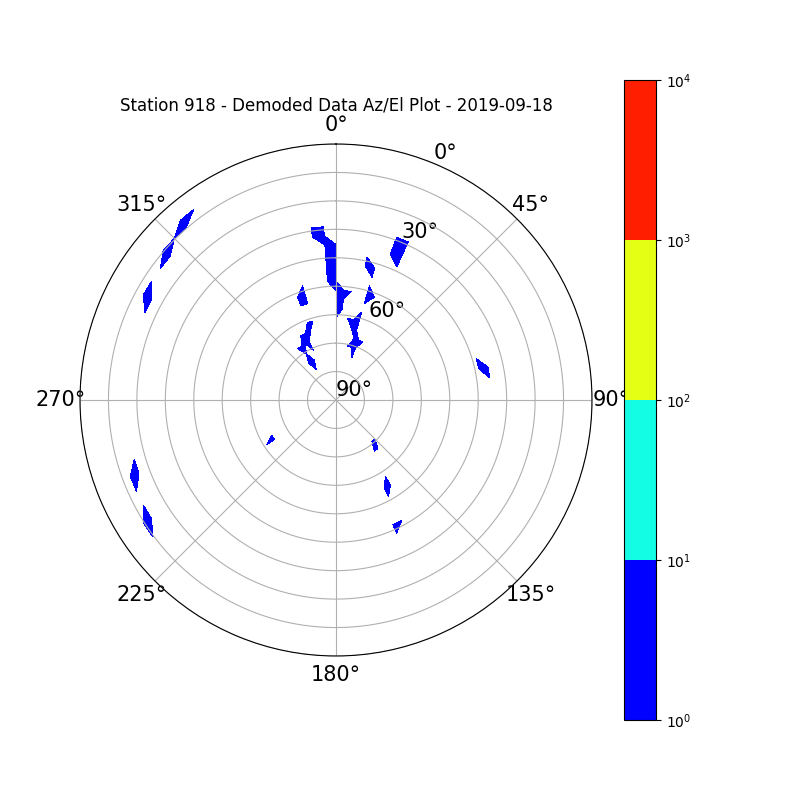
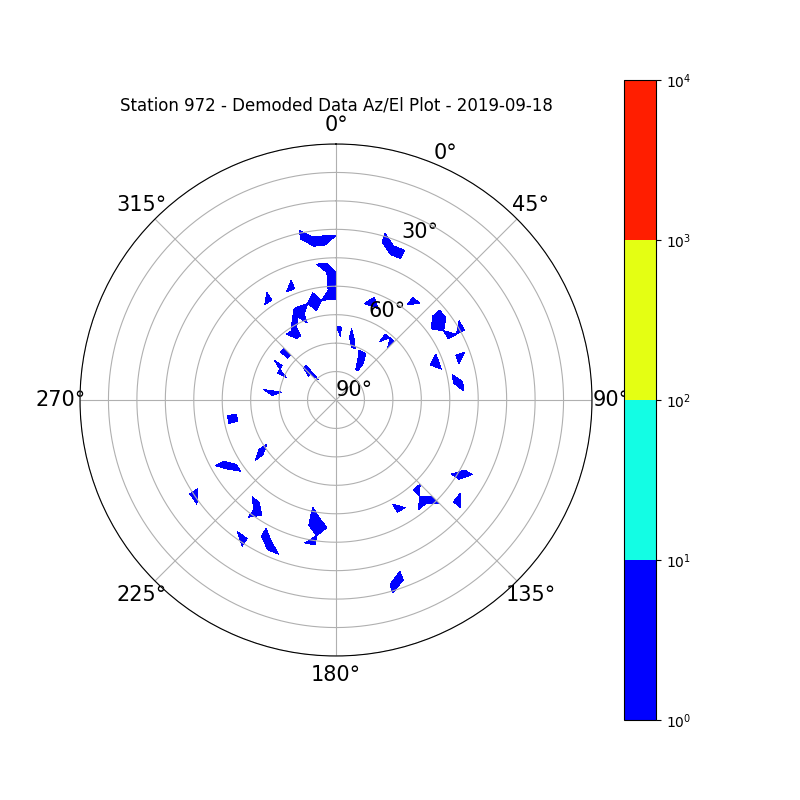
So in this diagram you can get an idea on which Az/El a station performs good enough to demodulate data. Have in mind that the sum of data (colored areas) are shown in logarithmic scale.
Data includes one entry for each data with unique timestamp of good observations with data. This means that data frames with the same timestamp are logged once. Also it doesn’t include data from png uploads, like SSTV or NOAA ones and CW decoded frames.
There are plans to have, in the future, page with stats like that but it needs some work before that.
For the past plots check this old thread.
Thanks to all for your contributions!

Station 2
Station 6
Station 7
Station 9

Station 10

Station 12
Station 15
Station 16
Station 21
Station 22
Station 23

Station 24
Station 25

Station 26

Station 27
Station 28
Station 31
Station 32
Station 33

Station 34

Station 35
Station 36
Station 37
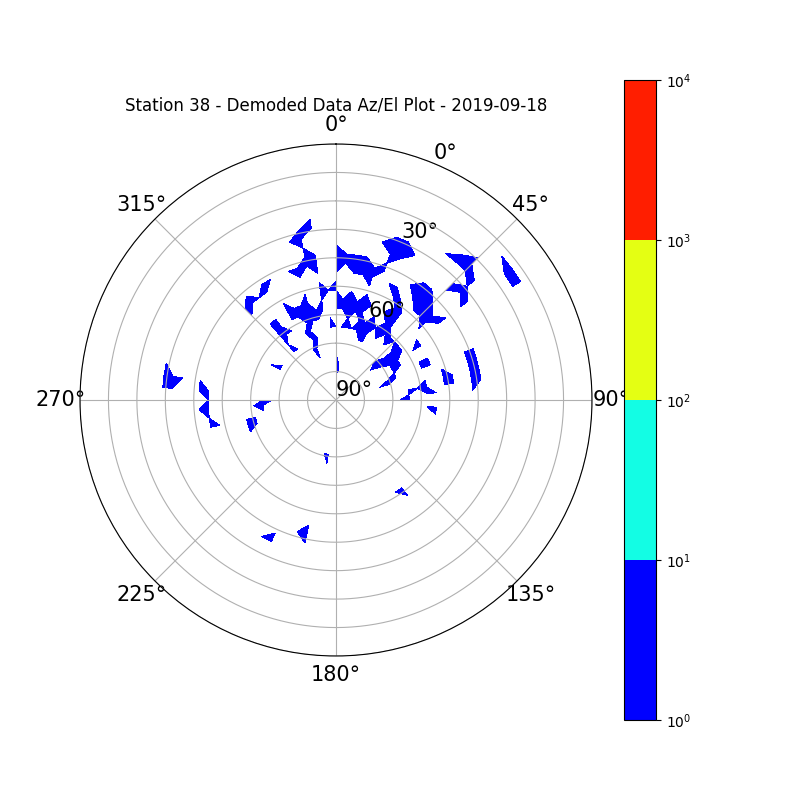
Station 38
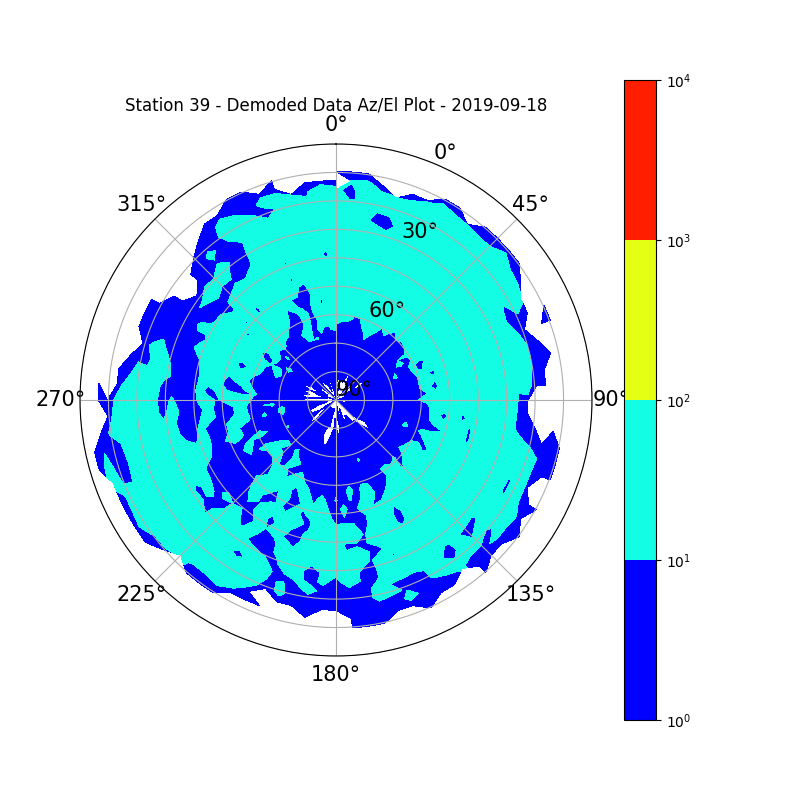
Station 39
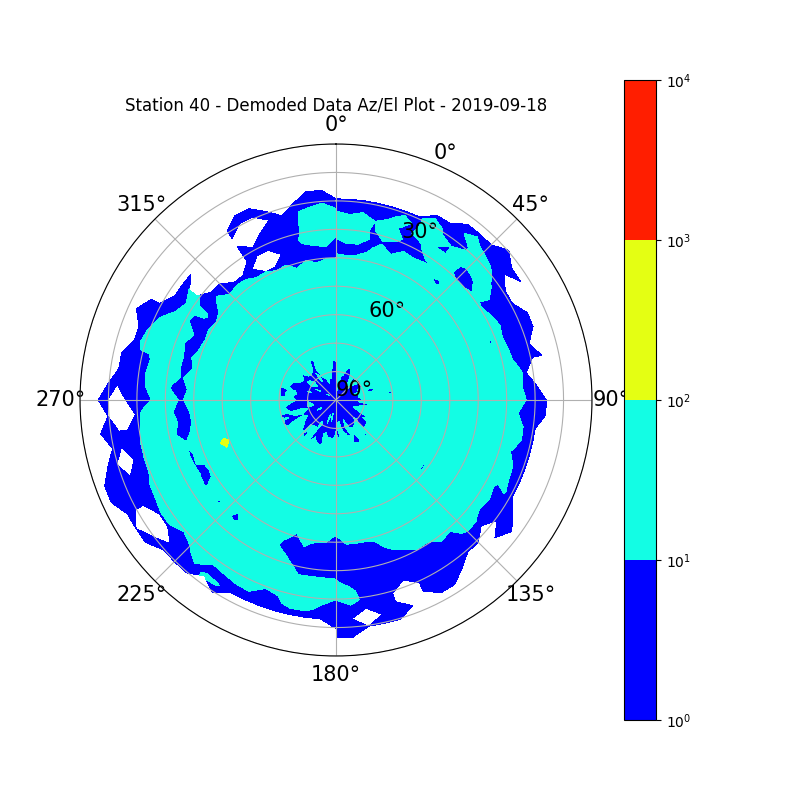
Station 40
Station 41

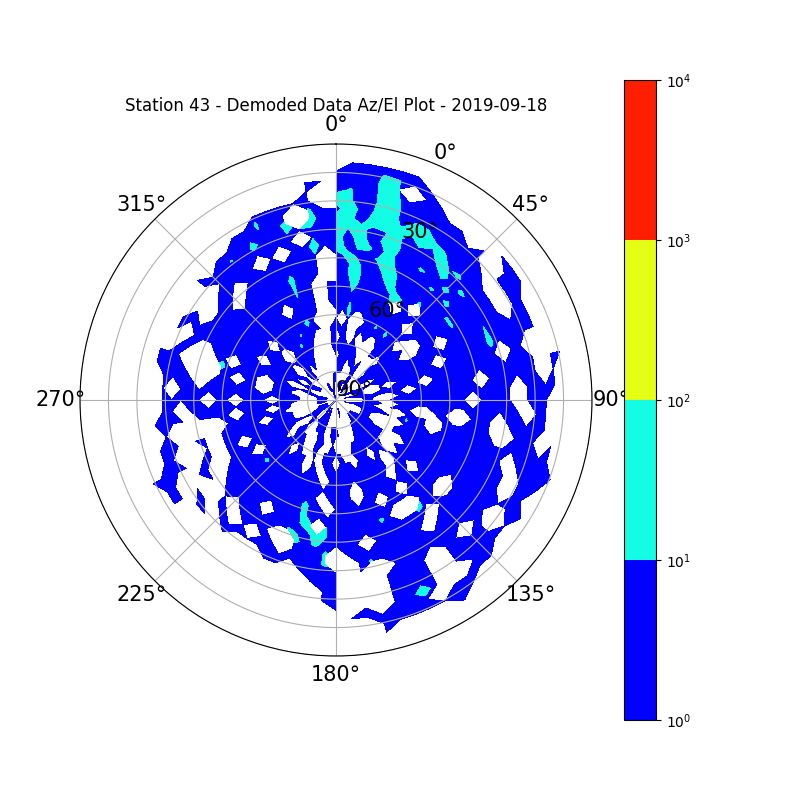
Station 43
Station 46

Station 47

Station 48

Station 49

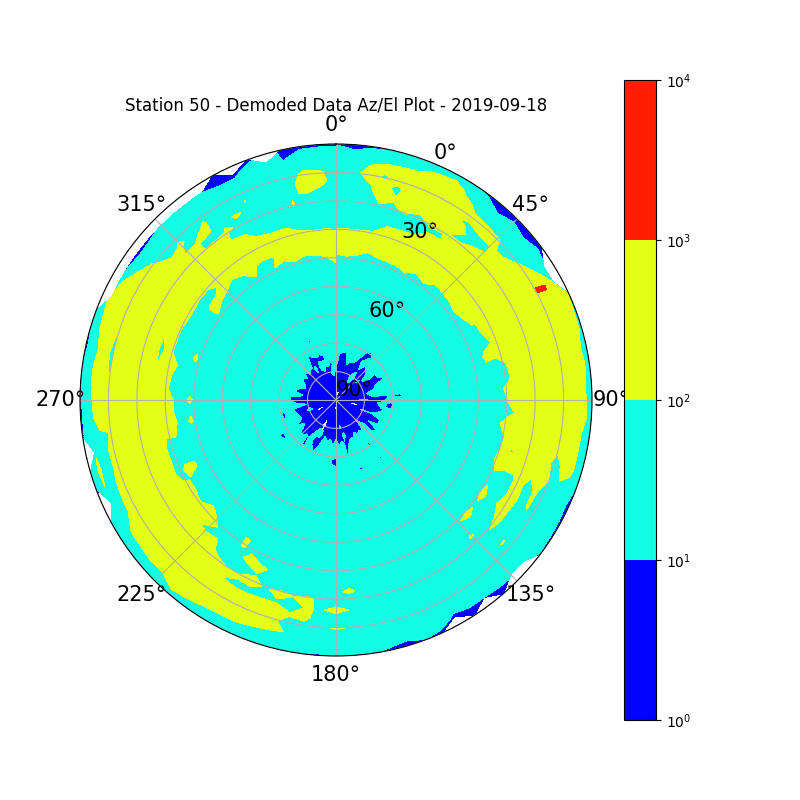
Station 50
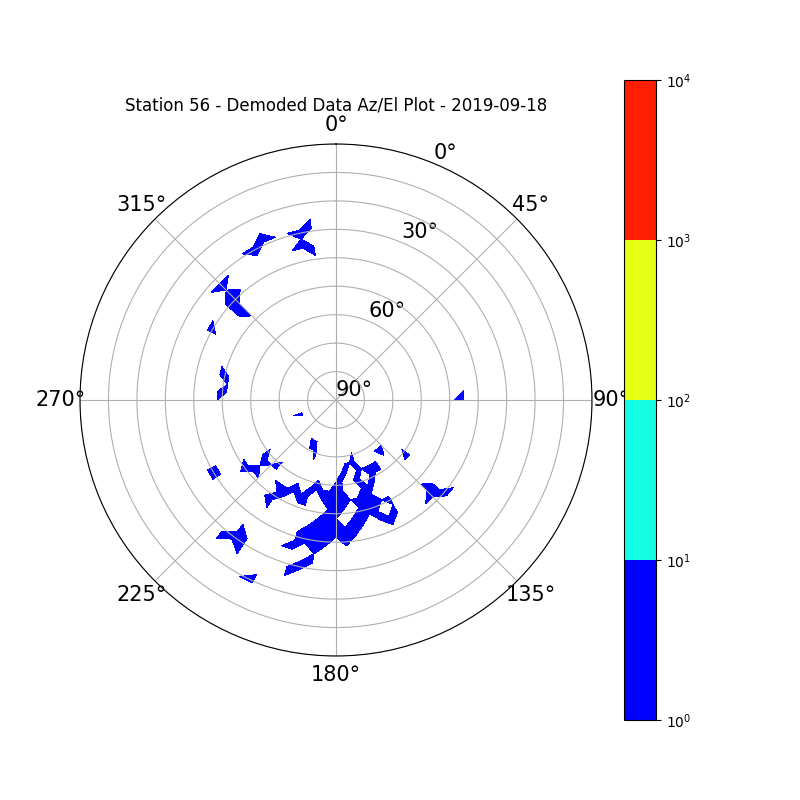
Station 56
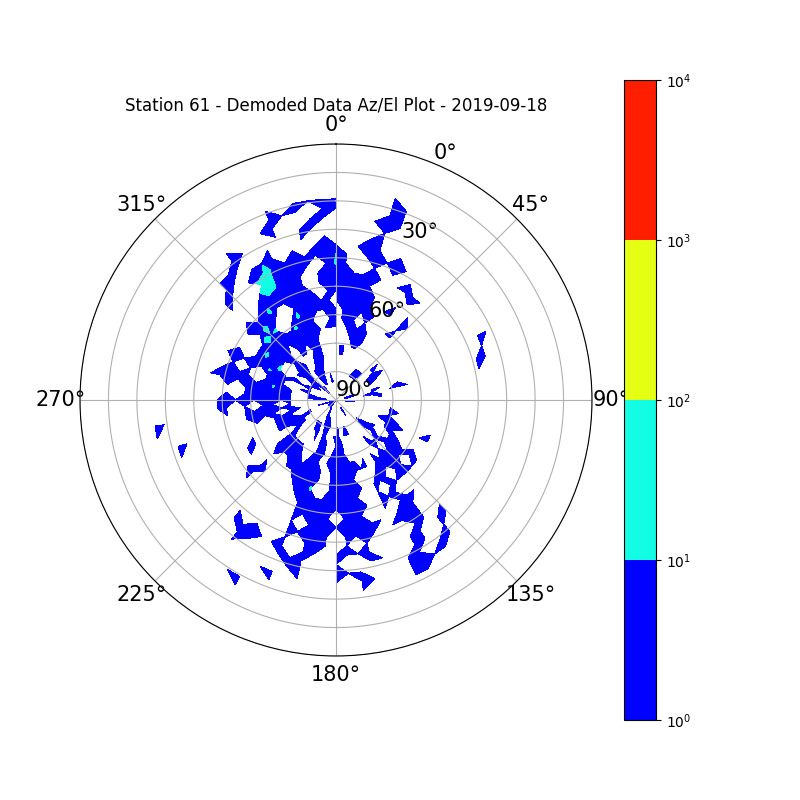
Station 61
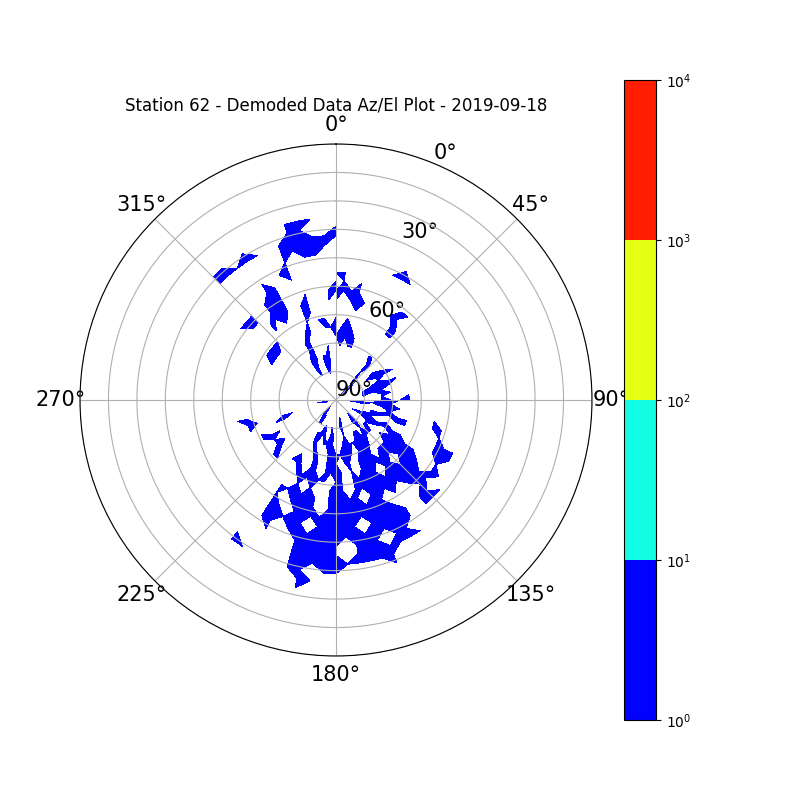
Station 62
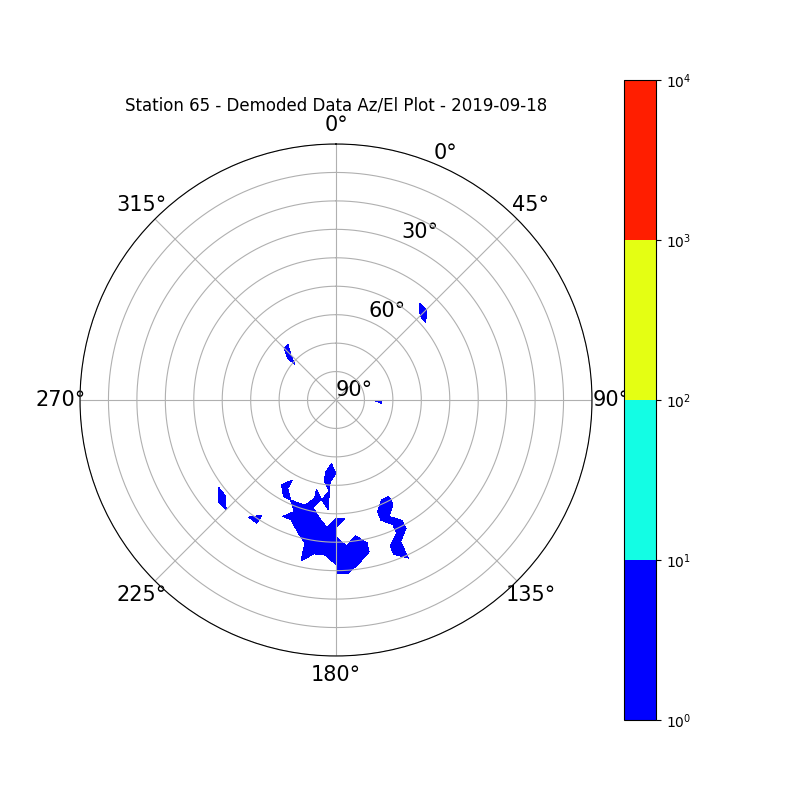
Station 65
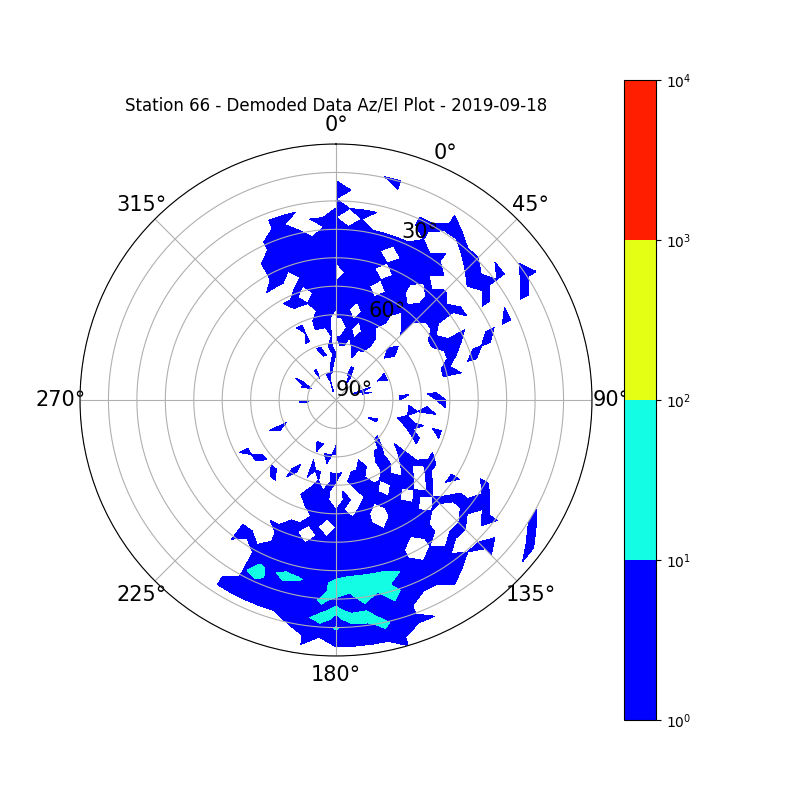
Station 66
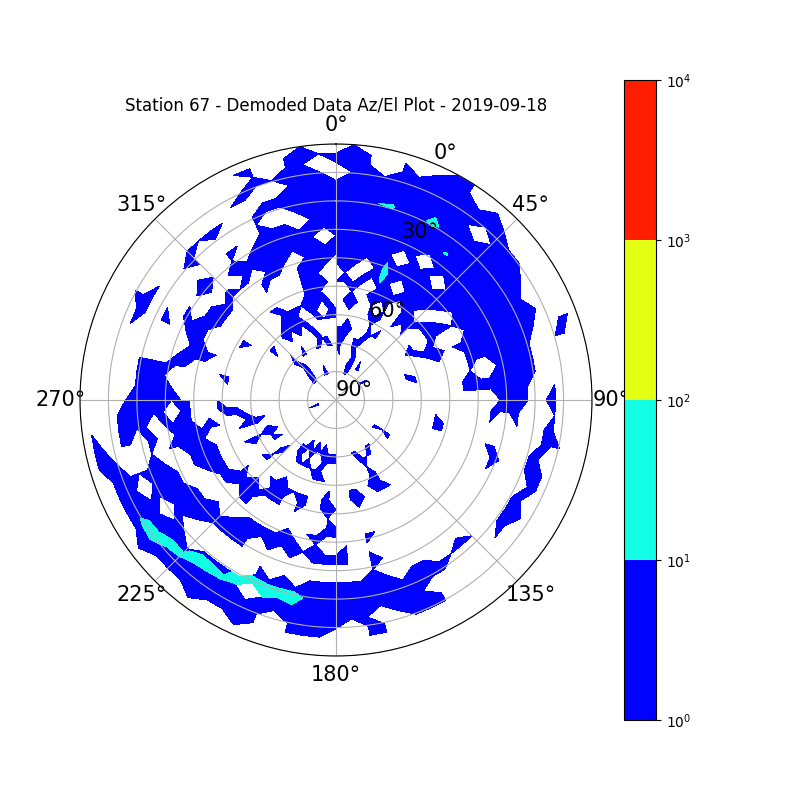
Station 67
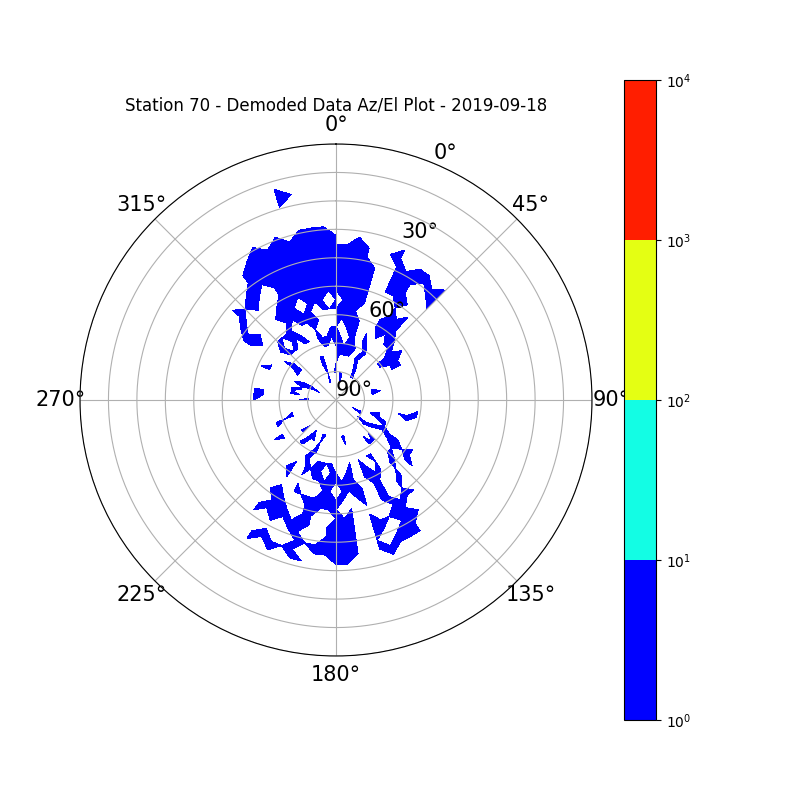
Station 70
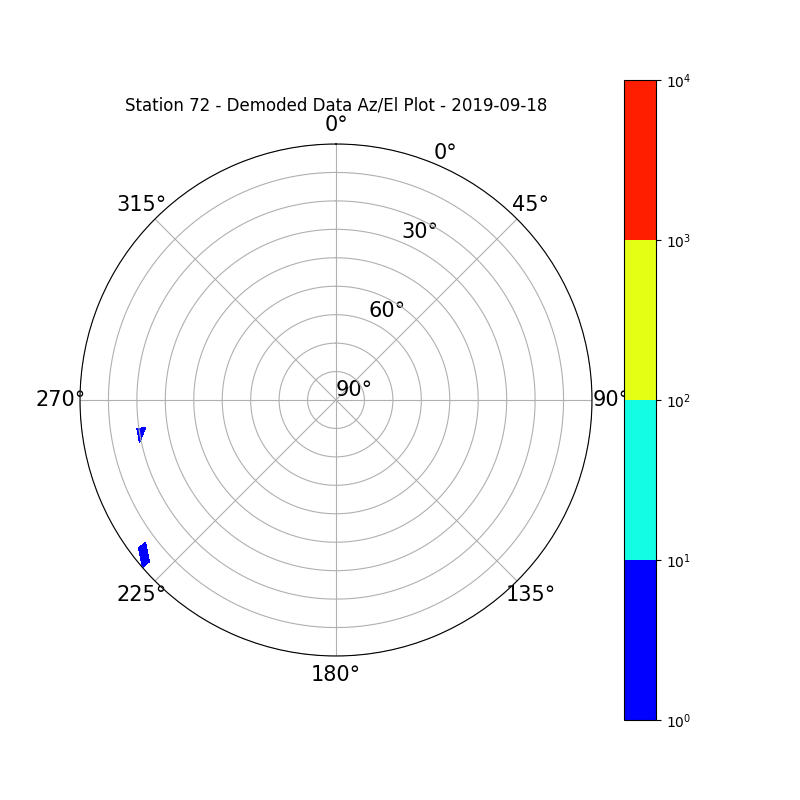
Station 72
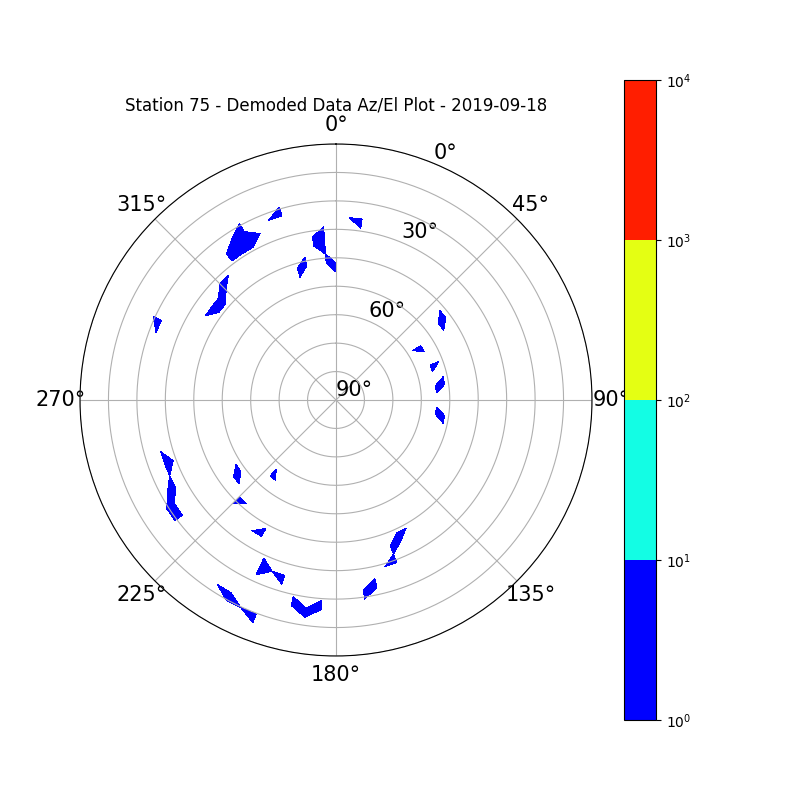
Station 75
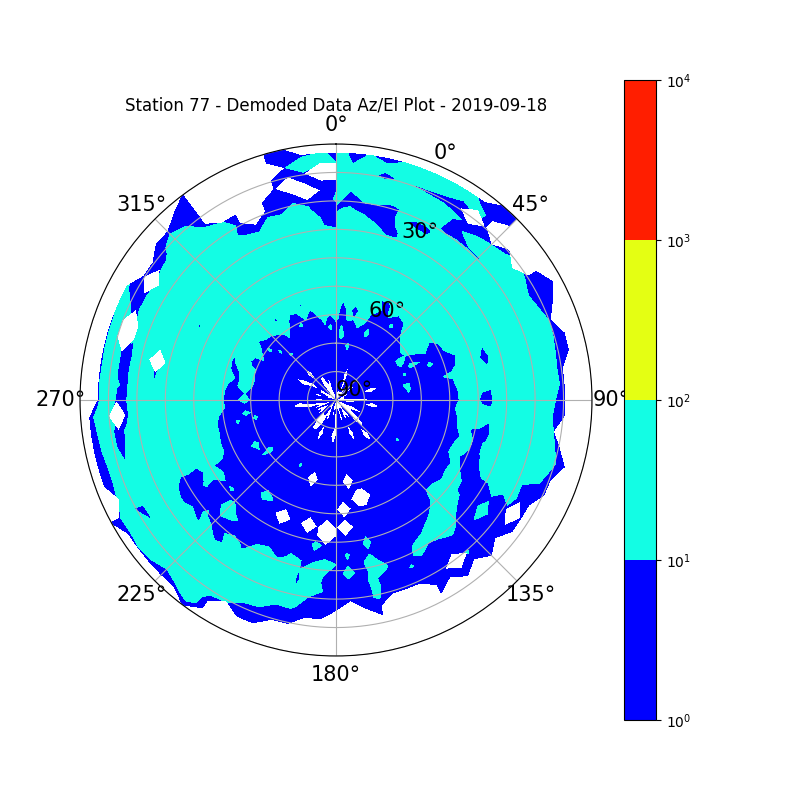
Station 77
Station 83

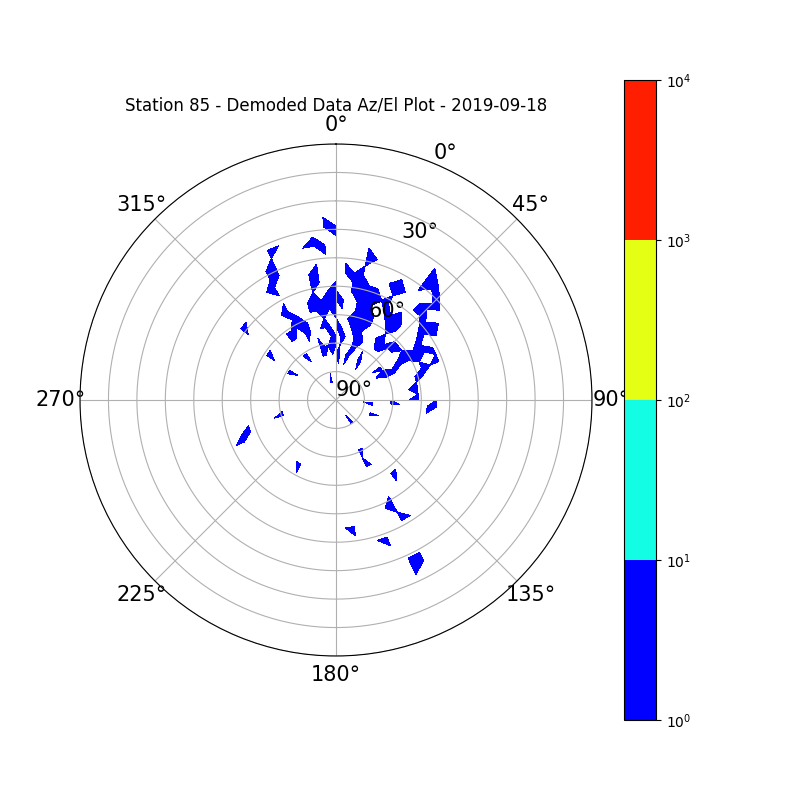
Station 85
Station 86

Station 87
Station 89

Station 91
Station 92

Station 95

Station 96
Station 98
Station 100
Station 101
Station 102
Station 105
Station 106

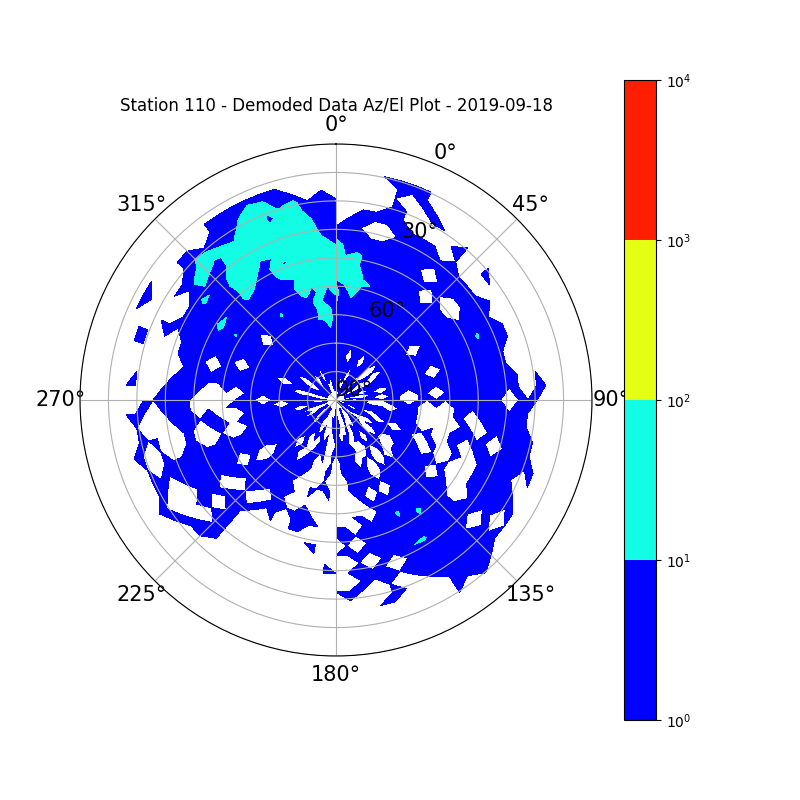
Station 110
Station 111

Station 123

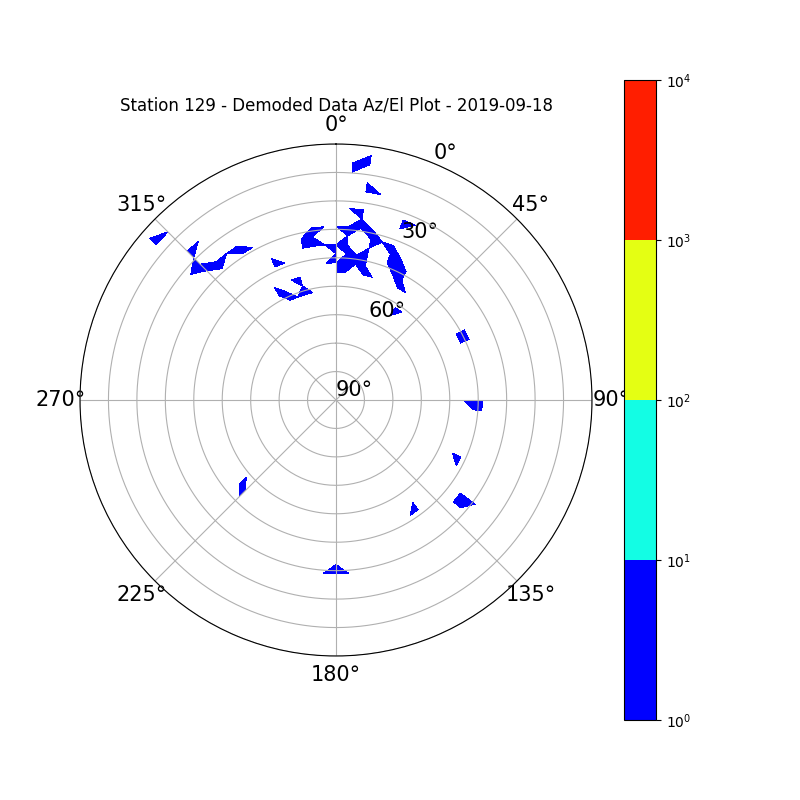
Station 129
Station 130

Station 133

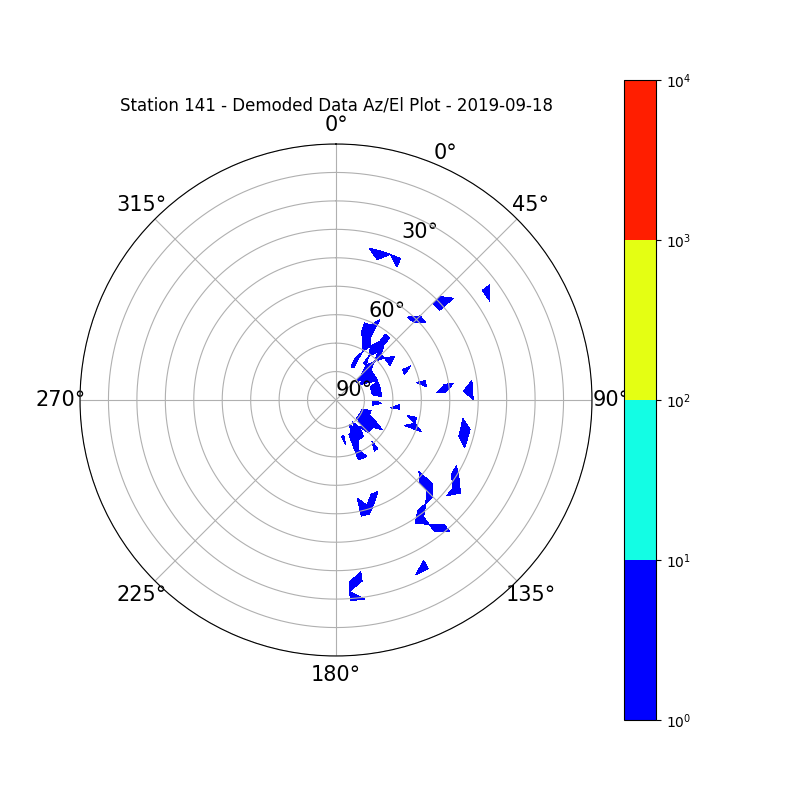
Station 141
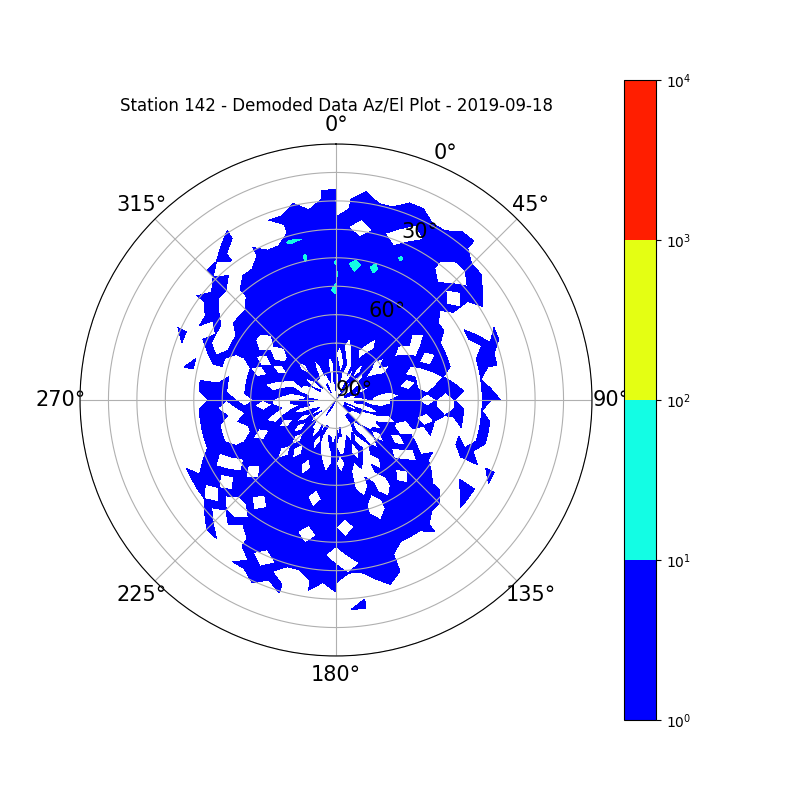
Station 142
Station 146
Station 147
Station 150
Station 152
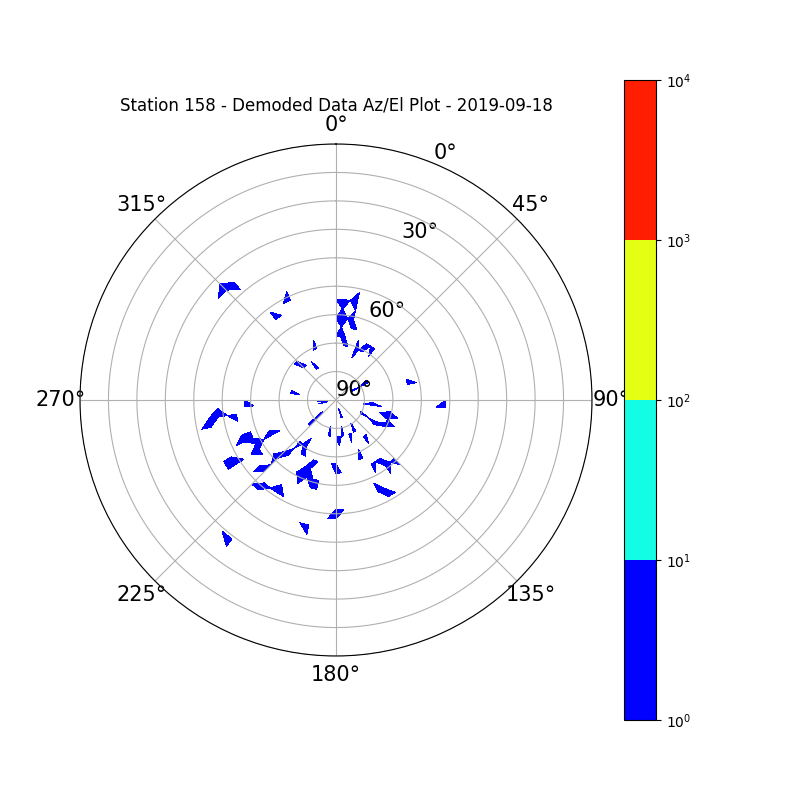
Station 158
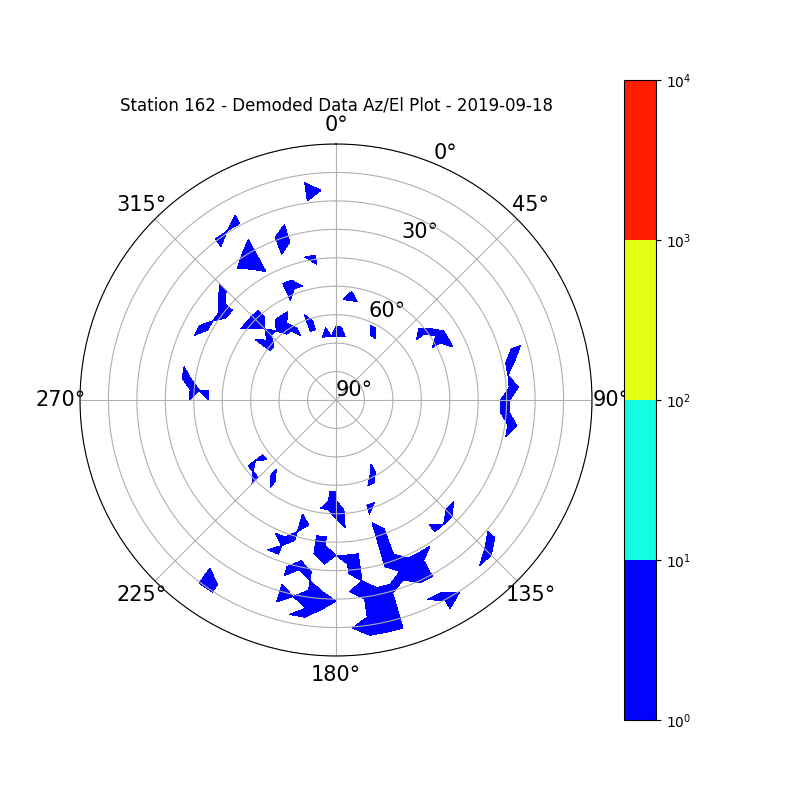
Station 162
Station 164

Station 165

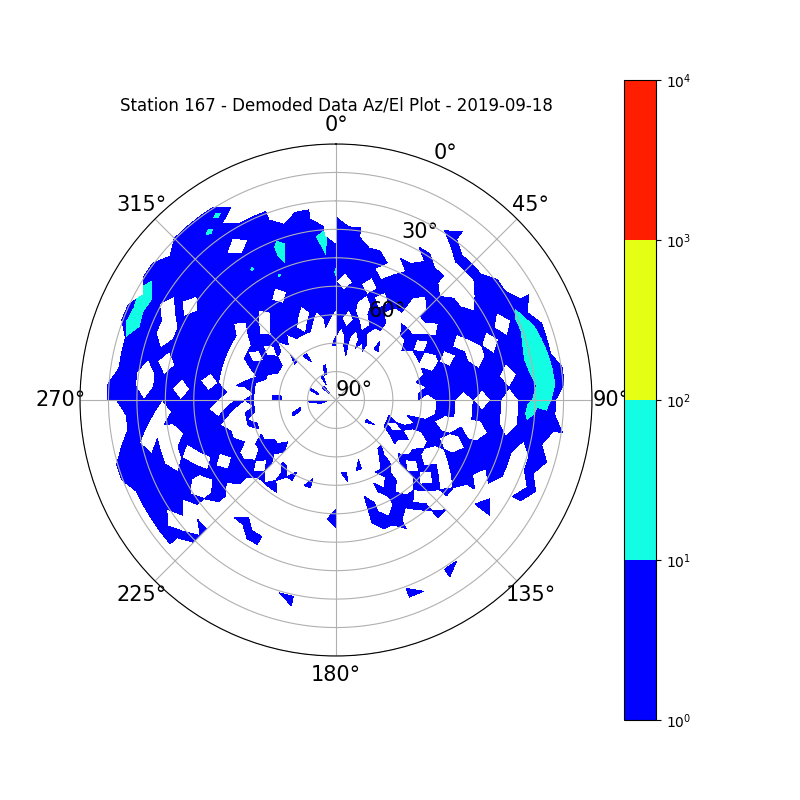
Station 167
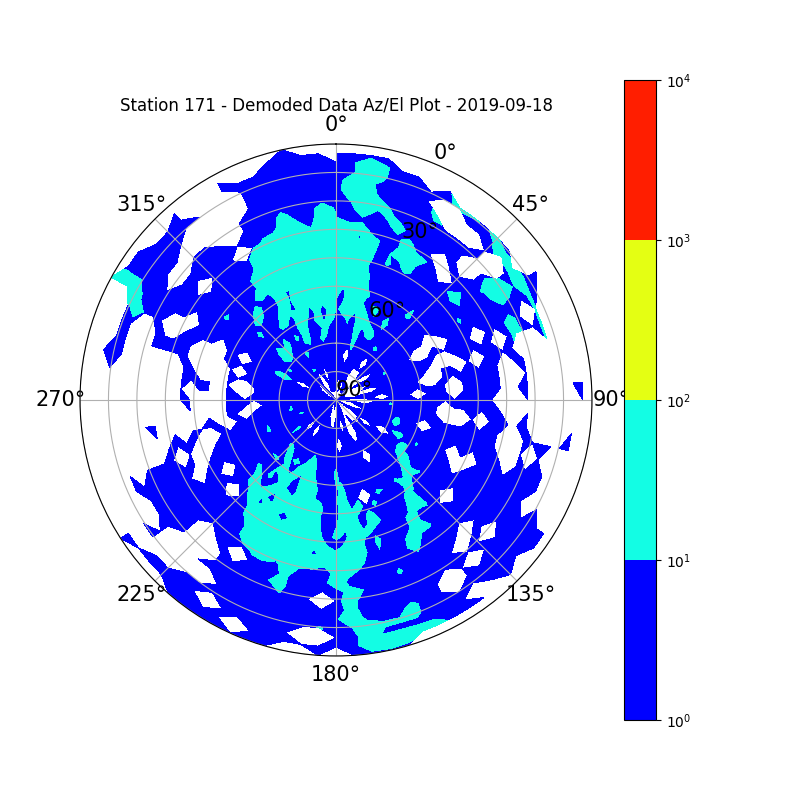
Station 171
Station 173
Station 175
Station 176

Station 177
Station 183
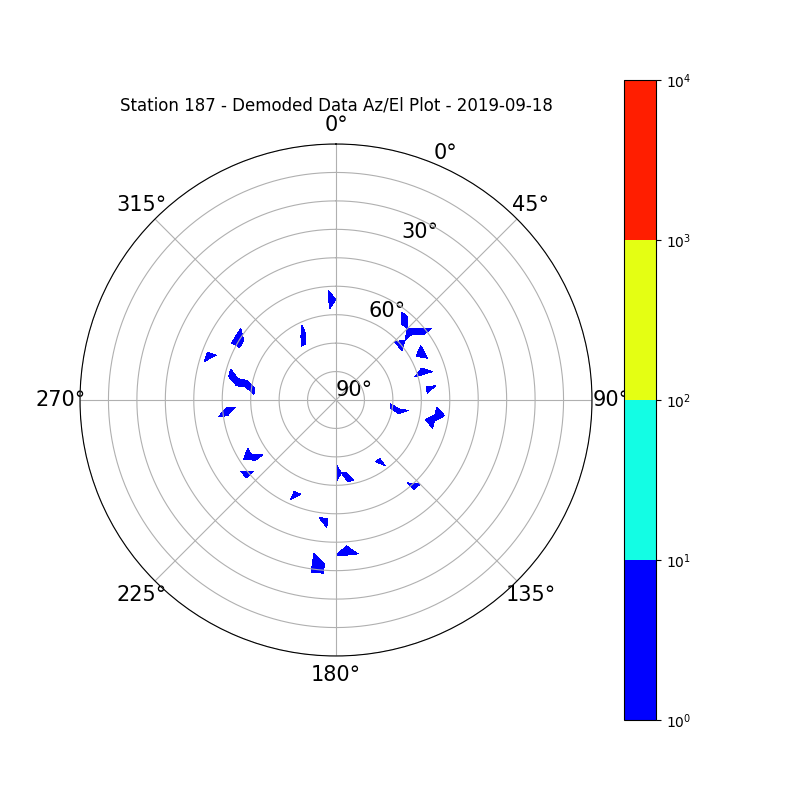
Station 187
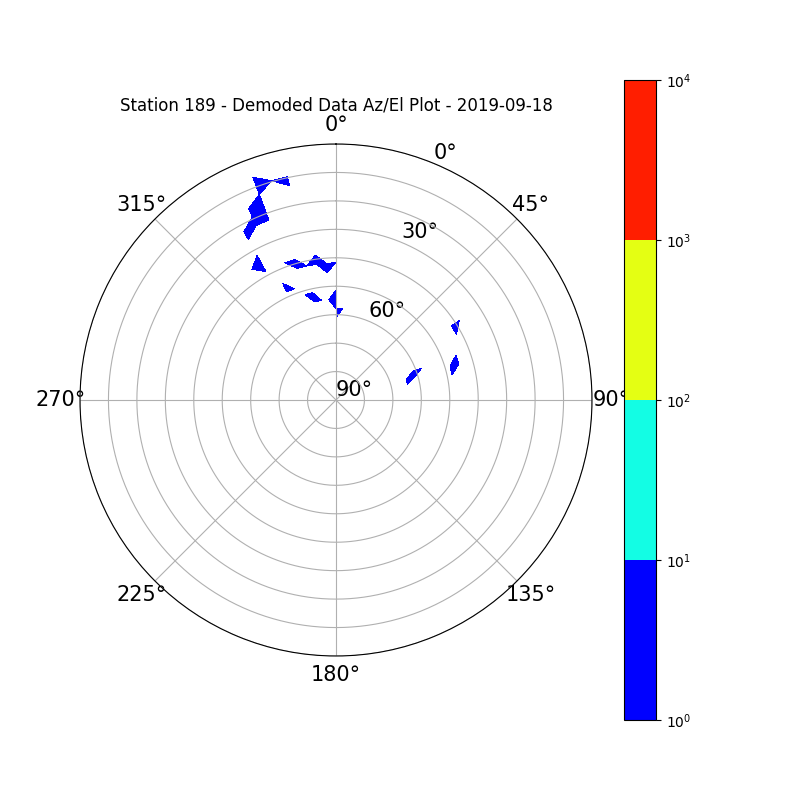
Station 189
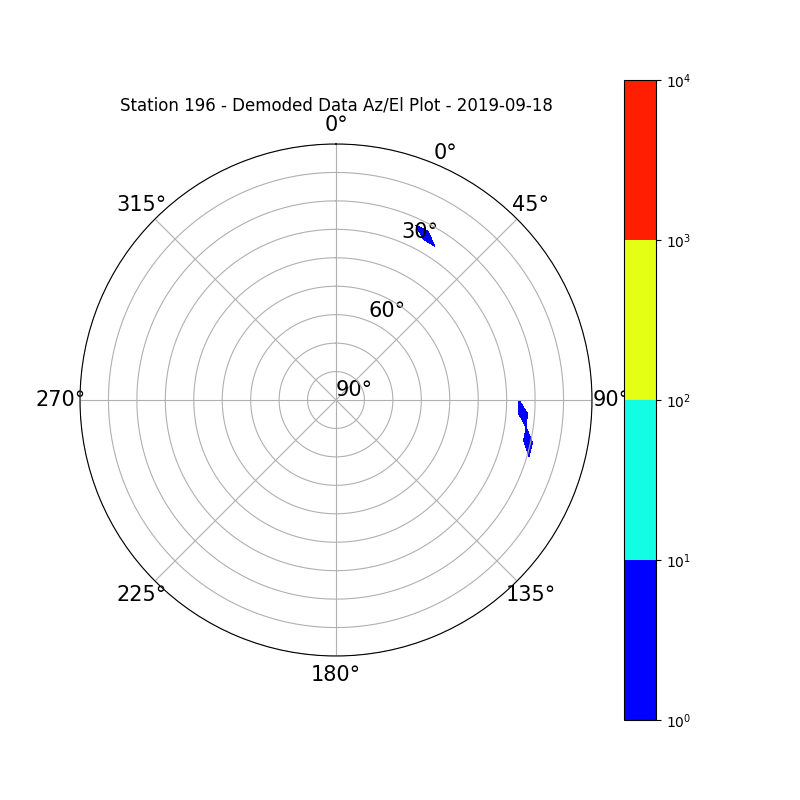
Station 196
Station 200

Station 201

Station 203

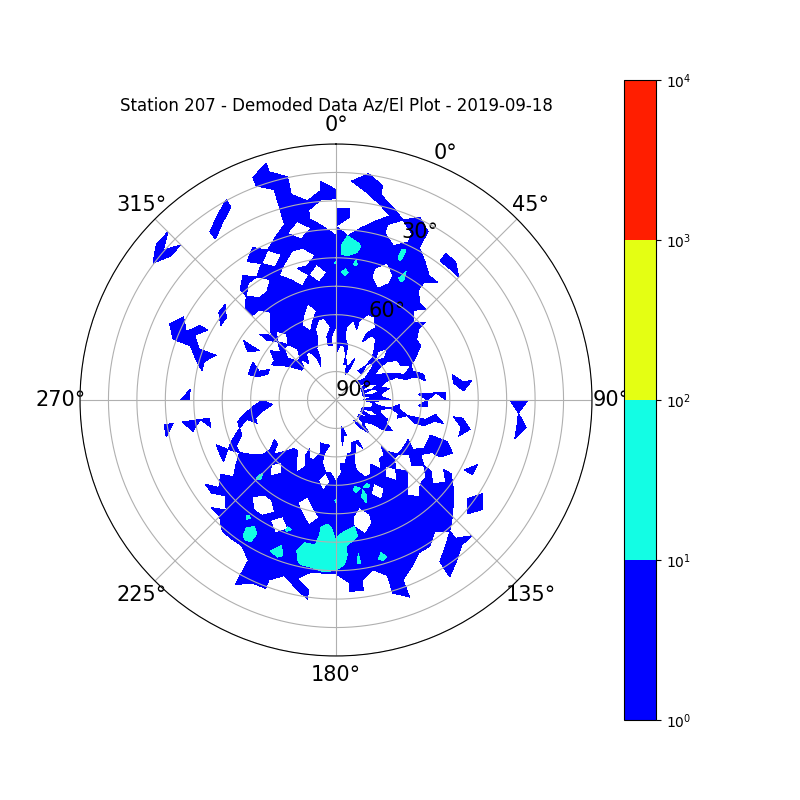
Station 207
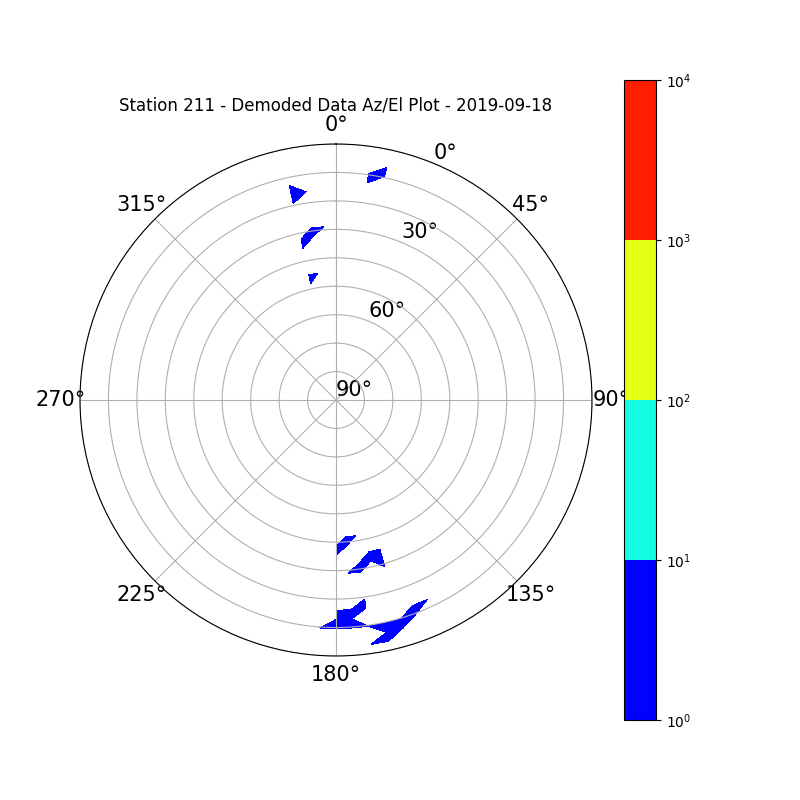
Station 211
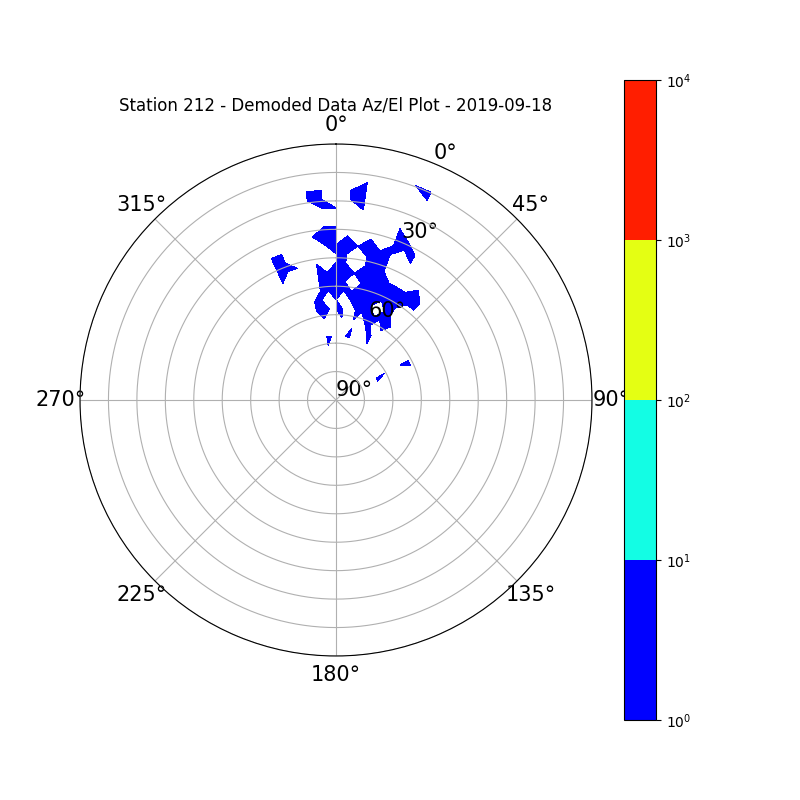
Station 212
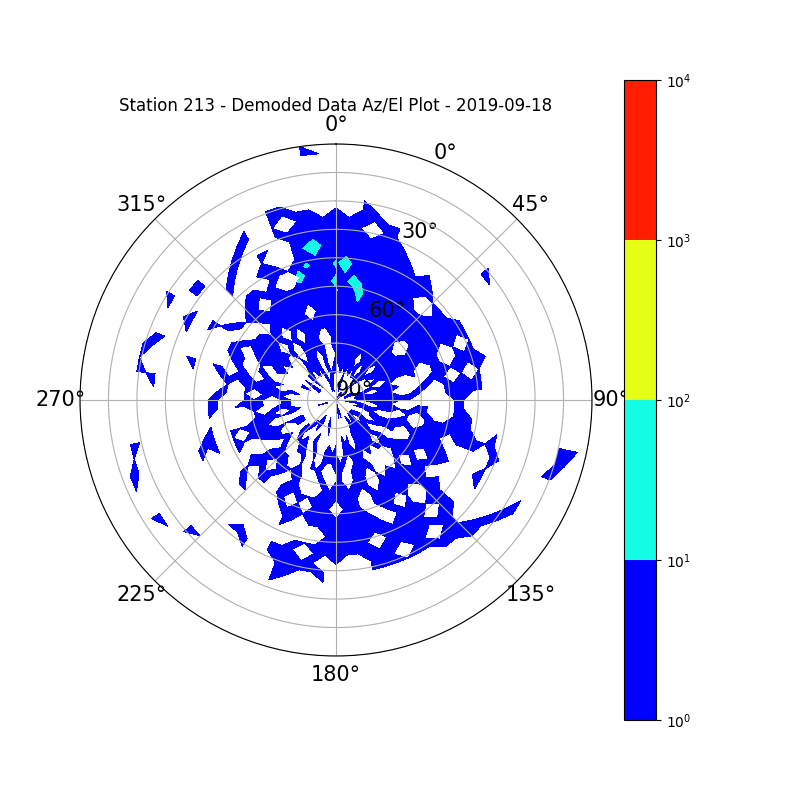
Station 213
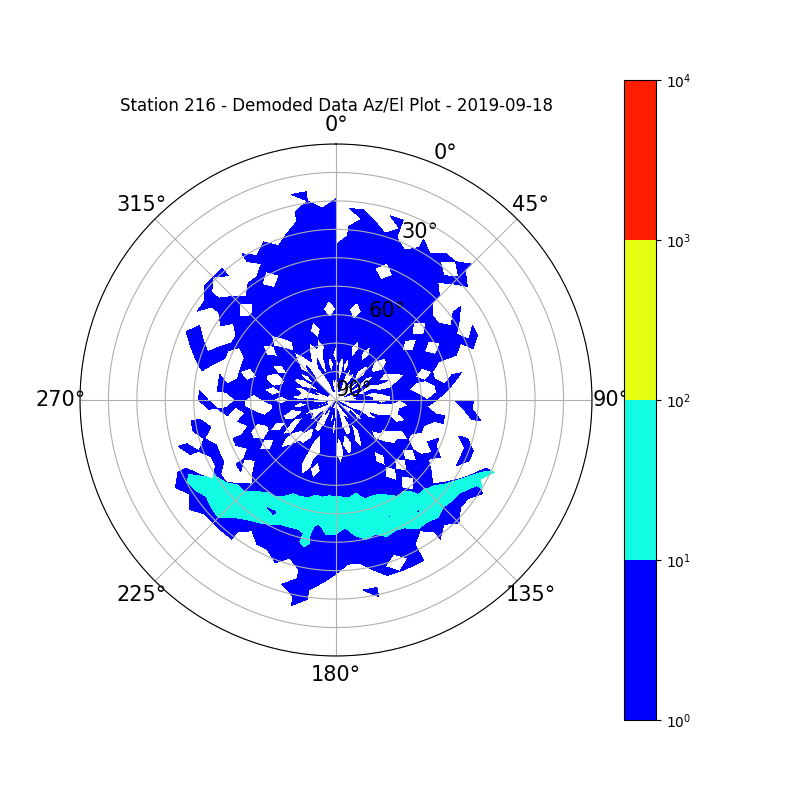
Station 216
Station 217

Station 221
Station 223
Station 227

Station 229
Station 232
Station 233

Station 234

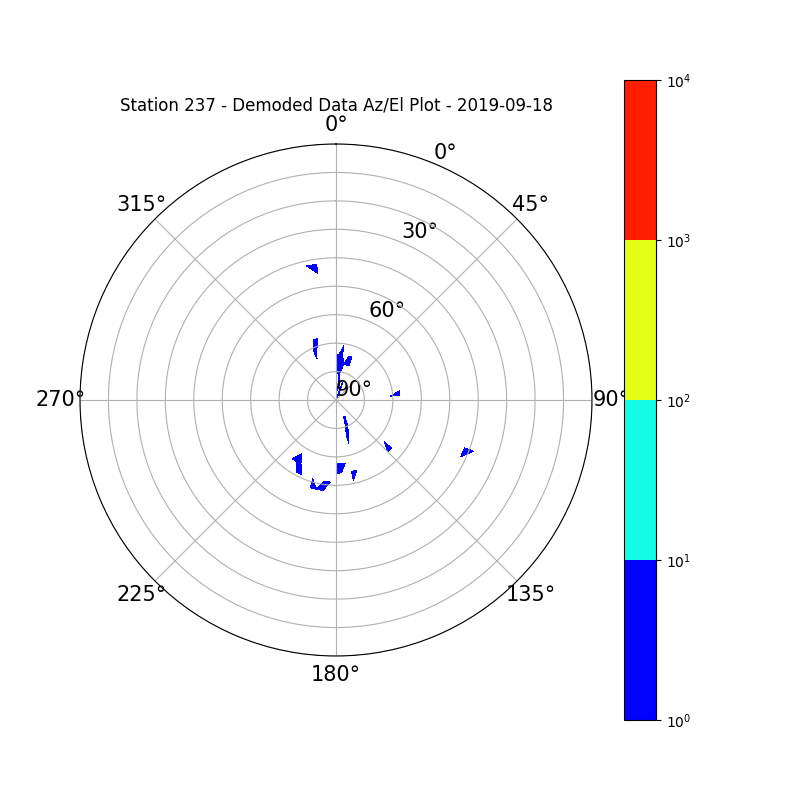
Station 237
Station 238

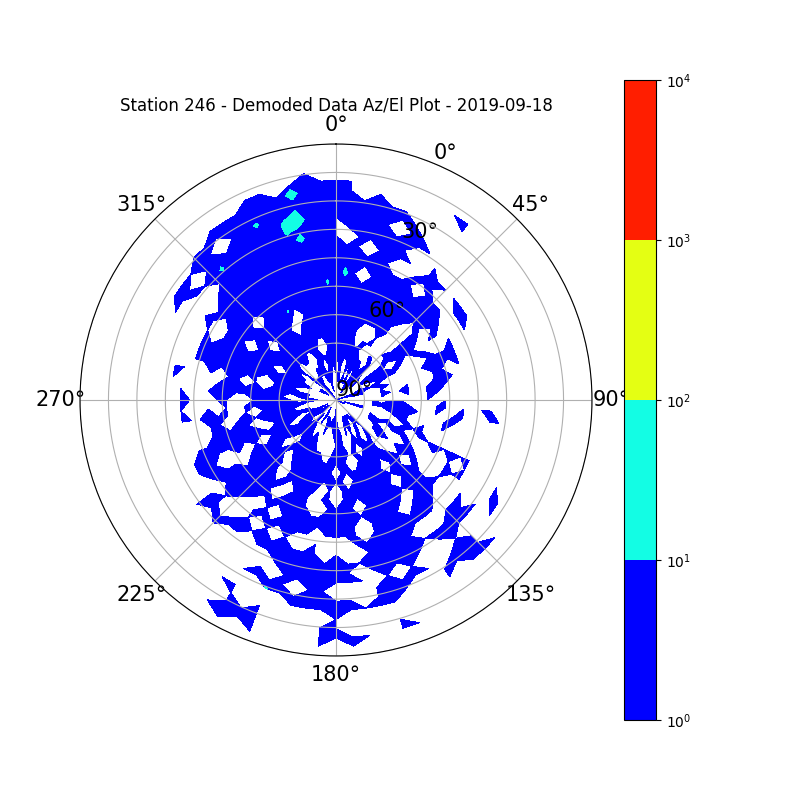
Station 246
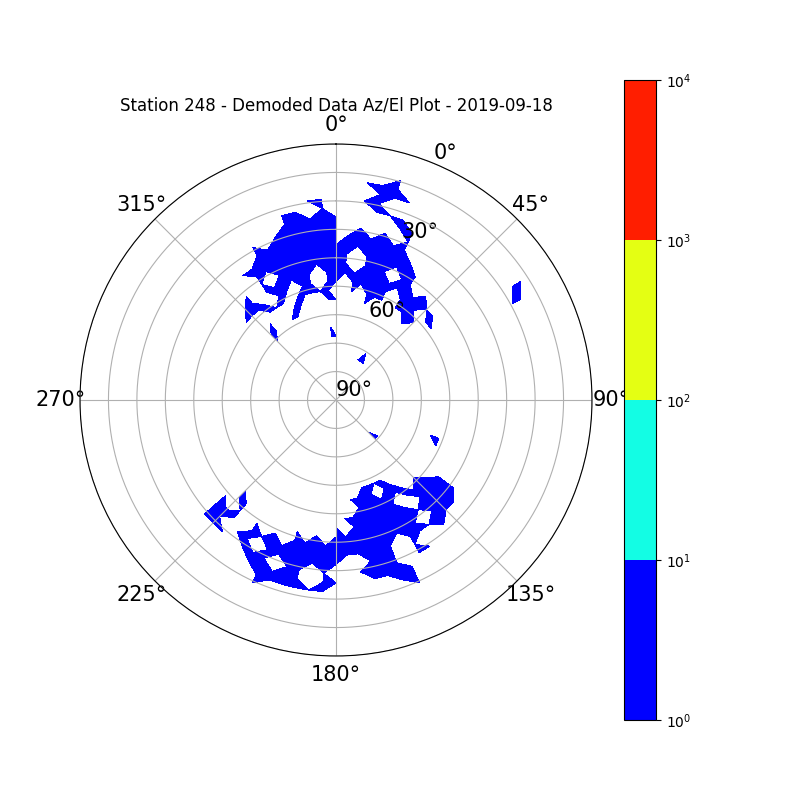
Station 248
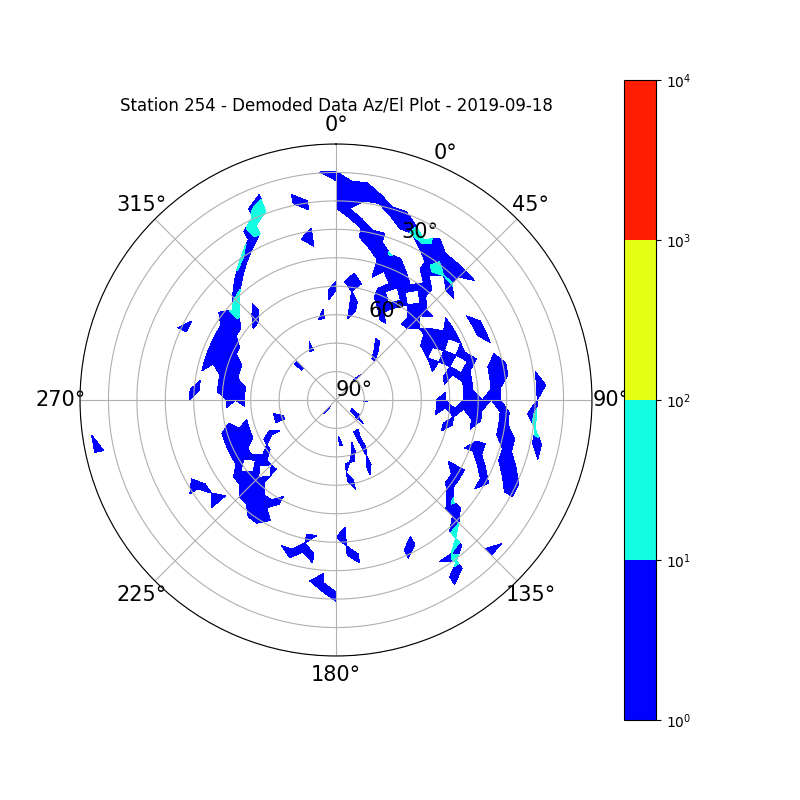
Station 254
Station 255
Station 256
Station 271
Station 272
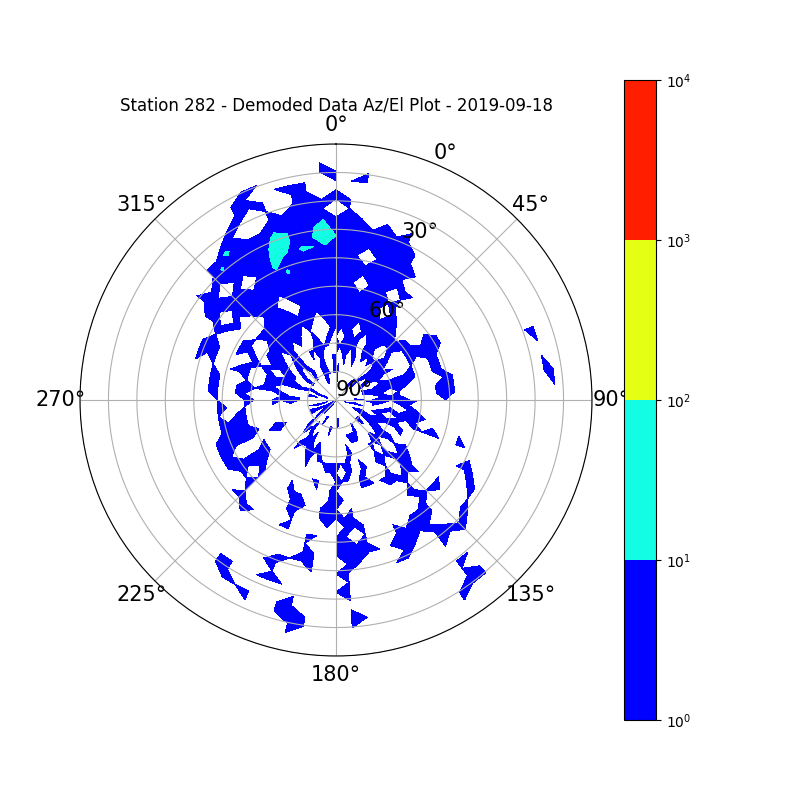
Station 282
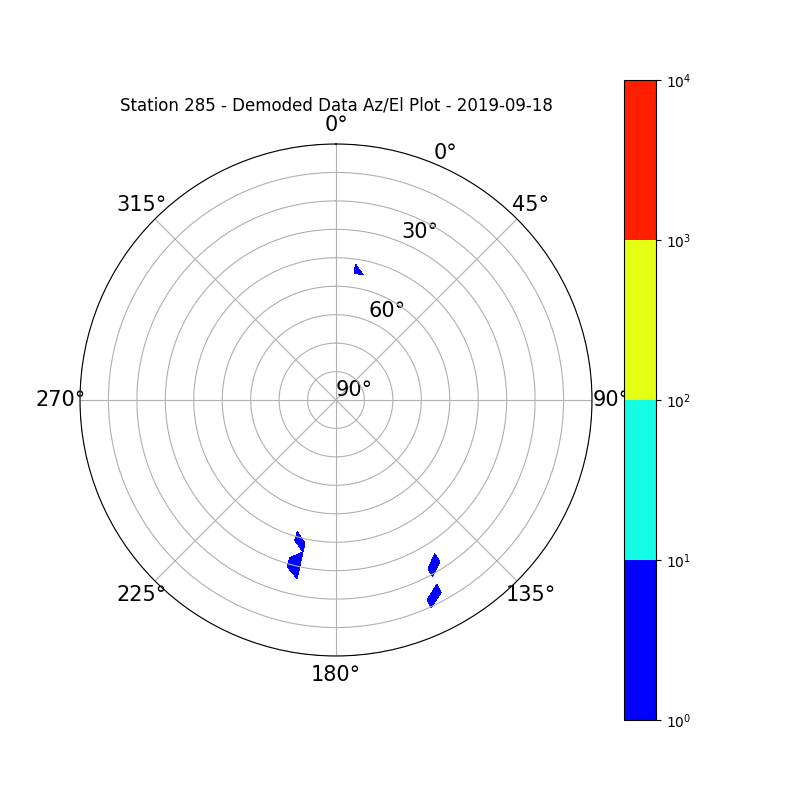
Station 285
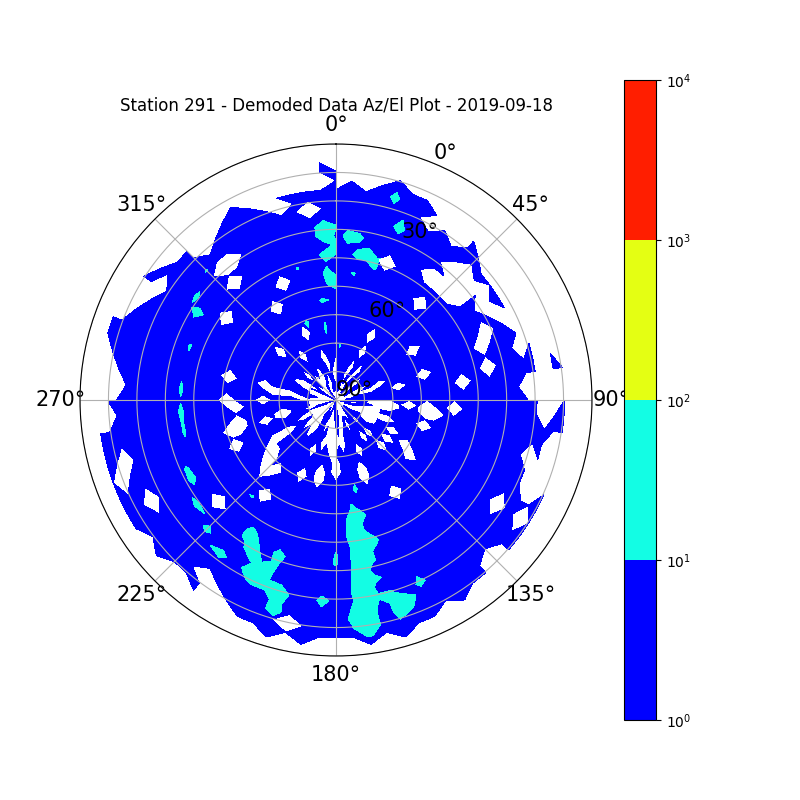
Station 291
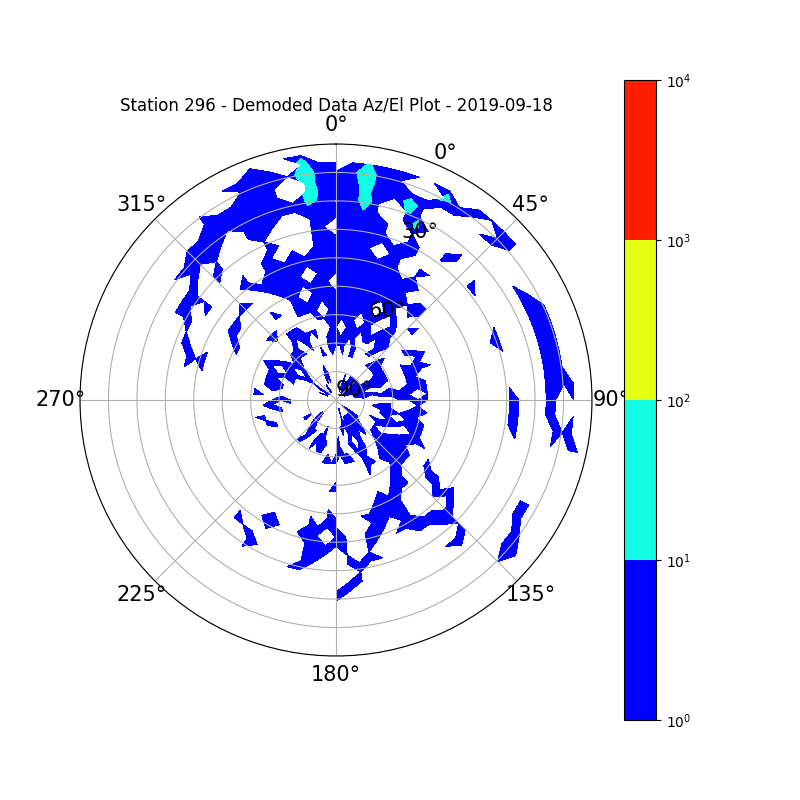
Station 296
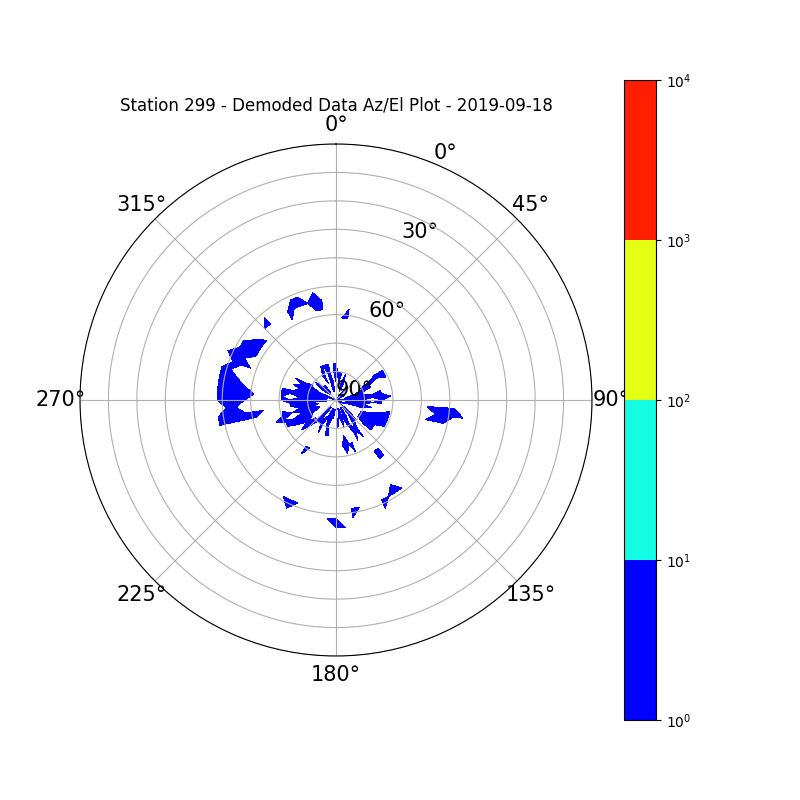
Station 299
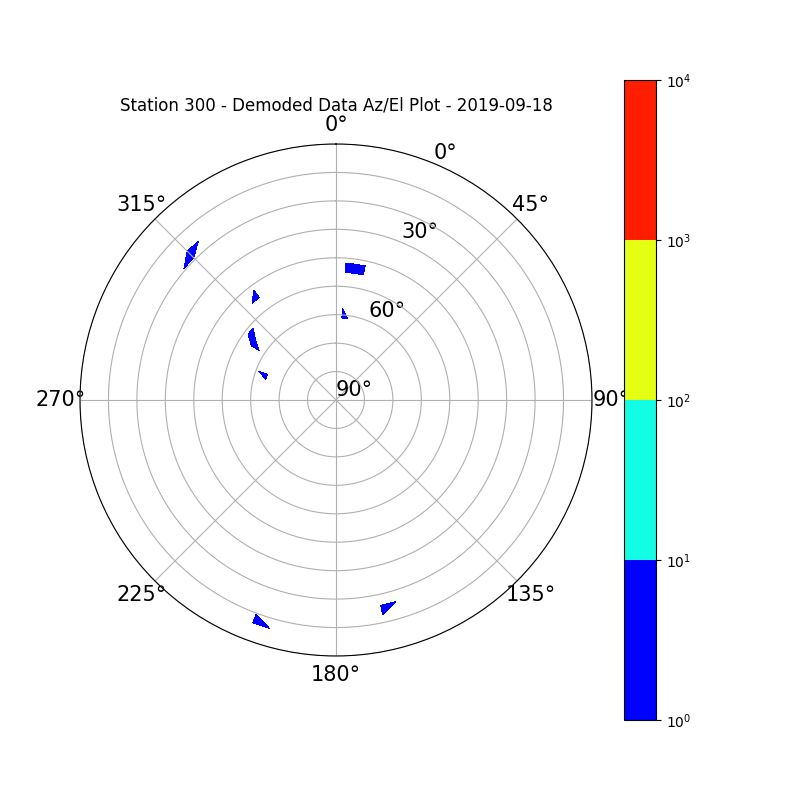
Station 300
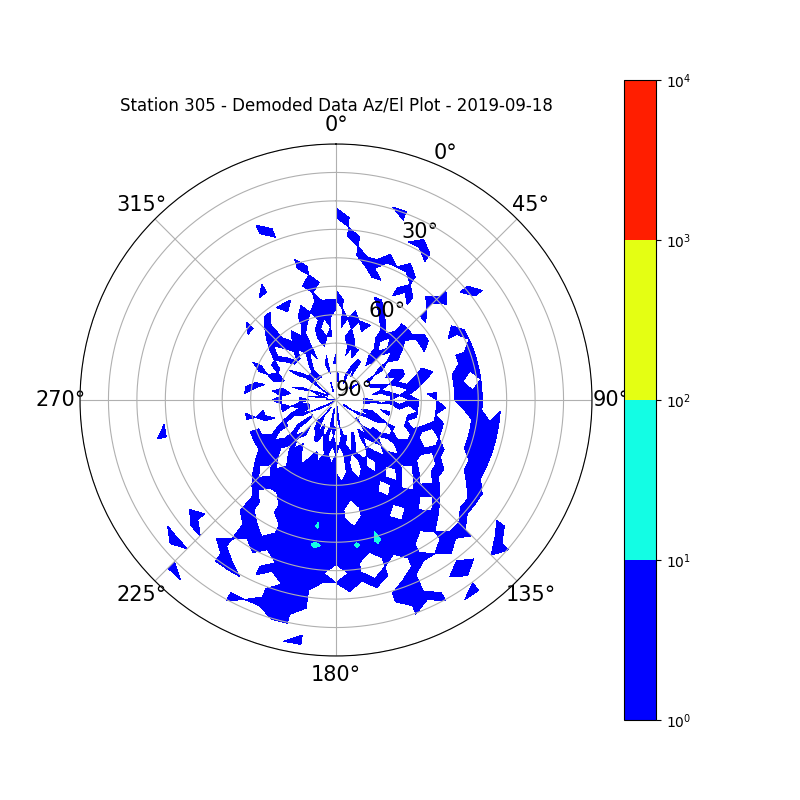
Station 305
Station 306

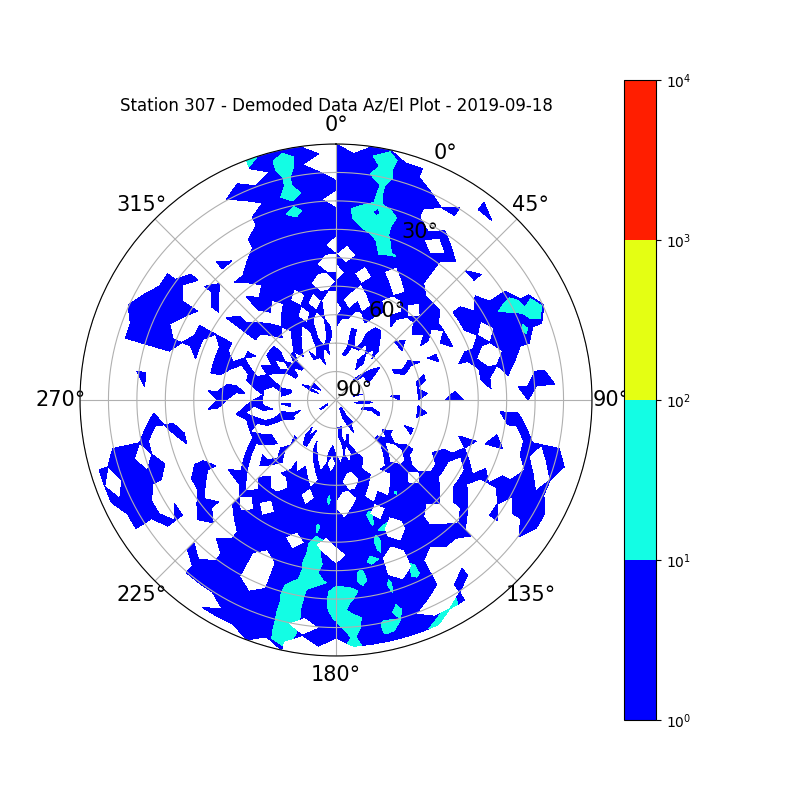
Station 307
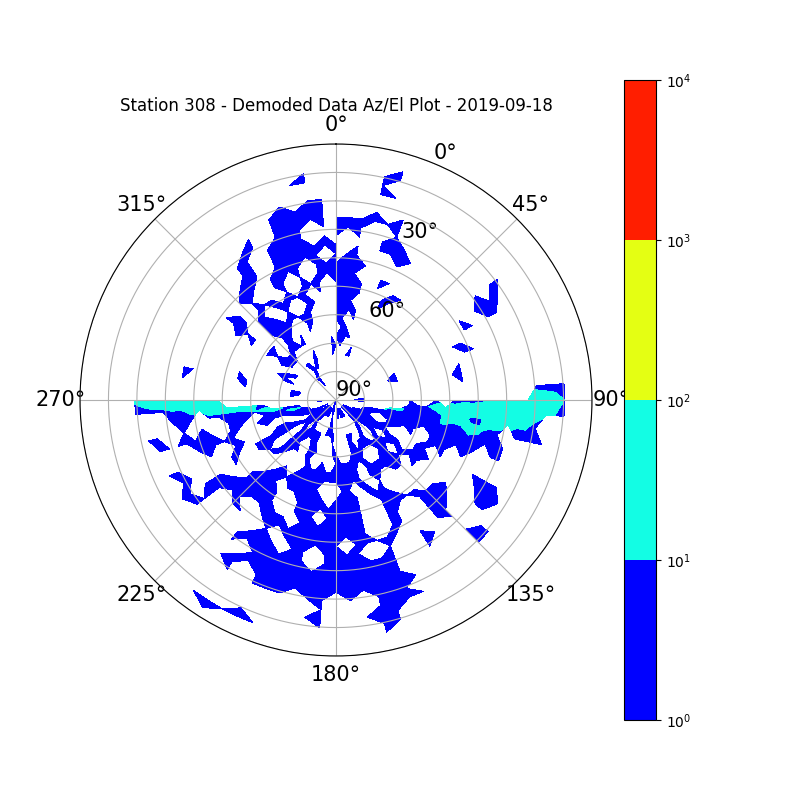
Station 308
Station 318

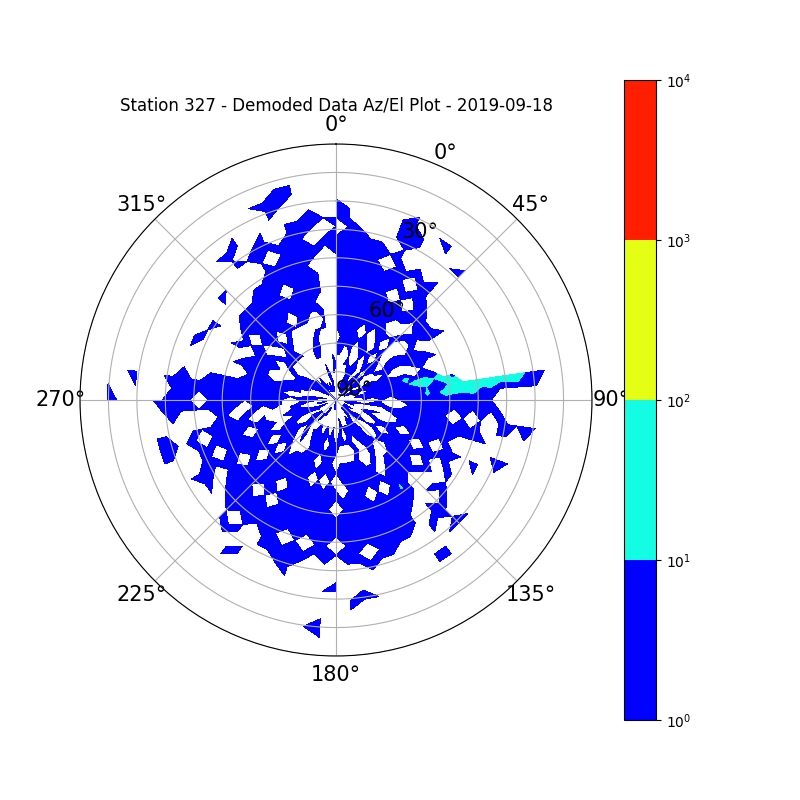
Station 327
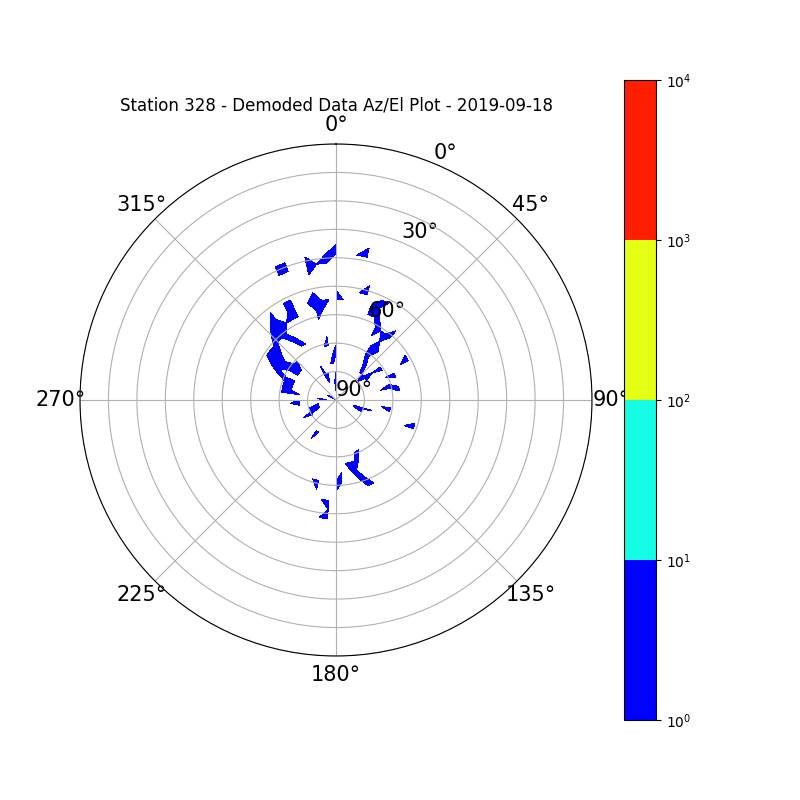
Station 328
Station 329

Station 330

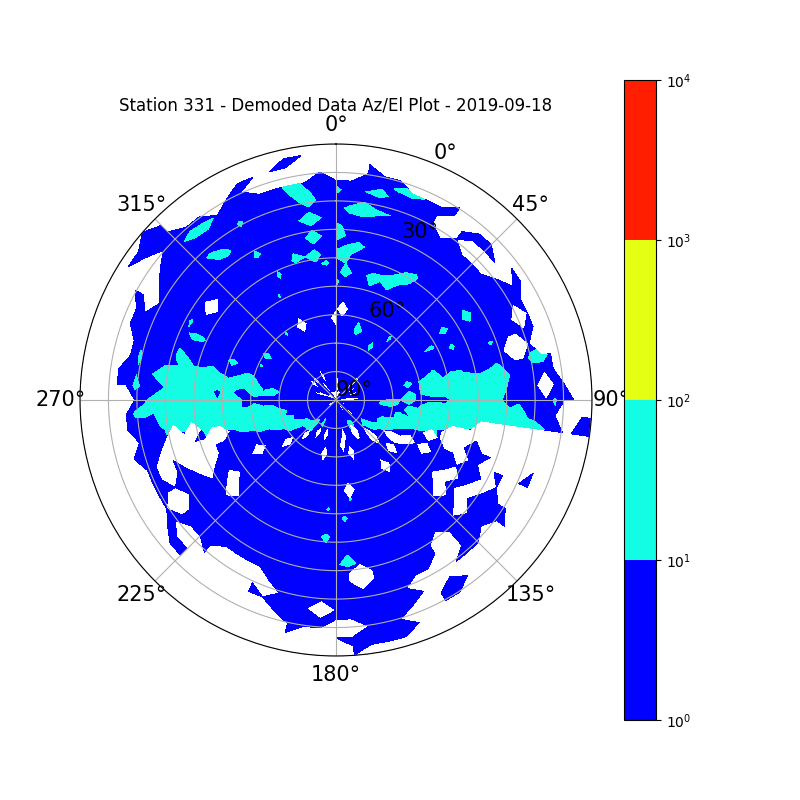
Station 331
Station 334
Station 335

Station 339

Station 342

Station 343
Station 347

Station 348

Station 351
Station 353

Station 355
Station 356
Station 359
Station 361
Station 365
Station 368
Station 376

Station 377
Station 380
Station 384
Station 385

Station 387
Station 399
Station 400
Station 404

Station 406
Station 411
Station 413
Station 418
Station 420

Station 423
Station 427
Station 430
Station 431
Station 438
Station 439

Station 440
Station 442
Station 444
Station 446

Station 447
Station 449
Station 451
Station 452
Station 458
Station 462

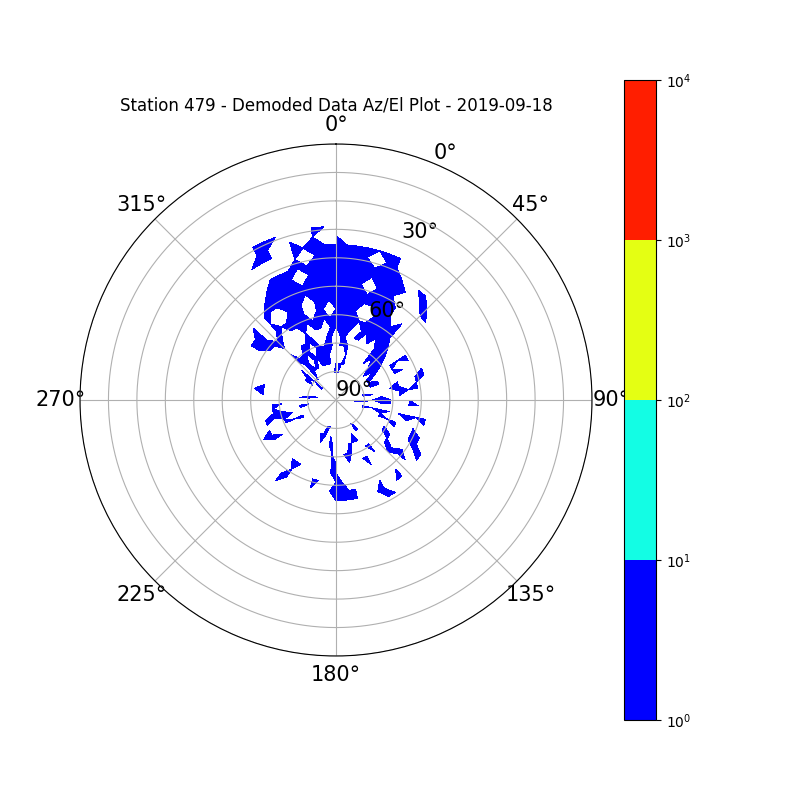
Station 479
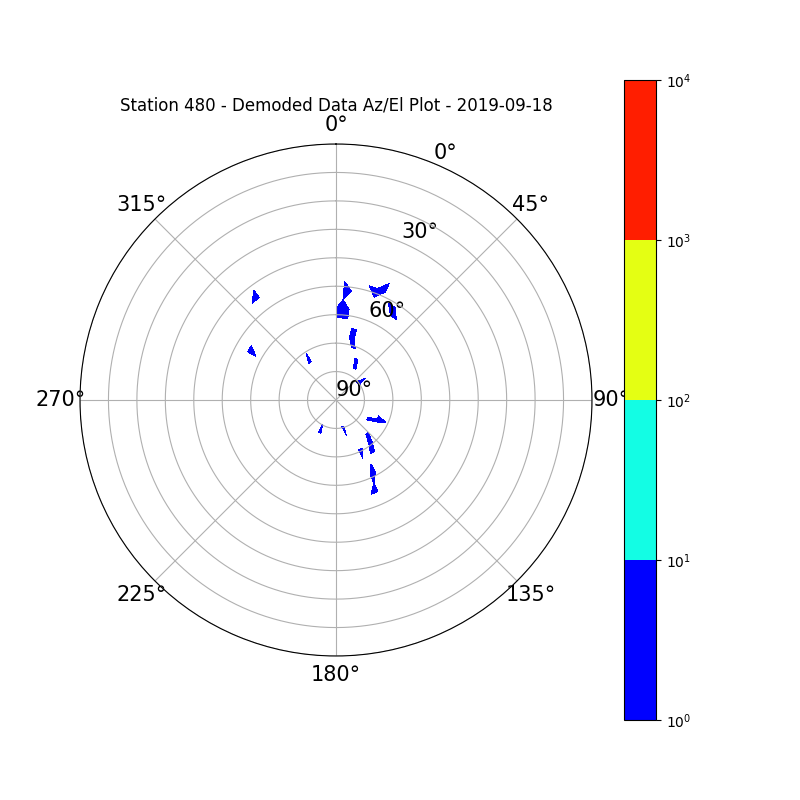
Station 480
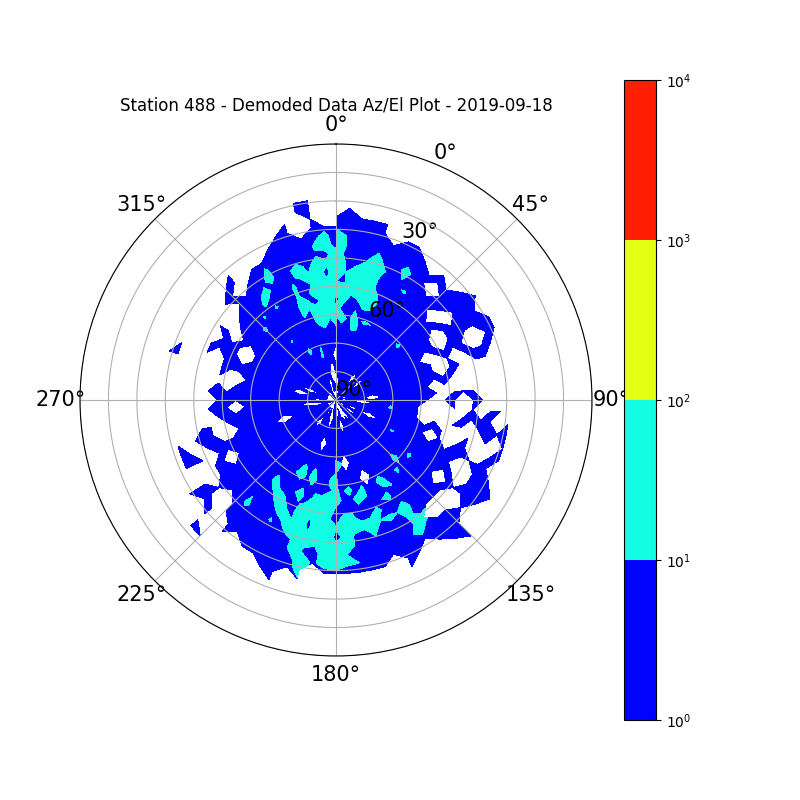
Station 488
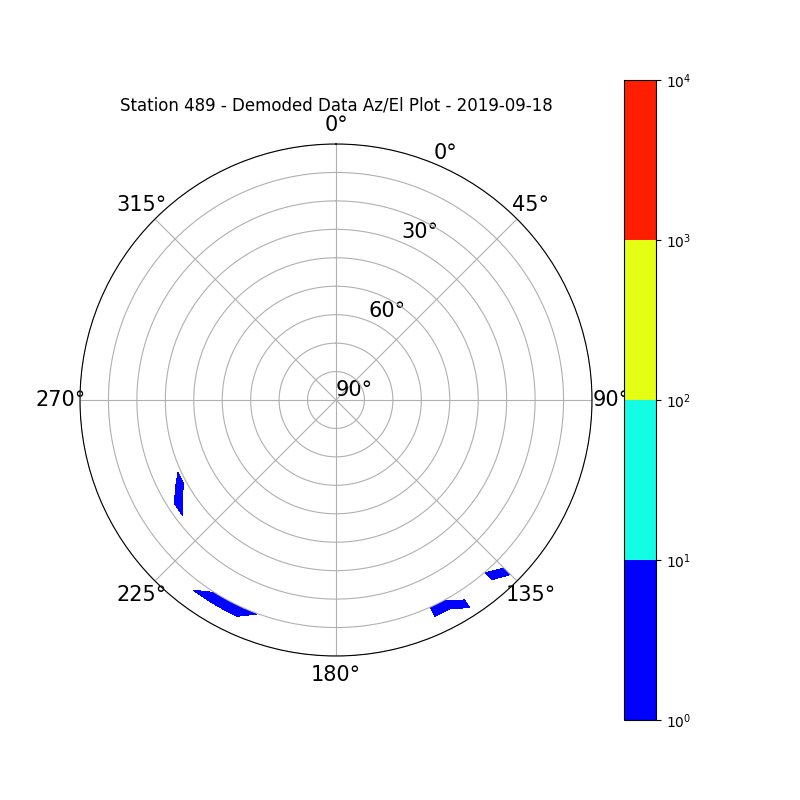
Station 489
Station 490
Station 492
Station 498
Station 499
Station 500
Station 509

Station 511

Station 512

Station 517

Station 519
Station 526

Station 531

Station 539

Station 540

Station 544
Station 546
Station 548
Station 551
Station 554

Station 555

Station 558
Station 567

Station 568
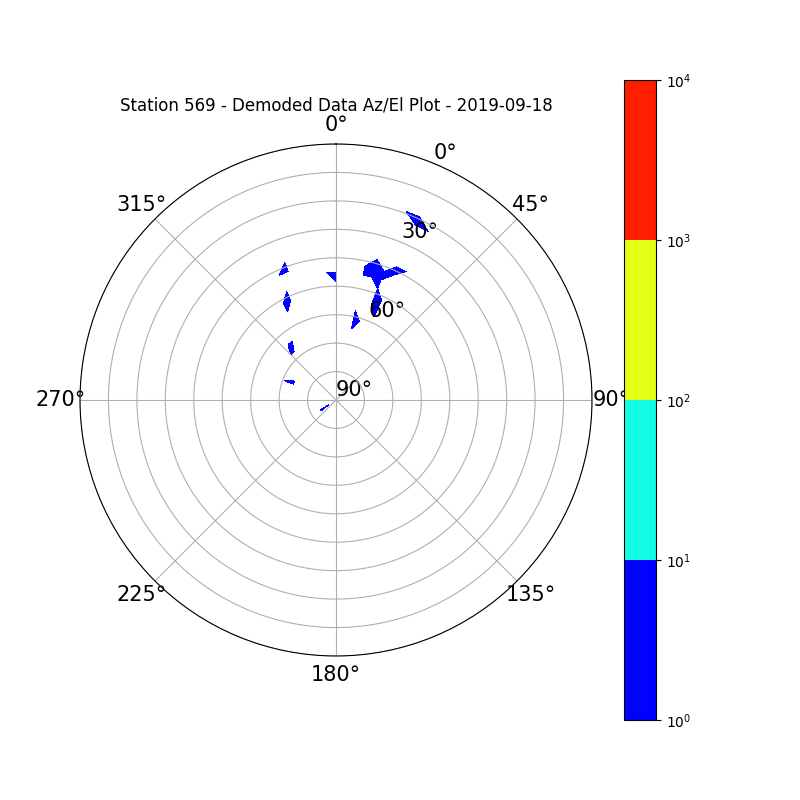
Station 569
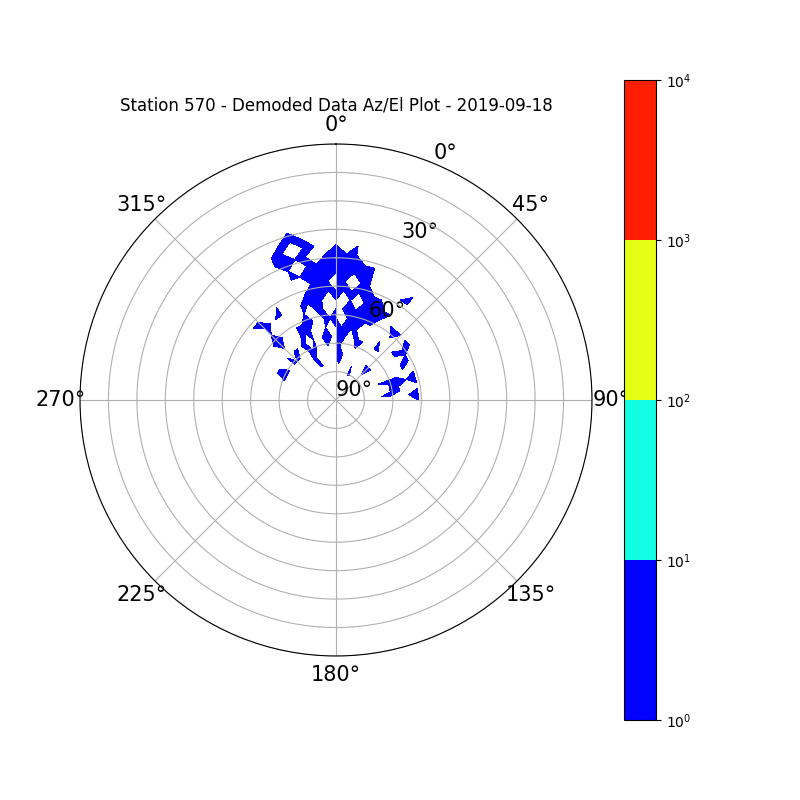
Station 570
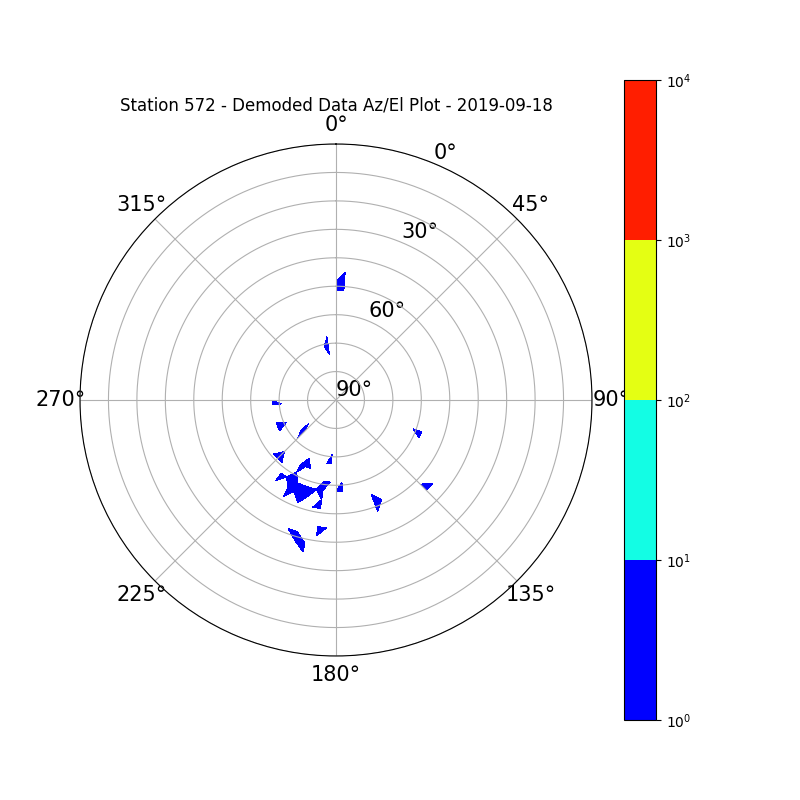
Station 572
Station 574

Station 579

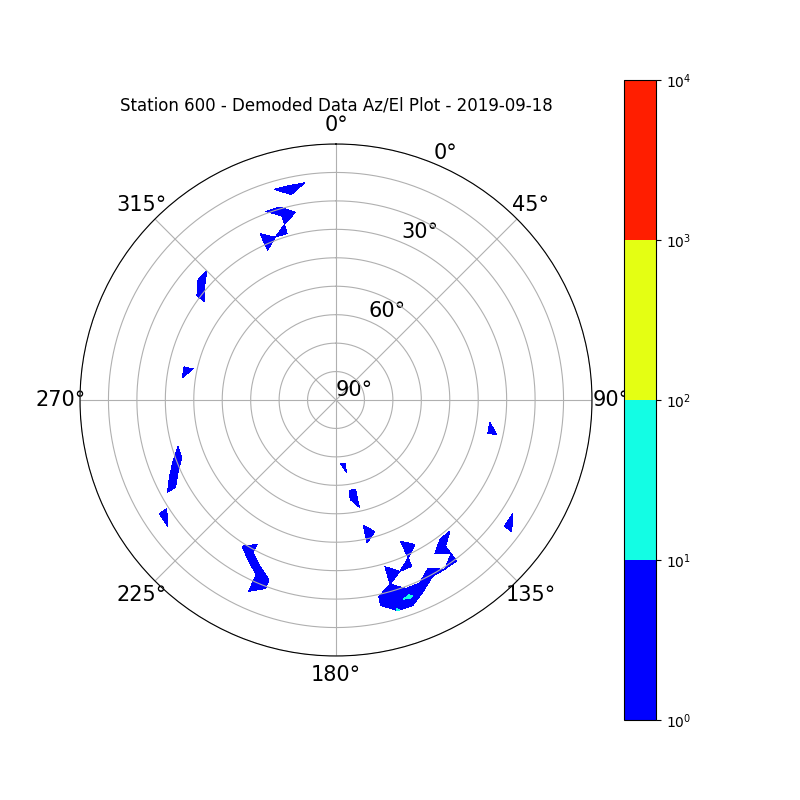
Station 600
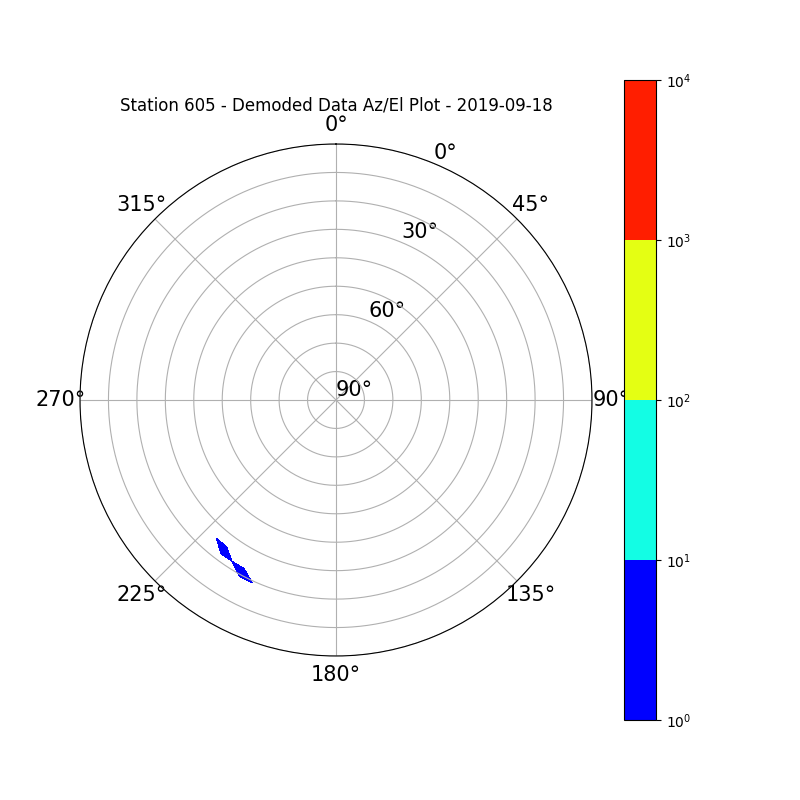
Station 605
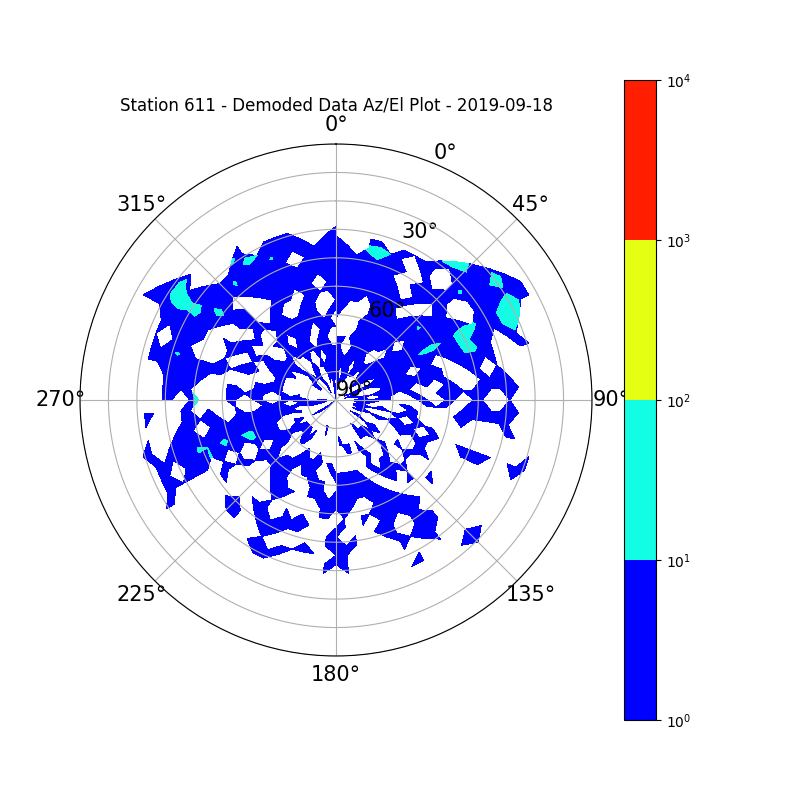
Station 611
Station 613

Station 617

Station 618

Station 619

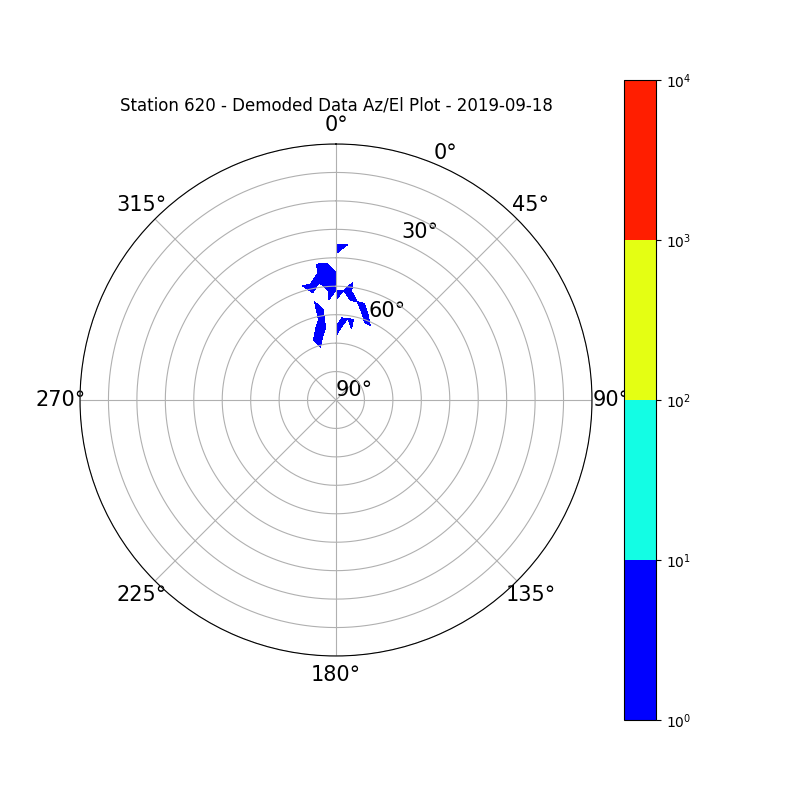
Station 620
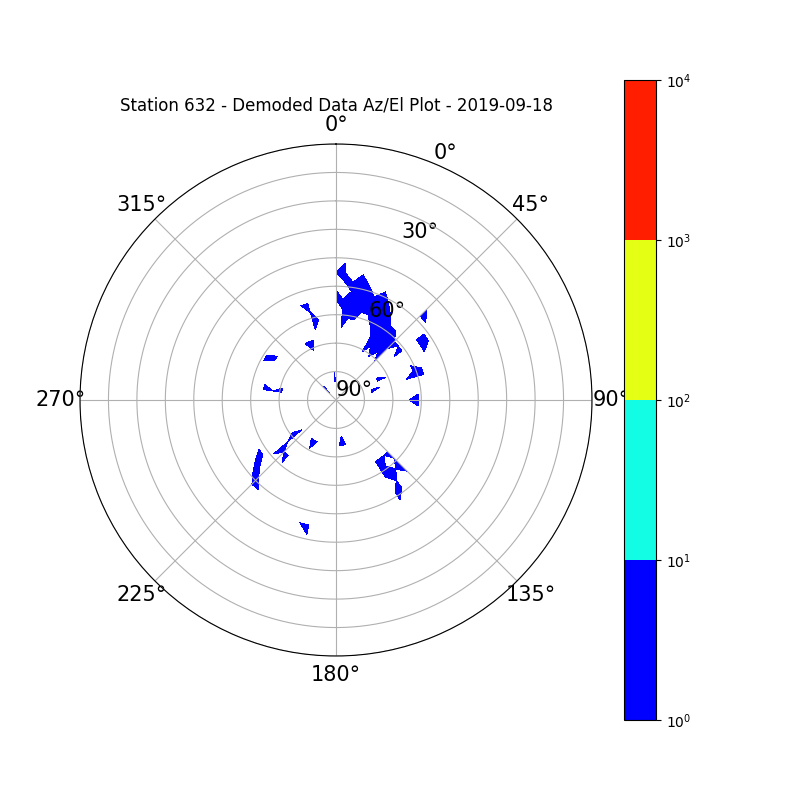
Station 632
Station 636

Station 642

Station 644
Station 645

Station 647
Station 655

Station 657
Station 663
Station 667
Station 669
Station 673
Station 674

Station 678

Station 692
Station 693

Station 702

Station 704
Station 706

Station 709

Station 711
Station 713
Station 715

Station 724
Station 727
Station 730
Station 731

Station 732
Station 733
Station 735

Station 737

Station 738

Station 749

Station 754
Station 760

Station 763

Station 766
Station 771
Station 772

Station 777

Station 780

Station 788
Station 796

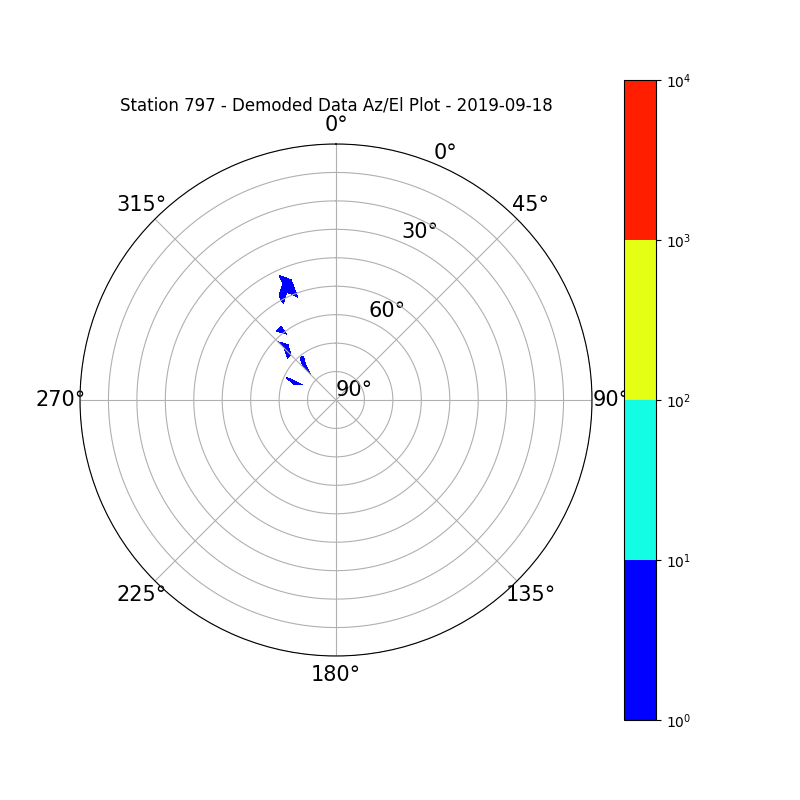
Station 797
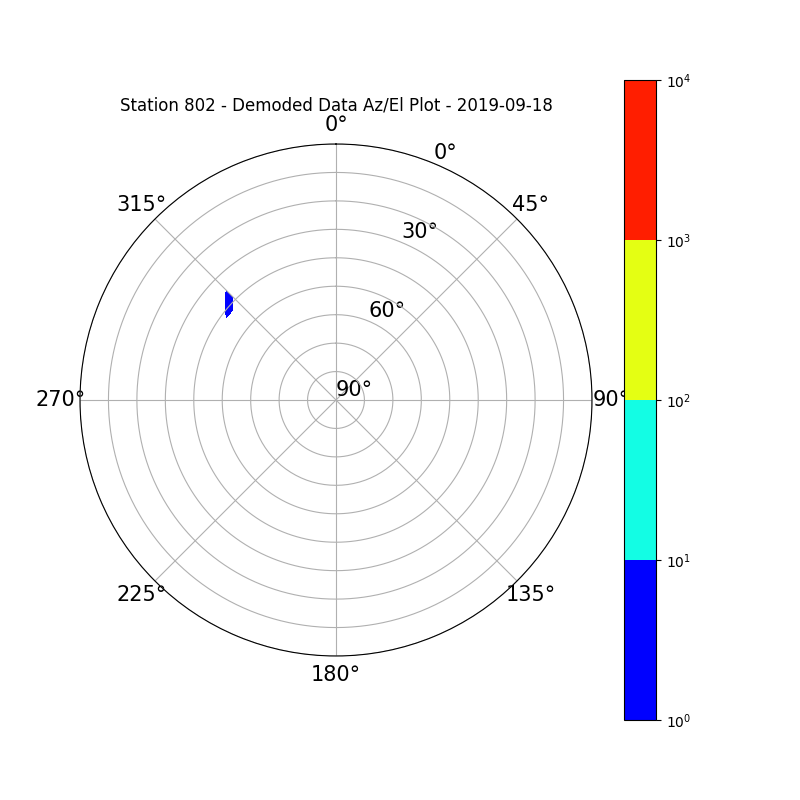
Station 802
Station 804

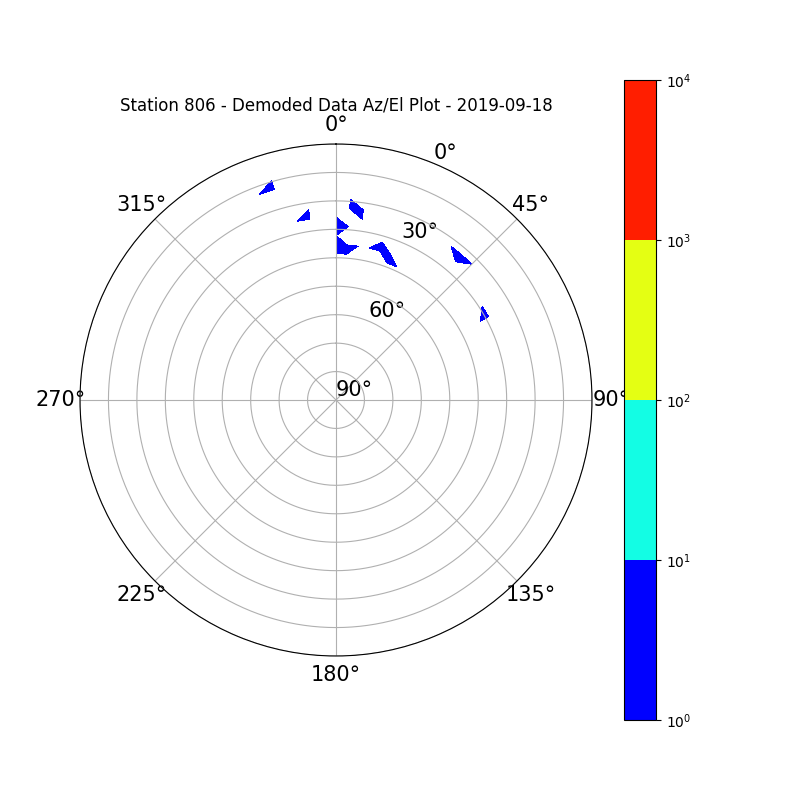
Station 806
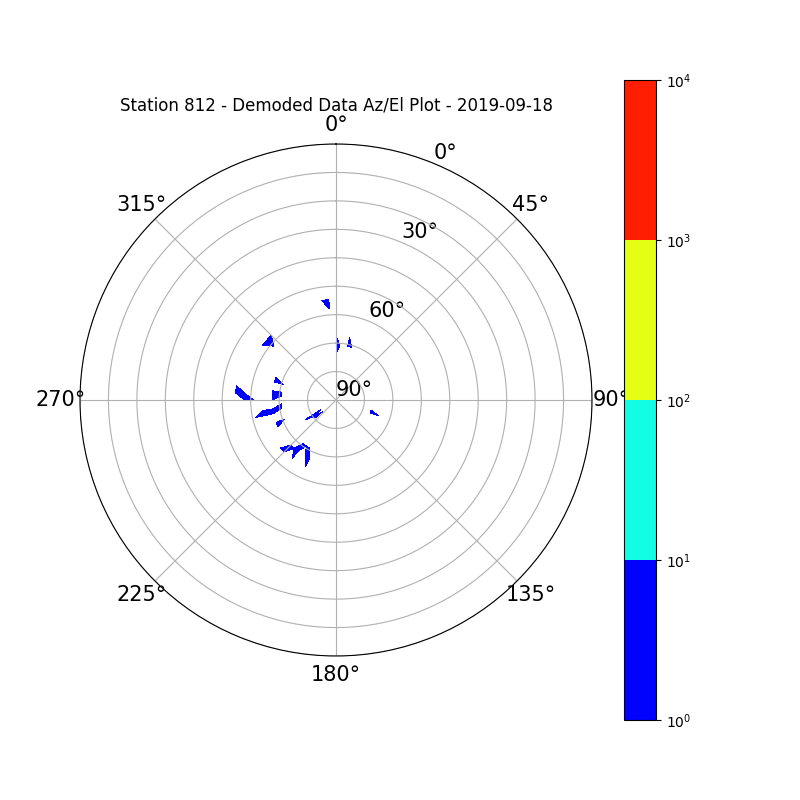
Station 812
Station 818

Station 819

Station 820

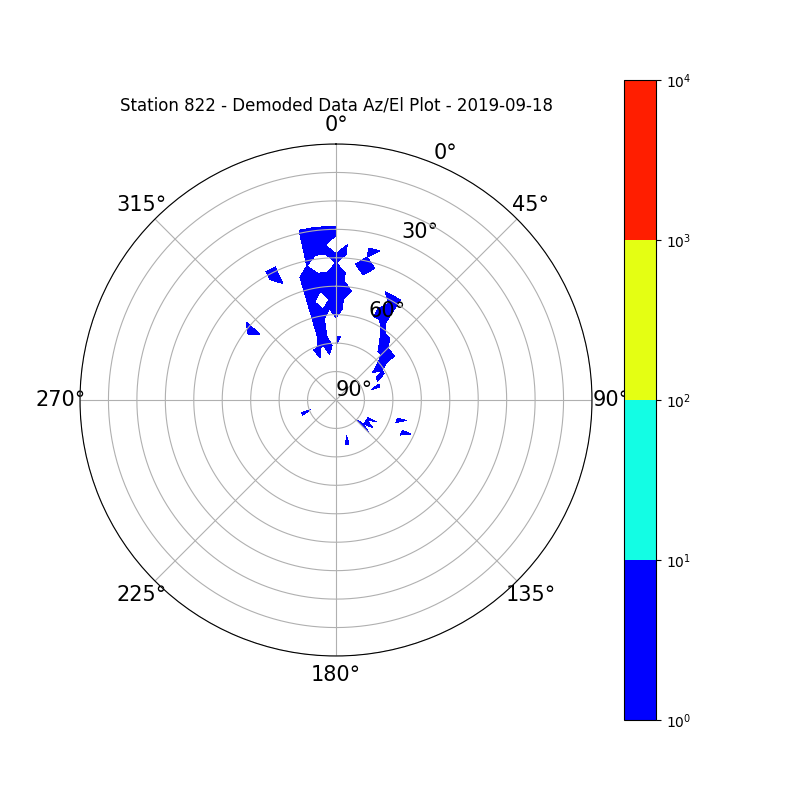
Station 822
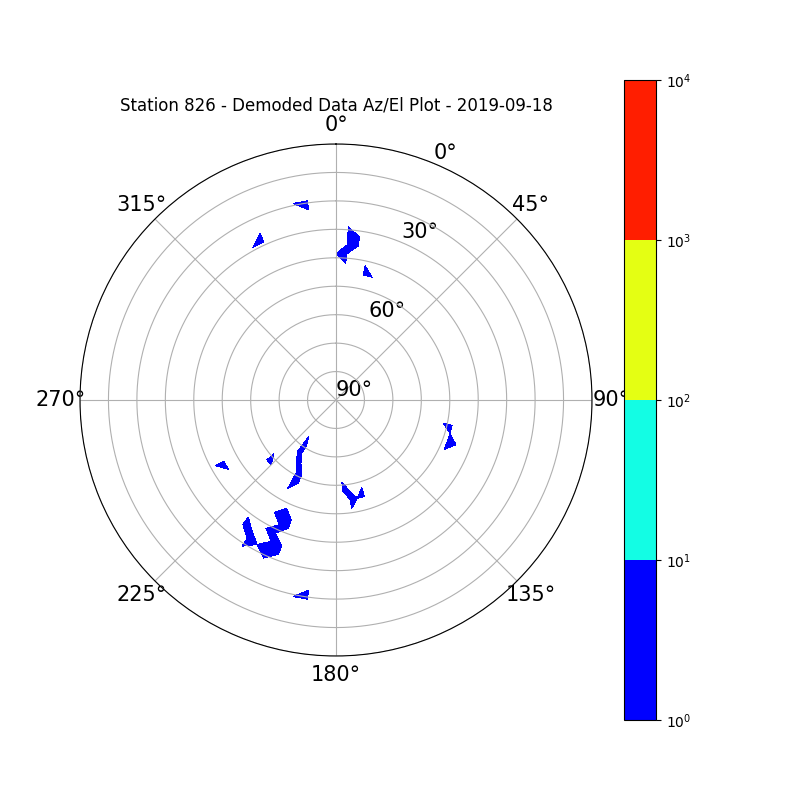
Station 826
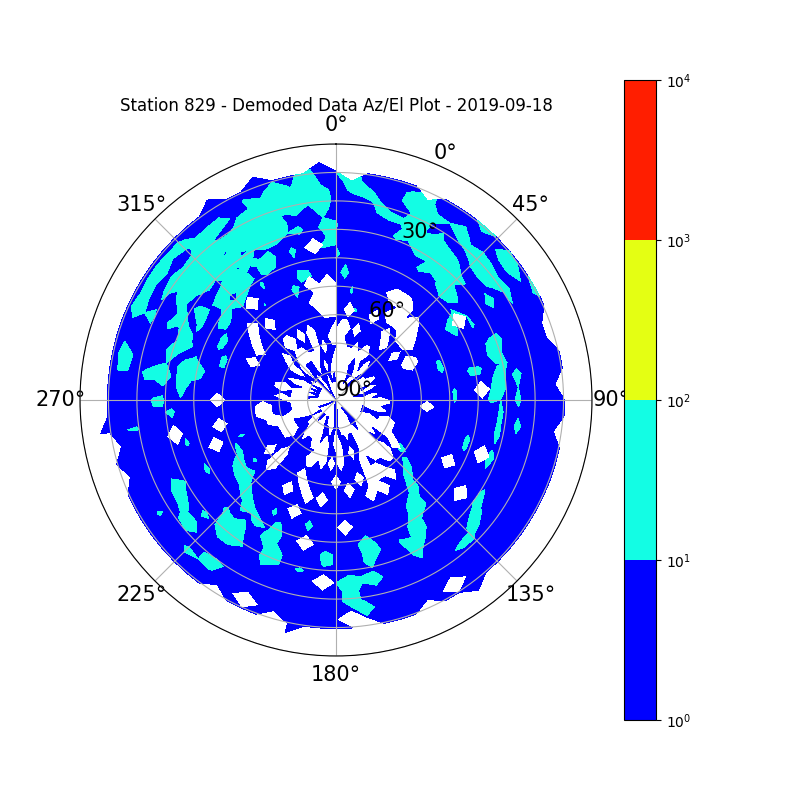
Station 829
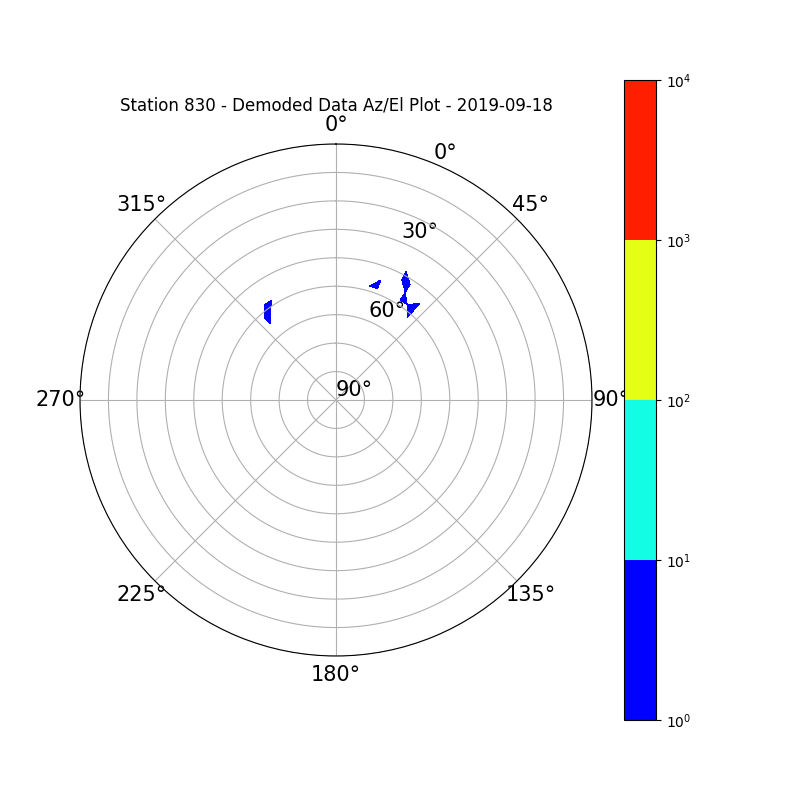
Station 830
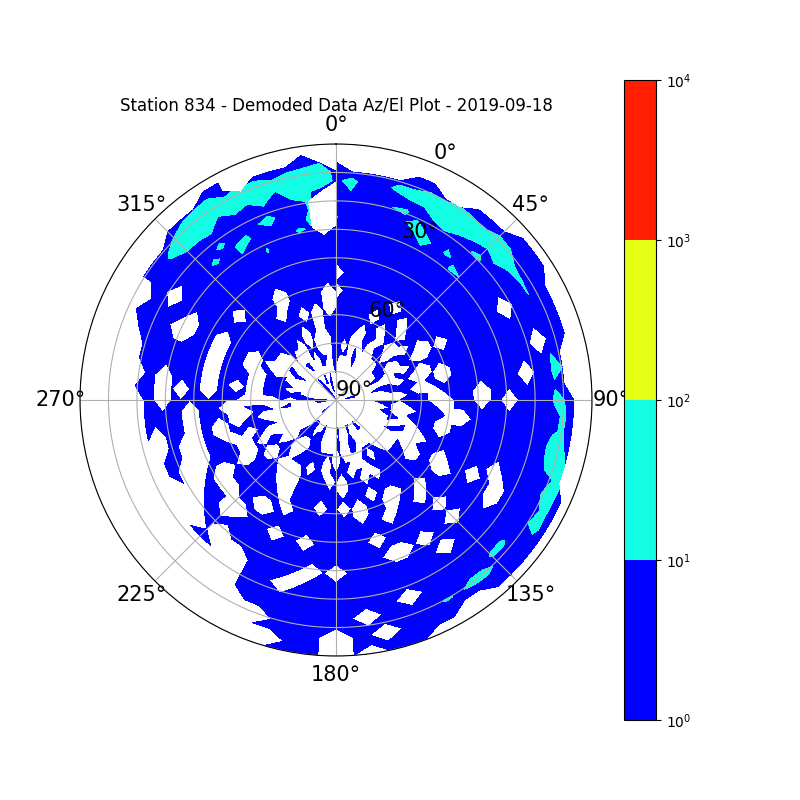
Station 834
Station 837

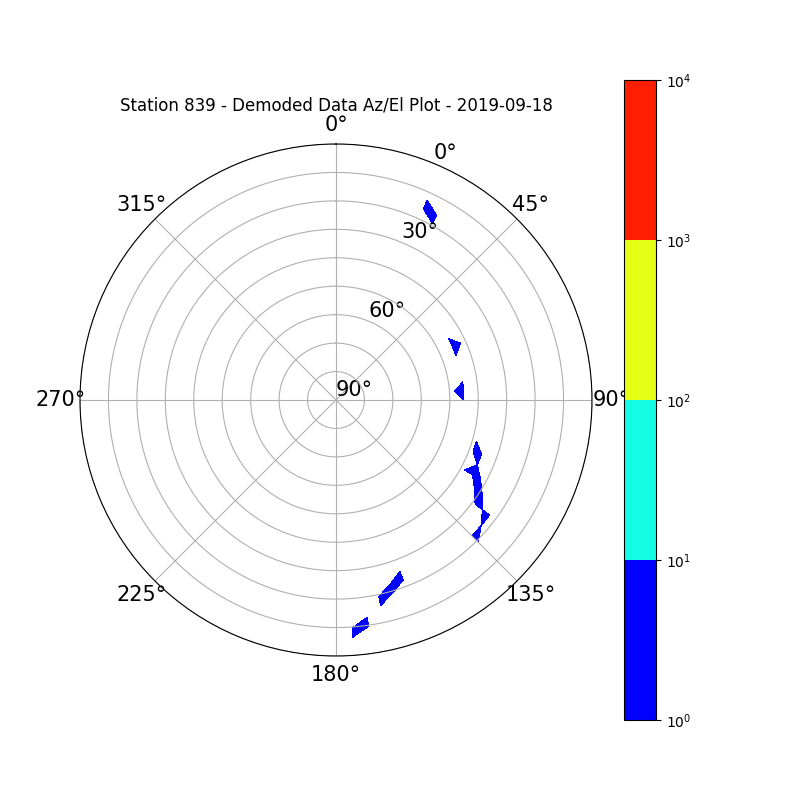
Station 839
Station 842

Station 845

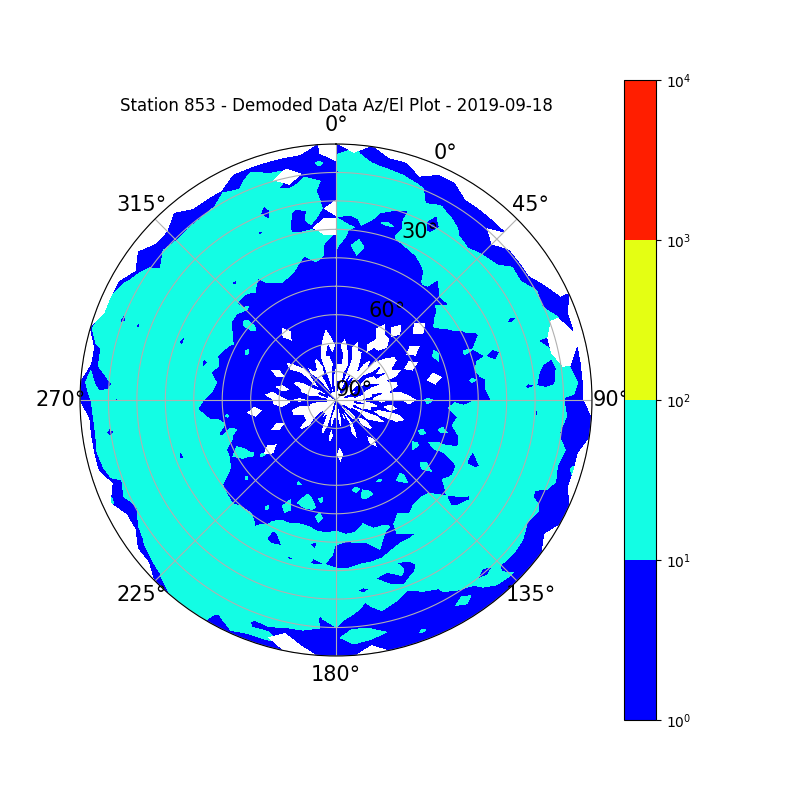
Station 853
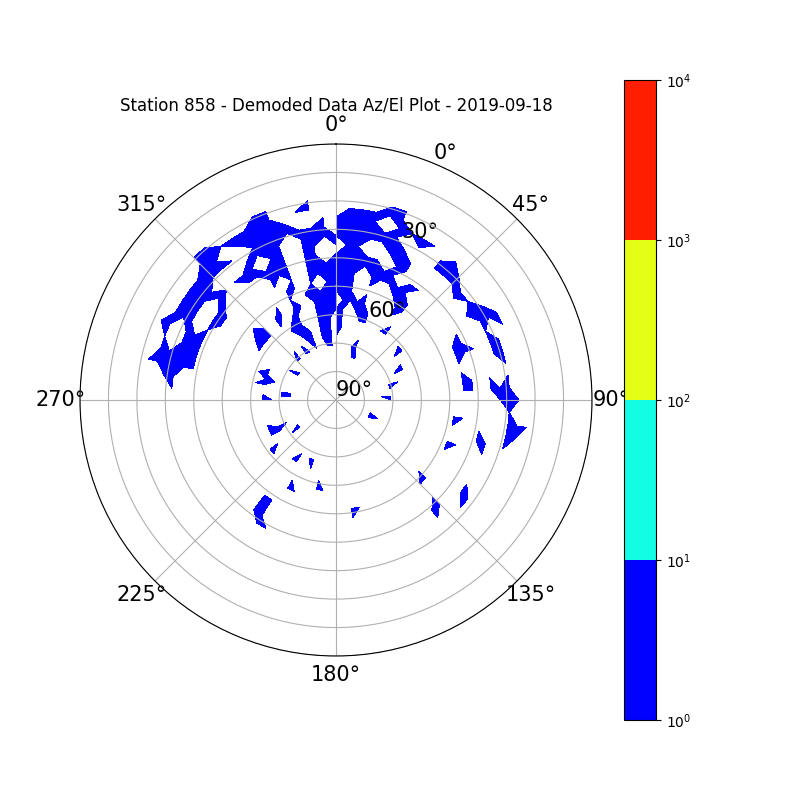
Station 858
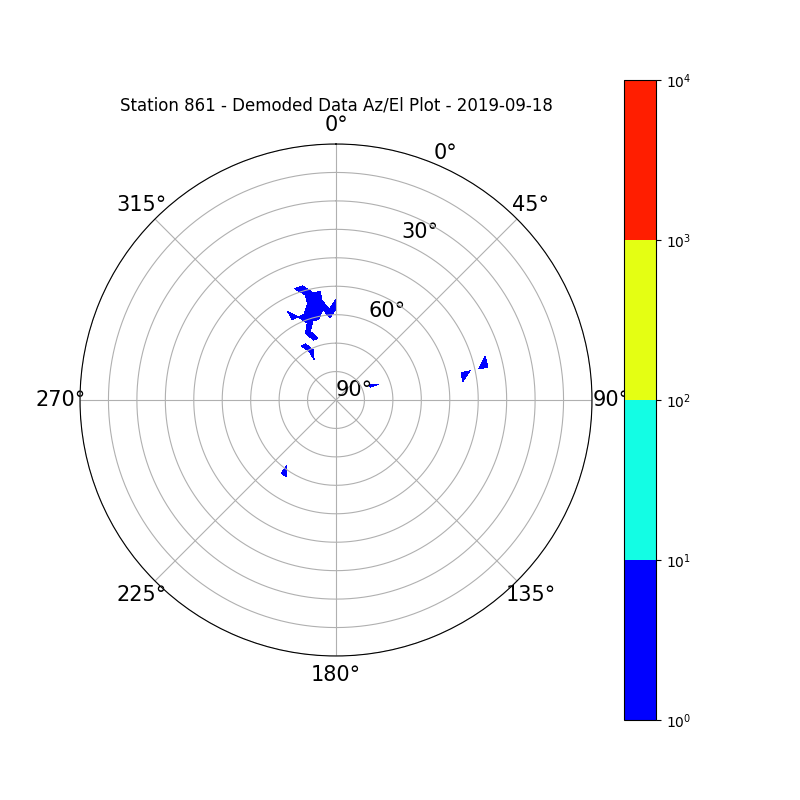
Station 861
Station 863

Station 866

Station 867

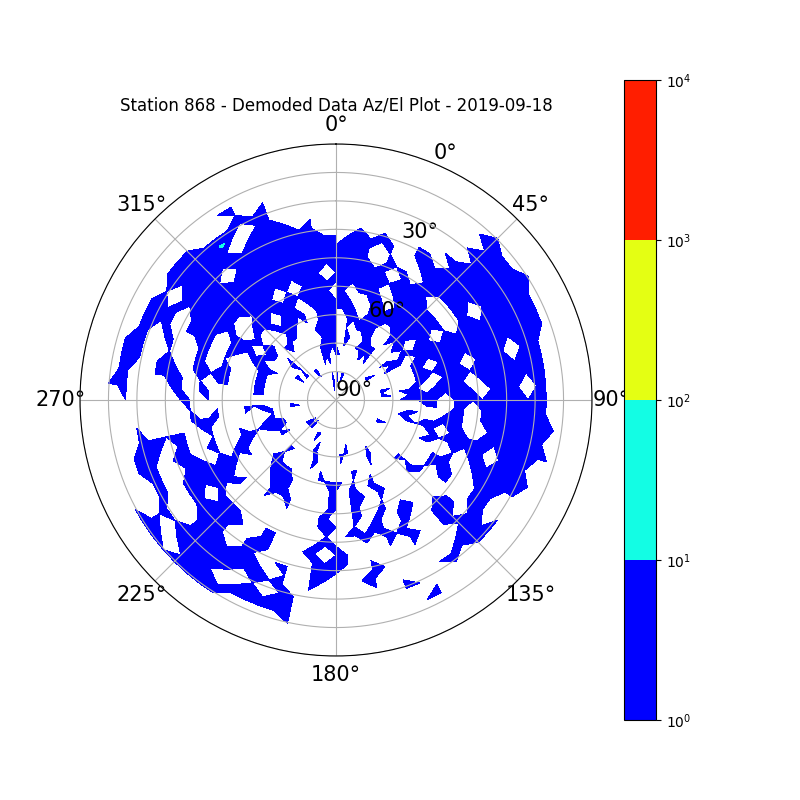
Station 868
Station 871

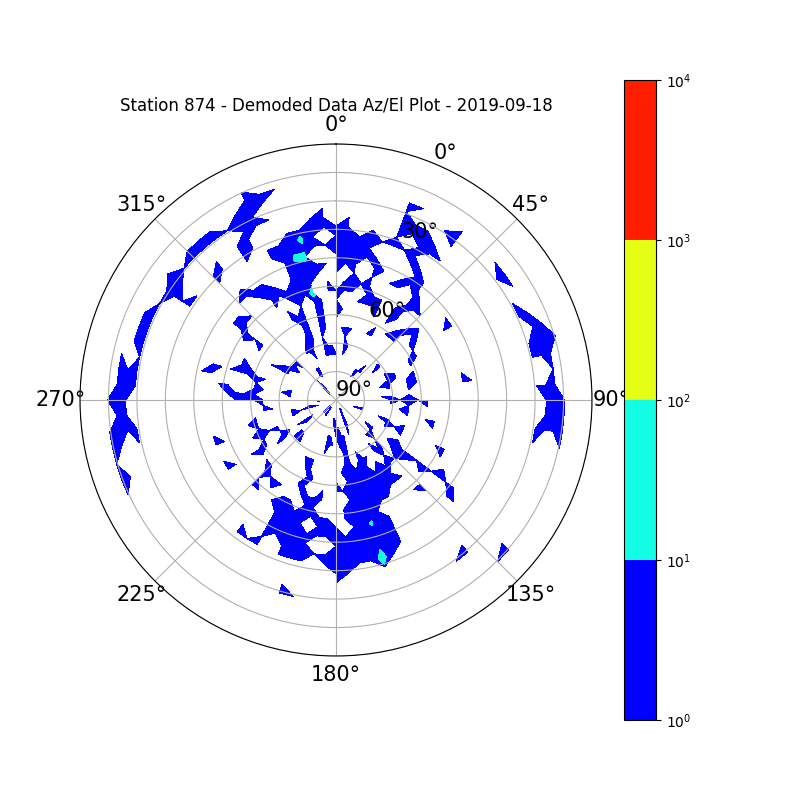
Station 874
Station 884

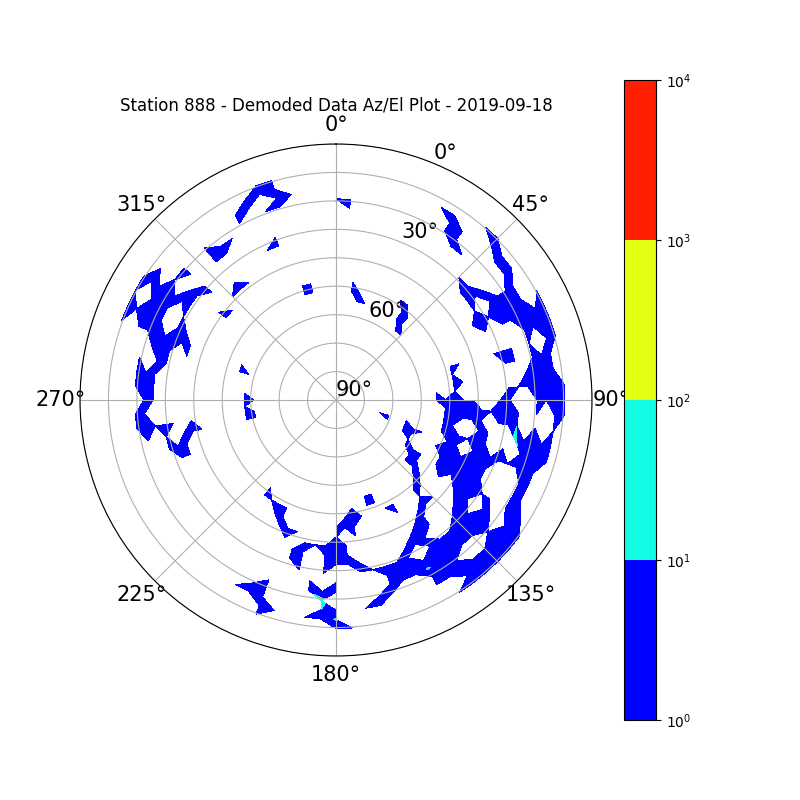
Station 888
Station 901
Station 905

Station 906

Station 908

Station 909
Station 913

Station 917
Station 918
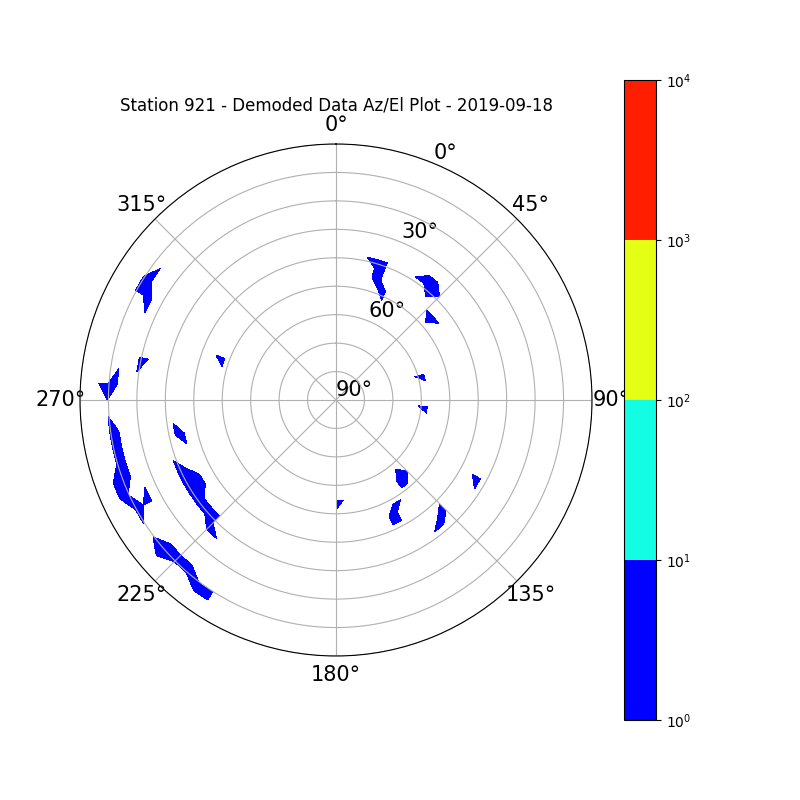
Station 921
Station 923

Station 927

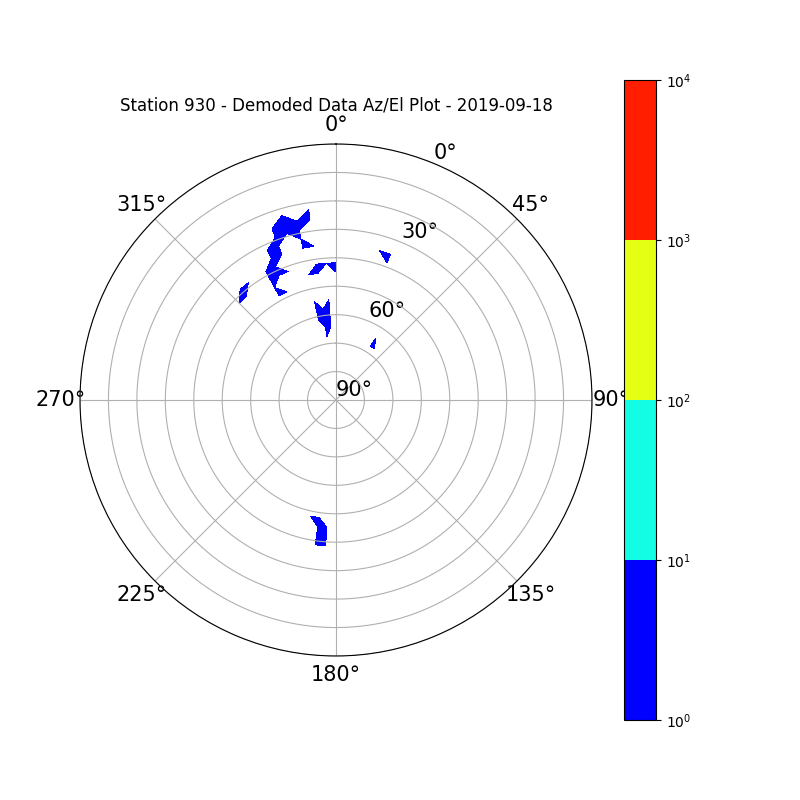
Station 930
Station 935

Station 939

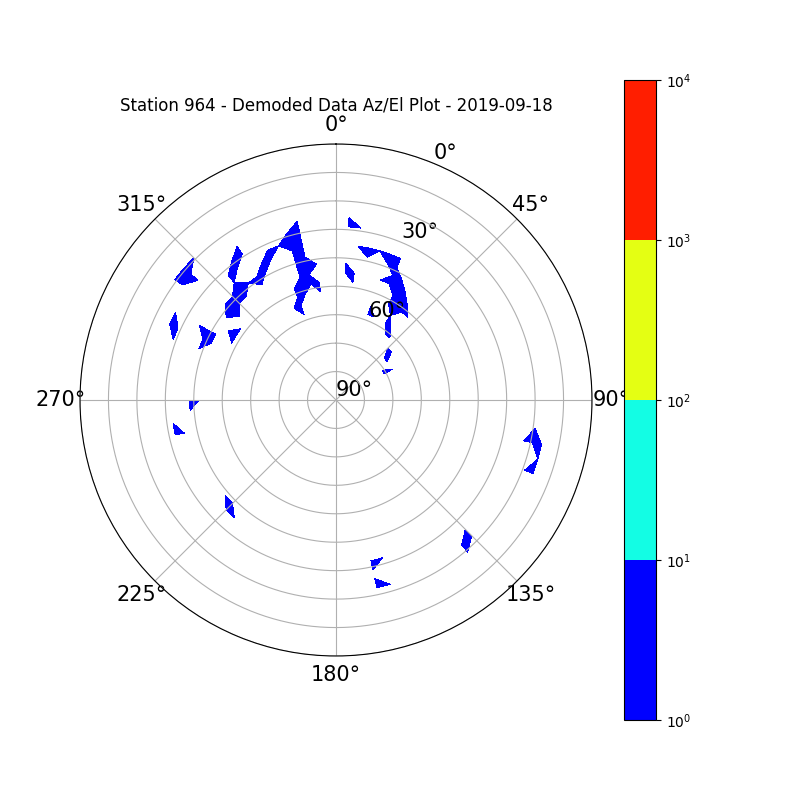
Station 964
Station 966

Station 969
Station 972
Station 977

Station 981