See also the following issue which tracks the corresponding feature request:
The first step listed there is the heavy part which is blocking right now.
Unfortunately it’s blocking for quite some time now, so I don’t expect it to be solved soon.
PS: @fredy: Thanks for the explanation on how the csv exports are created.
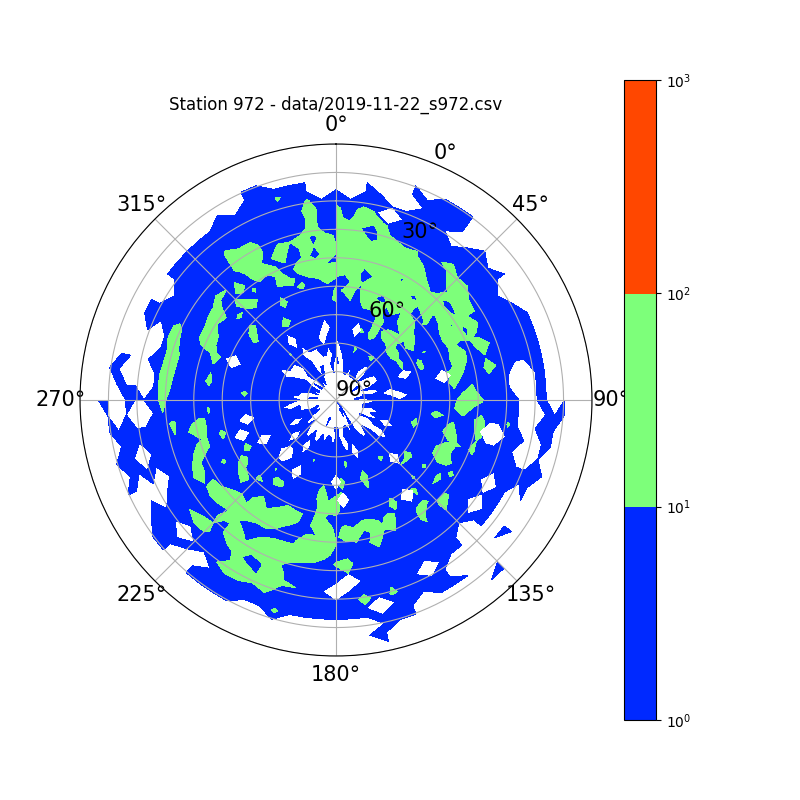
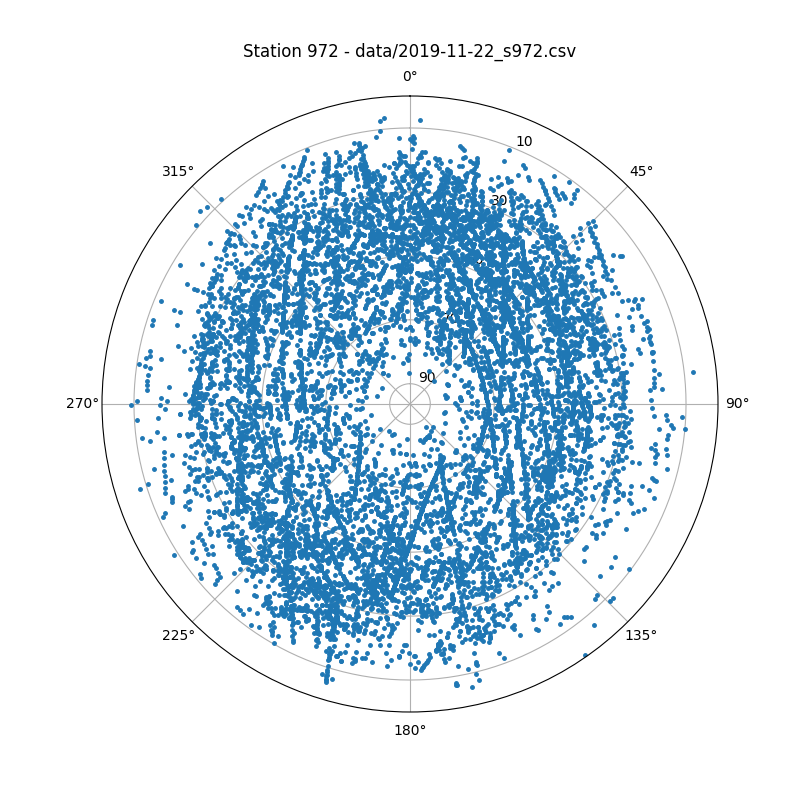
It’s not about lack of diversity, but bias. You need to account for sats coming from all sorts of directions at different rates (i.e. more satellites will pass over a certain direction over another). But that’s not the main issue, you can probably account for that to some extent with some work.
The primary concern is that each satellite has a different effective radiated power (ERP). The ERP is the product of the gain of the antenna (converted to linear units (not dBi or dBd)), multiplied by the input power of the on-board transmitter.
This is the primary factor that determines whether an RX system is capable of detecting a satellite transmission or not (assuming the RX system’s characteristics are fixed). Determining the ERP of each individual satellite is not only impossible (due to radiation patterns often not being publicly available, or even measured in many cases), but even if you had the radiation pattern, you would need to solve the ERP formula described above for every single direction in the horizontal coordinate system (every angle in the “Alt/Az sphere”) of the radiation pattern, which you wish was isotropic… Oh, and you would also need to account for the orientation of the satellite at each point of every pass so you know which “part” of the radiation pattern (of the on-board TX antenna) your RX antenna is being exposed to.
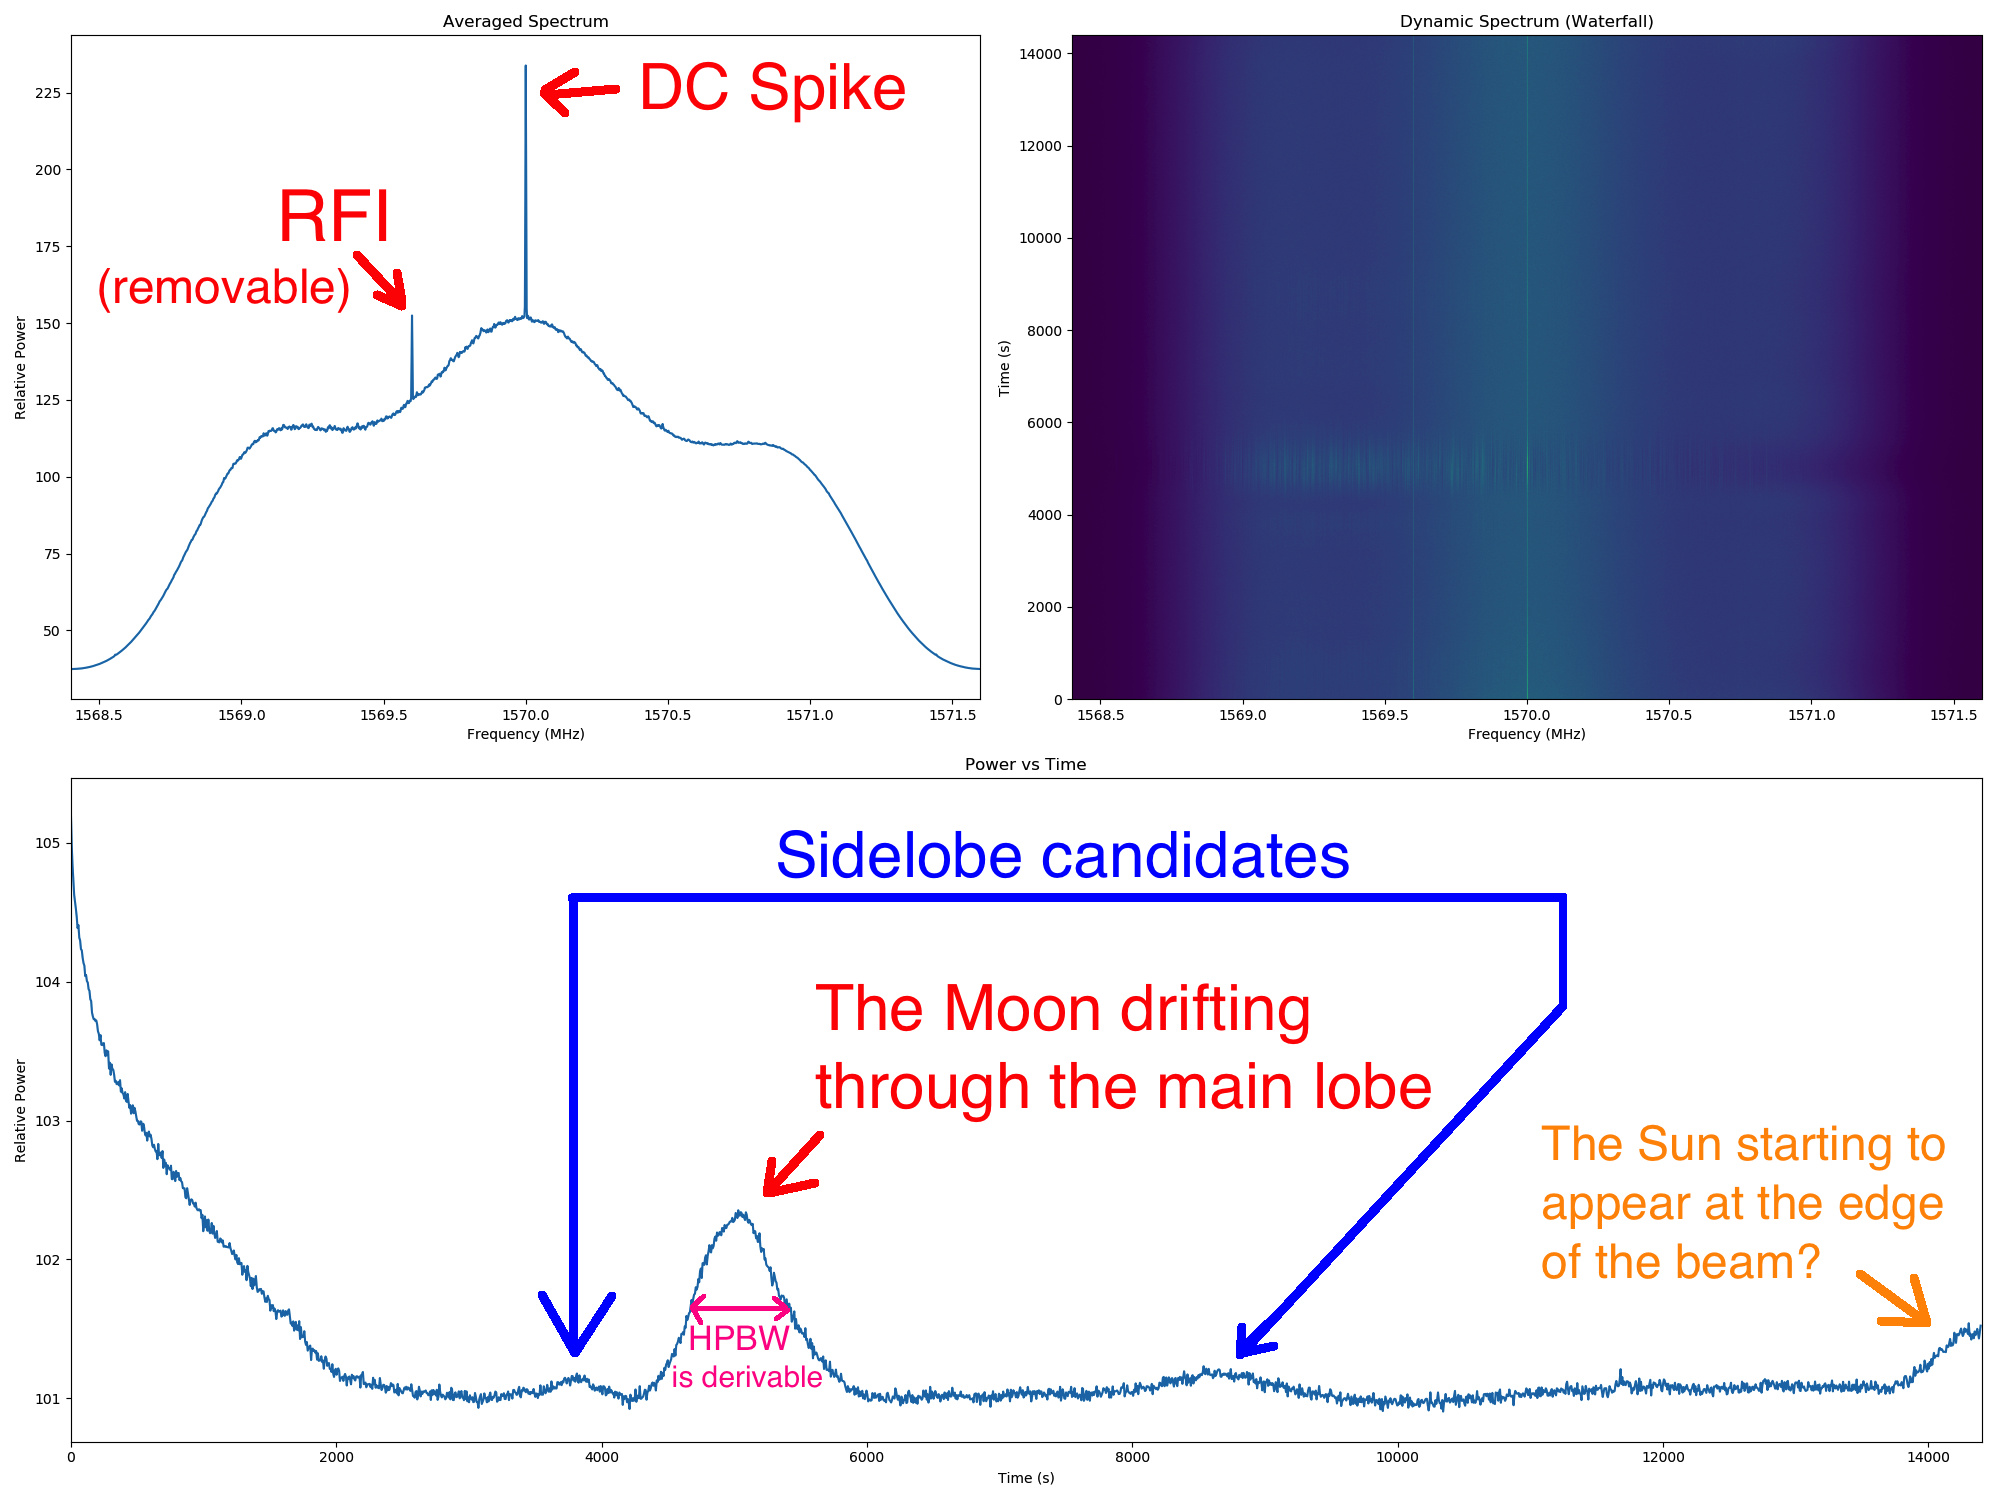
Should work at pretty much any radio frequency sats use for uplink/downlink. I had done a quick drift scan observation with a 3.2m dish a few months ago of the Sun, it’s really not that complicated (FFT → Average with respect to frequency channel → Look at time series (power vs time plot) → Conduct time series analysis if necessary (i.e. apply averages if integration time per FFT sample is too short)).
The full width at half maximum (FWHM) gives you the half-power beamwidth of your antenna and you may also spot antenna sidelobes if they’re not obscured by buildings etc. (i.e. have line-of-sight visibility with the Sun).