A common topic that comes up at hamfests and maker faires is when an educator comes to us and says “this would be great to have on our roof and in our classroom… How do we show the students what is going on and make it real for them?”
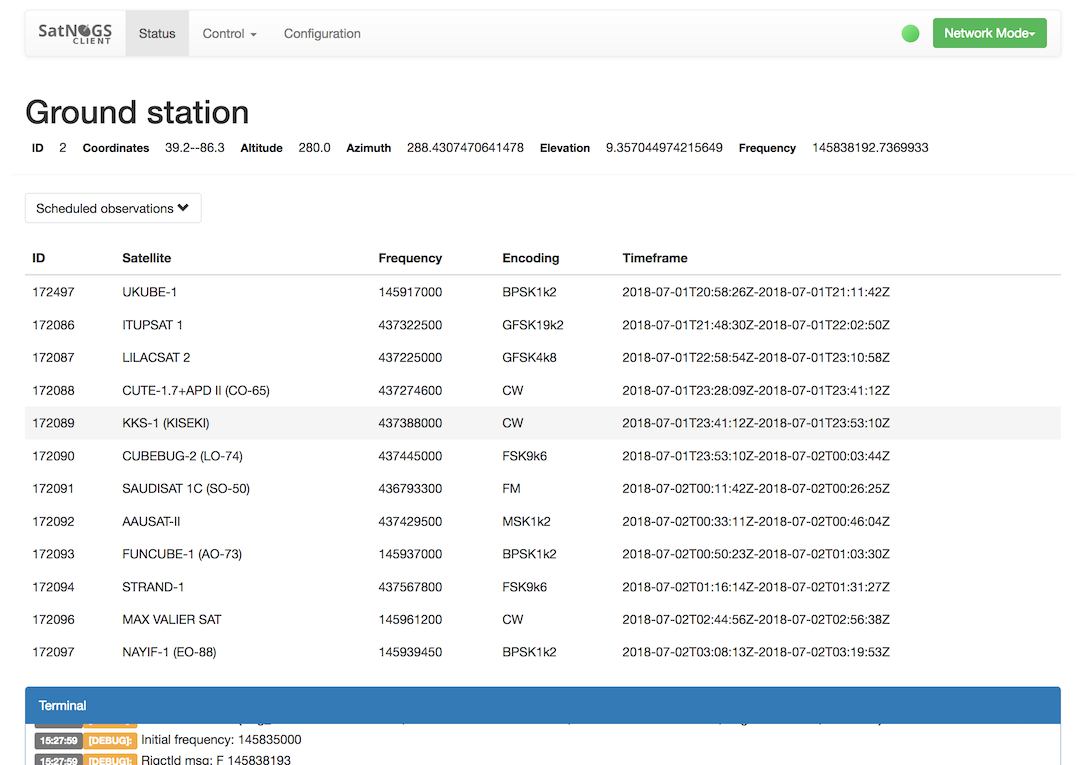
All we can offer today are 2 main views: the network observations page filtered for the ground station, and the ground station dashboard itself (see below).
The problem with the network view is that it requires manual refreshing of the page or opening observations that would be of interest to students. The problem with the dashboard is that it doesn’t show much detail that would be of interest to students (ie: results).
Here is the scenario I would like to kick off this thread with:
A K-12 school has a fixed station SatNOGS setup with antennas on the roof top, and outside of the science classroom is a glass display case with a monitor showing details of their SatNOGS station. What would that display show? Keep in mind this would need to be dynamically updated with no manual clicking or intervention - to keep it automated.
(further context: at least here in the US, this setup is common for seismographs and weather stations, where a school will host the hardware and as part of this setup there will be a display that shows current data being collected)
I’ll pause there and see what some of your ideas are!
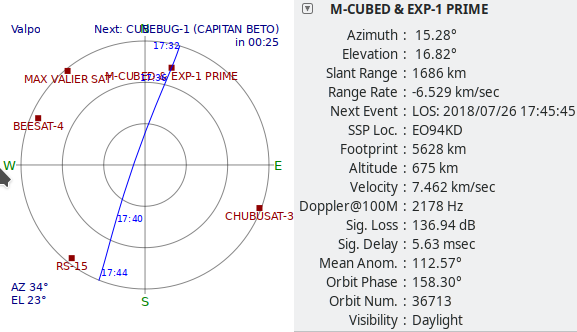
Plots with real time information are probably most informative, like a polar plot with cross hairs on the satellite that is being tracked, or a plot of frequency against time showing where and when which satellites transmit.
Getting updated waterfall plots during the observation, at say, 1 minute intervals, would also be great, and might actually be possible on RPi3’s, as I’ve done this manually a few times.
The longer term plan is for my GS to be located at the local school so I am definitely interested in this. @danwhite’s map is excatly what I had imagined the satellite looking down to look like. It would be equally nice to see what is floating around bove the GS. Same look just looking up from the GS rather than down from the sat.
I had a plan to use a display and RPi Zero W to display the upcoming observations on the GS using a little python script as a means to introduce students to the Pi and SatNOGS. Frankly I’ve run out of coding talent very quickly (I’m a bit more at home with large bits of steel) so it’s going to take me a while. But it’s fun thing for me to try and do. I also had a kit left over from a schools project.
I do think there should be some kind of interaction otherwise there might be a tendency to look at it while it is new but ignore it unless a crisis happens
Here’s some brainstorm ideas on what a display would have.
A live polar plot of overhead satellites similar to Gpredict in Autotrack mode which shows:
All sats known to be overhead.
Track of the currently tracked satellite.
Panel showing metadata about the current transmitter being received. Modulation / coding format, frequency, current doppler.
Panel showing a live receiver waterfall. My CLI side says just to tail -f the waterfall file. I like the approach András Retzler (HA7ILM) took with OpenWebRX by encoding the spectrum lines with ADPCM (an old but lightweight audio codec) before sending over the network.
Panel with live webcam attached to the rotator, aimed down the antenna’s boresight. It would be neat especially during the twilight hours to catch sunlight glints. Or the flashes of EQUiSat. I remember seeing a video where the ISS was visible to the rotator camera during an ARISS contact.
Stats such as observation time per running day / week / month. # of sats received in the last N days. Load average style of percentage of time in RX mode.
Configured as widgets, the operator could choose the panels to display. There could be a mode which cycles the widgets to keep the display more active.
This is a really good opportunity to ‘push’ SatNOGS to schools and to engage with STEM (Science, Technology, Engineering & Maths). I have done a little bit with schools over the past year and some of the SatNOGS stuff is just too complicated for younger kids <11yrs old (UK primary schools) but there are a surprising number of resources sitting idle in various secondary schools (>11yrs old) like good quality 3d printers and laser cutters. It’d be great to get one into a school.
I think that this years first lego league is about space (I’ve just had the one email calling for volunteers). An ideal opportunity to sneak something extra in
I’d like to recommend the scope of the conversation about STEM ed in schools incorporate libraries as well! We’re hoping to support community engagement with space sciences beyond K-12 and have ideas for using SatNOGs to teach data literacy skills.
I have sort of been working on my own dashboard and decided I would develop it with sharing in mind to allow other stations to leaverage my dashboard thingy.
This is almost perfect for simple dashboard (in my opinion as a world expert, of course ) . The only thing I would suggest is that there is a way of identifying the ‘home’ ground station (i.e. GS33 for me) and to indicate which is the next scheduled observation (sat, tx, time etc) in some kind of text at the bottom for example and highlight that at as it approaches the GS.
Well this is part of my project to try and re-create the https://eyes.nasa.gov/dsn/dsn.html for satnogs
But yea I could make a url arg to say what your home ground station is to display that information.

 ) . The only thing I would suggest is that there is a way of identifying the ‘home’ ground station (i.e. GS33 for me) and to indicate which is the next scheduled observation (sat, tx, time etc) in some kind of text at the bottom for example and highlight that at as it approaches the GS.