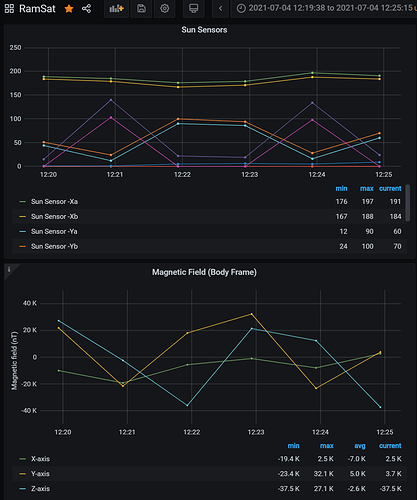
June '21 - The RamSat beacon telemetry has enough information in it to make some educated guesses about how the satellite is oriented with respect to both the solar direction and the local magnetic field vector. With a series of telemetry beacons on one-minute intervals it should be possible to discern orientation and tumble rate, as long as the tumble is not too fast.
Observation 4319939 captured ten consecutive beacon messages as RamSat passed over western Slovakia early in the morning of 26 June. Several lines of evidence from telemetry data during that period suggest that RamSat was tumbling about its X-axis at a rate of about one rotation every two minutes, with its -X face aligned mostly (but not entirely) orthogonal to the solar direction. The -X face is one of the long sides of the 2U body, visible as the left face in the image on the RamSat SatNOGS DB page.
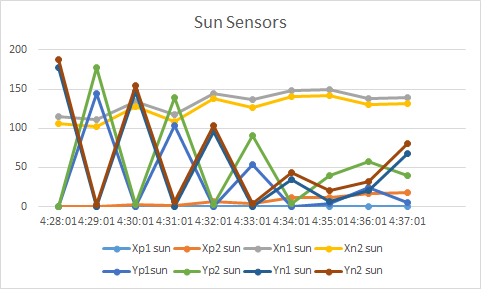
The first line of evidence for this conclusion comes from the sun sensor data. RamSat has a coarse sun sensor on each of the long faces (+X, -X, +Y, and -Y). Ground testing showed that the sensors respond nearly as a cosine zenith angle, with peak readings around 300 after A/D conversion. For redundancy each signal is processed in parallel by two op amp circuits, and for now at least the two op amps on each sensor are returning similar voltages. The graph below shows the the two readings for -X sensor (Xn1sun and Xn2sun) are relatively high and steady, while the two readings for the +X sensor (Xp1sun and Xp2sun) are near zero and steady. The +Y and -Y readings, on the other hand, go through clear oscillations on about a 2-minute cycle. First the -Y sensor reads high while the +Y sensor reads low, then a minute later the readings are reversed. Assuming that the tumble rate is quite constant through the measurement periods, and knowing that the sun sensor A/D readings are essentially instantaneous, it appears that the actual period is slightly shorter or longer than 2 minutes, and the one-minute sampling rate of the beacon is producing an aliased oscillation (beating) at a slower frequency, as seen at times 4:34 through 4:36.
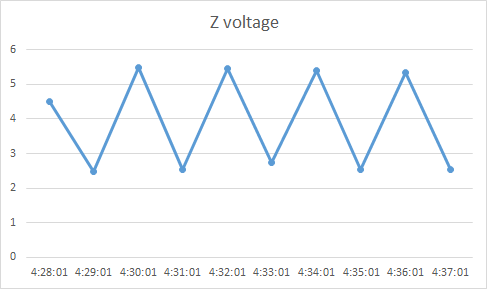
Assuming the rotation approximately around the X-axis, a configuration that could give this pattern is if the axis of rotation is pointed generally toward the sun, but with enough angle away from direct pointing that the Y faces move through sunlit and shaded periods during the tumble. If that is the case, then the +Z and -Z faces should also be going through sunlit and shaded periods every two minutes. Our +Z face is occupied by a camera aperature, with no sun sensor. The -Z face has a solar panel, but no sun sensor. In ground testing we found that when illuminated the voltage on the -Z panel was above 4V, and otherwise was below 4V. The second line of evidence, therefore, comes from the voltage telemetry on the -Z panel. In the plot below, it is clear that this voltage is oscillating above and below 4V on about a 2-minute period. There is no clear sign of beating in the -Z voltage data, which may be because the voltage is mainly high or low, without a wide range of intermediate response. It isn’t clear (to me at least) from these data whether the sense of tumble rotation is right-handed or left-handed. We’ll need to gather some telemetry data at a higher frequency to make that determination.
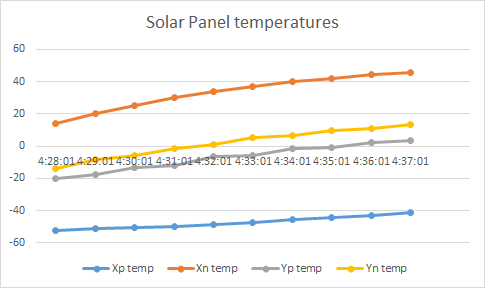
Supporting evidence comes from the solar panel temperature telemetry. As RamSat is in the early part of a sunlit period, temperatures on all panels should be rising. If our assumed orientation is correct we expect to see the -X panel much warmer than the +X panel. We also expect to see the Y panels at some intermediate temperature, potentially with some oscillation. We were not sure how much oscillation to expect, since we haven’t done a thorough analysis of thermal properties during ground testing. The data show expected behavior for the temperature differences and trends, and also suggest that the two-minute rotational period is fast enough that there are not large temperature swings being registered on the Y panels. There is some evidence of an oscillation, but interestingly it is offset from the inferred illumination. That could be the results of thermal inertia of the panels and their coupling to the frame and other components.
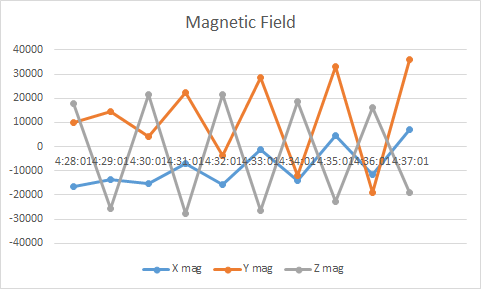
A final piece of evidence comes from the magnetic field sensors, integrated in the magnetorquer module. These are more difficult to interpret, since unlike the solar angle which should remain quite constant with respect to the rotational axis during orbit, the local magnetic field vector will oscillate by +/- 50 degrees or more during each orbit. We also have uncorrected bias in the X, Y, and Z magnetic sensors. In any case, it is clear in the data below that the field sensed by the Z sensor is oscillating with a 2-minute period, the field sensed by the X sensor is more stable but with increasing oscillations, and the Y field is oscillating with a 2-minute period, mainly out of phase with the Z sensor, but with a lot of drift during the observation period.
This has been a preliminary analysis, to help inspire our students to dig in to more observations to see if they can confirm (or reject!) these early findings. We hope you enjoy seeing some of results of your observations, and we offer our big thanks to the SatNOGS community for making this possible!
