wait for me (VE3SVF)?
Wait for me ?
In the meantime we shared the file via URL
@geoscan SOMEONE PLEASE SAVE ME MY SANITYYYYY


Today we will test our image beacon
Transmittions scheduled (UTC):
10:45:00
15:27:00
17:01:00
23:39:00
23:40:10
Will you schedule observations on the Network for this or do you need help with that? I just scheduled a few stations for the 10:45UTC transmission.
I planned to do that. But help would be appreciated:)
Thank you!
How long is each transmission? In other words, how long before/after each of those times should we schedule observations?
You can keep track of what I’m scheduling via this link:
https://network.satnogs.org/observations/?norad=53385&observer=214&station=&start=&end=&transmitter_mode=&page=1
Right now I’m using 10 mins before and 10 mins after each of your timestamps.
Transmission is about one minute long. Timestamps are times of transmission start. It’s clearly visible here SatNOGS Network - Observation 6773511
Okay, then the observations I scheduled should cover these transmissions. Fingers crossed your experiments will work!
gr_satellites seems to catch a bunch of frames: SatNOGS Network - Observation 6773620
Yes. That was partially preparation for this scheduled transmission. Thank you
is there any explanation on the shift in frequency during the pass ?
quite visible here https://network.satnogs.org/observations/6764586/
Maybe it is a shift in receiving? I’ve seen some examples when it was station thing
@PE0SAT According SatNOGS Network - Observation 6782301
Have you been able to collect data and parse image with @jupitersaturn09 script?
I guess a long TX period and this changes the internal temperature and has influence on the LO freq
I will give it a try, until now I haven’t been very successful
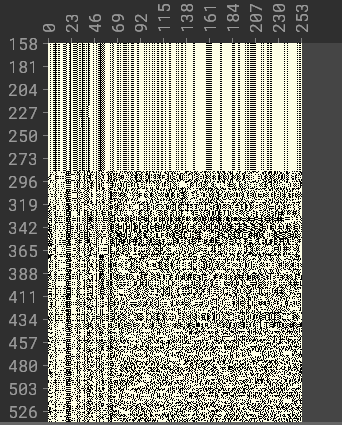
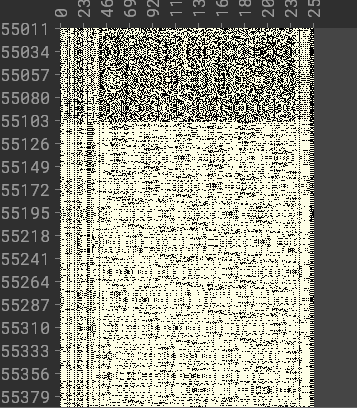
I am unable to create a jpg image file from this observation.
This is what I tried:
Replay the recorded IQ file from this observation and decoded the reception with UZ7HO geoscan sound modem version 0.2.
This gave the following output file
Then used this file as input for the script made by jupitersaturn09
The output jpg isn’t recognized a image file and not visible.
I clearly miss something.
all three of my stations are quite stable and they shouldn’t show the same drift if it were local to each. the same can be seen on most stations including geoscan: SatNOGS Network - Observation 6781332
It looks like it always goes lower after starting the high rate tx, so Jan might be correct.
a ppm or a few perhaps.
Yes, that was my second version, it might be true. Thank you