This is a RPi 4. I’d be interested to know if you can get anything useful out of the IQ file…
I’ll give it a go. What is the sample rate of your IQ recording?
I just noticed that since version 1.3.2 using the default flowgraph for LRPT doesn’t work anymore, since the default flowgraph is now FM instead of FSK, lowering the bandwidth to 50 kHz, see this commit:
I used the flowgraph from your branch (?) of satnogs-extras, so the rate should be 180k.
Don’t you mean @mat’s? He has updated it for the most recent satnogs-client, mine hasn’t been touched in ages.
Yep, that’s the one…
I haven’t managed to try and make any more progress on this - work getting in the way ![]() .
.
Unfortunately I don’t seem to be able to get anything useful out of the observation. medet_arm does produce a .dec file (~7Mb), but i can’t seem to get it to output any images.
This is the behaviour I was getting on the Pi whereas processing the same IQ file on Ubuntu works. Presumably if its running from an IQ file rather than realtime then it shouldn’t overflow?
I ran meteor_demod on your IQ file, it got a lock and demodedded some symbols. Then I ran medet on the resulting S file, it decodes quite some packets, but for some reason I only get a black image on all channels (64,65 and 68).
meteor_demod 234679.raw
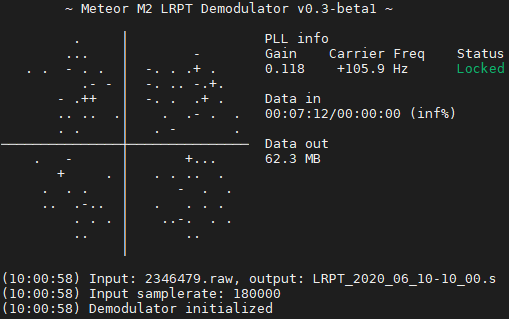
medet_arm LRPT_2020_06_10-10_00.s 2346479 -r 65 -g 65 -b 64
Reading LRPT_2020_06_10-10_00.s...
 pos=129198700 ( 99.98%) ( 5,13571,51) sig= -257 rs=(-1,-1,-1,-1) 63D96518
Total:        443.230377
Processing:   39.060593
Correlation:  138.698669
Viterbi:      243.678940
ECC:          20.752228
Remainder:    1.039957
Packets:      5534 / 7188
Elapsed time: 00:10:56.200Hmm. The observation did occur at night, so if the thermal IR channel isn’t working the image would be black.
I didn’t observer any overruns when the flow-graph was running, but I’ll try a few more observations just to check!
Just as a further note, I was able to run the LRPT flowgraph on my RPi4 using the following command, without any overruns observed:
satnogs_lrpt_demod.py --soapy-rx-device=“driver=rtlsdr” --samp-rate-rx=2.048e6 --rx-freq=137.1e6 --antenna=‘RX’ --gain=32.8
To get some idea of where the CPU cycles are going, top -H shows the CPU usage of each thread:
PID USER PR NI VIRT RES SHR S %CPU %MEM TIME+ COMMAND
13770 satnogs 20 0 361516 104980 52780 R 37.8 5.3 1:38.20 fir_filter_blk1
13768 satnogs 20 0 361516 104980 52780 R 27.3 5.3 1:10.92 pfb_arb_resampl
13766 satnogs 20 0 361516 104980 52780 S 12.5 5.3 0:31.41 fir_filter_blk<
13773 satnogs 20 0 361516 104980 52780 R 12.5 5.3 0:32.08 constellation_1
13762 satnogs 20 0 361516 104980 52780 S 7.2 5.3 0:18.61 python3
13771 satnogs 20 0 361516 104980 52780 S 6.6 5.3 0:16.82 costas_loop_cc1
13767 satnogs 20 0 361516 104980 52780 S 5.3 5.3 0:13.94 coarse_doppler_
13772 satnogs 20 0 361516 104980 52780 S 4.9 5.3 0:12.42 clock_recovery1
13763 hamlib-+ 20 0 46472 15764 2896 S 4.6 0.8 0:11.55 rigctld
13765 satnogs 20 0 361516 104980 52780 S 3.9 5.3 0:09.53 soapy::source1
13769 satnogs 20 0 361516 104980 52780 S 3.3 5.3 0:07.95 agc_cc17
13778 satnogs 20 0 361516 104980 52780 S 2.6 5.3 0:07.16 waterfall_sink2
I’m not really sure which part of the flowgraph fir_filter_blk1 is!
I think your observation is fine judging by the amount of packets that are recovered. I did check channel 68 which is normally the IR channel, but that image was also black.
OK, I’ve scheduled a few more observations, including one that should be early morning, so hopefully there will be something a bit more interesting to look at!
My observation just now yielded an image, I used the satnogs FSK flowgraph which functions as an IQ receiver with a bandwidth equal to 4 * baudrate if you ignore the FSK part and enable IQ dumping. This flowgraph is the default for unknown modulations in satnogs-client 1.3.1, but in 1.3.2 the FM flowgraph became the default and you have to set it as the flowgraph to use for LRPT in settings.py. The resulting iq file is processed with meteor_demod and medet_arm in a post-ob script.
Definitely something odd with the output soft-decision files.
I used to be able to run the soft-decision recordings (.s files) through the windows LRPT offline Decoder software just fine. However, the recordings from this updated flow-graph results in scatter plot with all outputs constrained to one quadrant:
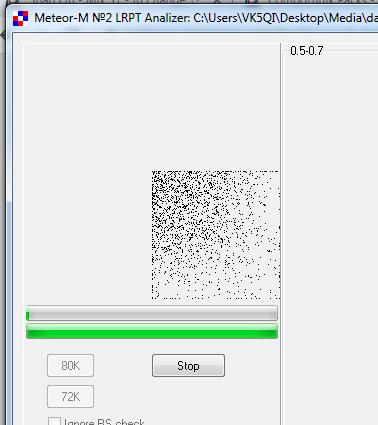
That’s interesting @vk5qi. I get similar results. This is a tiny slice extracted from Observation 2383859 from this morning.
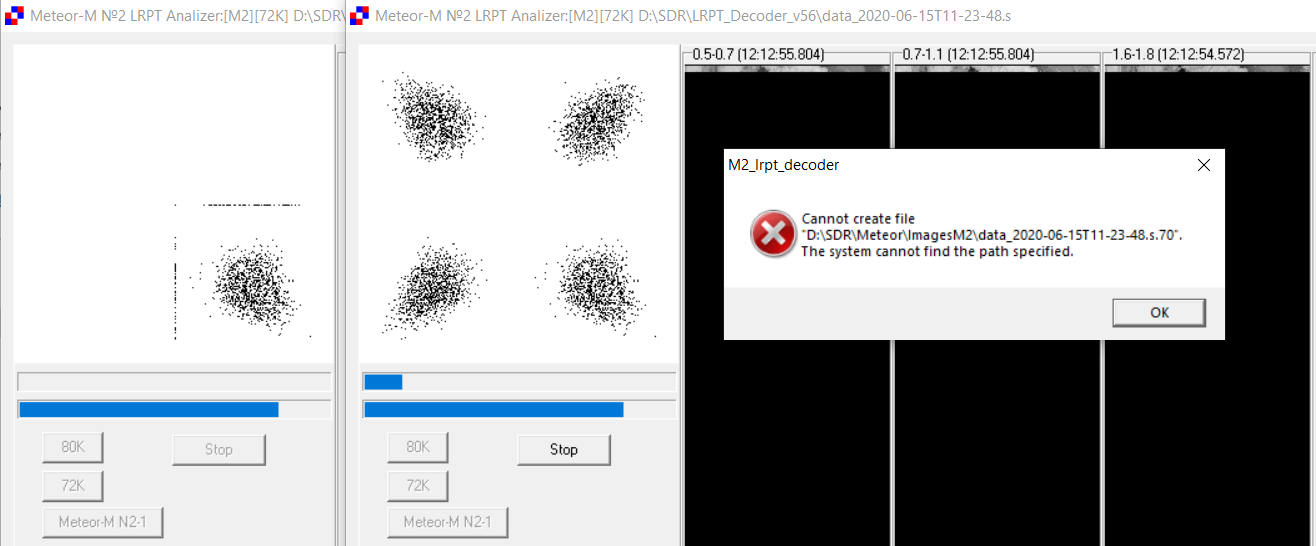
Not sure what the error message is all about, but the key thing is I’ve run the same IQ file from my Pi observation this morning through the same flowgraph on both the Pi (left) and the PC (right). Indeed, something’s awry after the clock recovery.
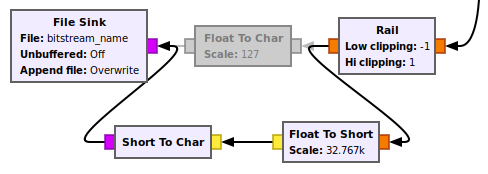
Question is what. I don’t know how to get a constellation plot like the one in the LRPT Decoder in GNURadio after the soft decoder converts it to floats, but time sinks suggest there are positive and negative values coming through as far as the Rail module.
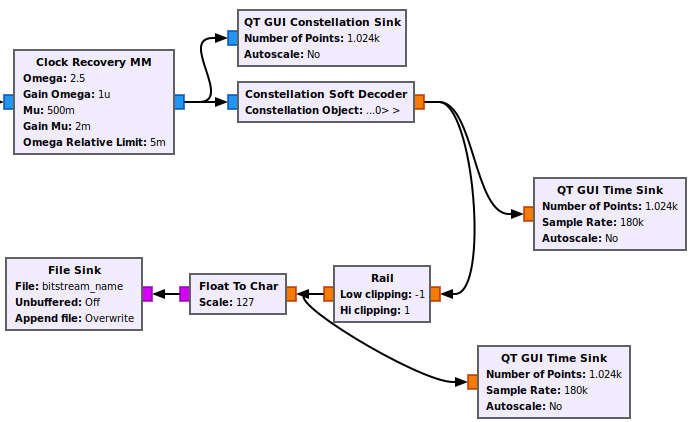
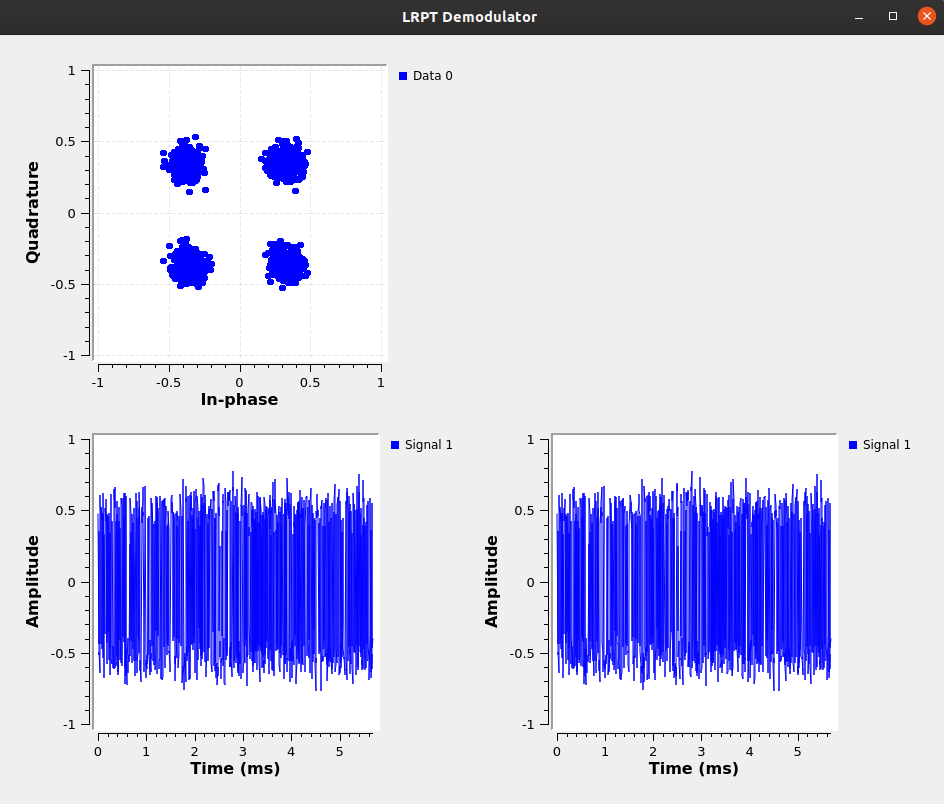
It certainly looks like a straightforward clipping of negative (high) values.

My current thinking is there’s something architecturally different going on in volk/volk_32f_s32f_convert_8i.h at master · gnuradio/volk · GitHub via gnuradio/float_to_char_impl.cc at master · gnuradio/gnuradio · GitHub but that may be a rabbit hole.
Yep, it looks like there’s an issue with using float_to_char on the Pi. The following bodge appears to resolve the problem:
I’ve raised GNURadio issue #3571: Float to Char behaviour differs between arm and x64 to flag this.
Just to prove the point, all done on the Pi from this morning’s IQ recording:
pi@pinog:~/tmp$ ./satnogs_lrpt_demod.py
Warning: failed to XInitThreads()
libEGL warning: DRI2: failed to authenticate
qt.qpa.xcb: QXcbConnection: XCB error: 1 (BadRequest), sequence: 418, resource id: 1029, major code: 155 (Unknown), minor code: 1

pi@pinog:/tmp $ medet_arm /tmp/data_2020-06-15T12-58-38.s /tmp/monday3 -cd
Reading /tmp/data_2020-06-15T12-58-38.s...
 pos=134713788 (100.00%) ( 4,13129,49) sig=  -14 rs=(-1,-1,-1,-1) 37BD6181
Total:        213.878799
Processing:   15.238238
Correlation:  67.483192
Viterbi:      120.766205
ECC:          10.180222
Remainder:    0.210940
Packets:      4711 / 7199
Elapsed time: 00:09:05.392

Hello everybody
I joined SatNOGS a week ago and I’m very happy about this community. 
I have some previous experience with ham satellites and gnu-radio but I’m starting to learn about SatNOGS.
I have put online a station using a Rasberry pi 3 and an RTL-SDR dongle a week ago to test the setup.
I realized the METEOR M2 is not supported in the standard setup. Why is the reason of that? There are several tutorials to add meteor decoding to SatNOGS so there is plenty of experience to support that out of the box.
The tutorials I saw are not working with the latest version of SatNOGS ( 20200304) and GNU radio.
Then I found this thread, and also thanks to this wiki:
https://wiki.satnogs.org/Understanding_%27satnogs-flowgraphs%27
I decided to change the default flowgraph in my setup (fm.grc) and created lrpt.grc with a higher sampling rate enabling IQ dump.
This is the result: https://network.satnogs.org/observations/2371079/
Then, processed the IQ dump on my desktop computer using gnu-radio 3.8 with a flowgraph based on a demodulator I found for older versions of gnu-radio. I could lock the QPSK constellation and then with medet I could generate a decent image. (I have very little coverage in my station only visibility to the south  ).
).


Is it possible to do the same processing live on the Pi 3? I have read some concerns about the processing speed may not be enough.
Where I can find documentation about doppler compensation block? There is some carrier offset I don’t quite understand.
I would like to have the whole process automated on the station. Does anyone have this working with the latest SatNOGS version?
Regards
LU2HES
I realized the METEOR M2 is not supported in the standard setup. Why is the reason of that? There are several tutorials to add meteor decoding to SatNOGS so there is plenty of experience to support that out of the box.
The decoder presently relies upon post-processing of the data received. The SatNOGS architecture relies on processing in real-time. It feels like there’s not quite enough horsepower in a Pi to process in real-time but it’s worth analysing:
During Observation 2387319 this morning, I recorded the following CPU load on my Pi 4 just for the flowgraph processing down to soft-symbols:
top - 08:51:52 up 18:08,  3 users,  load average: 0.89, 0.29, 0.12
Tasks: 135 total,   1 running, 133 sleeping,   1 stopped,   0 zombie
%Cpu(s): 17.9 us,  4.2 sy,  0.0 ni, 77.4 id,  0.1 wa,  0.0 hi,  0.4 si,  0.0 st
MiB Mem :   1939.4 total,   1006.2 free,    285.3 used,    647.9 buff/cache
MiB Swap:   1939.4 total,   1939.4 free,      0.0 used.   1480.3 avail Mem

  PID USER      PR  NI    VIRT    RES    SHR S  %CPU  %MEM     TIME+ COMMAND
28825 satnogs   20   0  369560 105472  53292 S  72.2   5.3   0:25.63 satnogs_lrpt_de
22736 pi        20   0   57480  13472   9796 S   7.0   0.7   0:18.21 satnogs-monitor
  324 hamlib-+  20   0   26956   6092   2896 S   2.6   0.3   0:21.91 rigctld
22707 pi        20   0   12236   3520   2732 S   2.0   0.2   0:01.21 sshd
22787 root      20   0       0      0      0 I   1.0   0.0   0:01.08 kworker/u8:2-events_unbound
28586 root      20   0       0      0      0 I   1.0   0.0   0:00.21 kworker/u8:3-events_unbound
23319 root      20   0       0      0      0 I   0.7   0.0   0:00.99 kworker/u8:1-brcmf_wq/mmc1:0001:1
   10 root      20   0       0      0      0 I   0.3   0.0   0:03.17 rcu_sched
   16 root      20   0       0      0      0 S   0.3   0.0   0:00.50 ksoftirqd/1
   81 root     -51   0       0      0      0 S   0.3   0.0   0:18.69 irq/36-mmc1
  332 satnogs   20   0  360668 148036  18228 S   0.3   7.5   2:44.13 satnogs-client
22895 pi        20   0    8884   2564   1276 S   0.3   0.1   0:05.90 bash
23060 pi        20   0   10300   3056   2548 R   0.3   0.2   0:11.19 top
...
Note: this is with 180kHz bandwidth, and the IQ being recorded.
My (well @vk5qi’s) post-processing script failed due to finger-trouble on my part, but running manually it obviously uses as much CPU as it can:
top - 09:41:45 up 18:58,  3 users,  load average: 0.41, 0.16, 0.11
Tasks: 133 total,   2 running, 130 sleeping,   1 stopped,   0 zombie
%Cpu(s): 24.2 us,  1.7 sy,  0.0 ni, 74.1 id,  0.1 wa,  0.0 hi,  0.0 si,  0.0 st
MiB Mem :   1939.4 total,    695.5 free,    347.2 used,    896.8 buff/cache
MiB Swap:   1939.4 total,   1939.4 free,      0.0 used.   1215.8 avail Mem

  PID USER      PR  NI    VIRT    RES    SHR S  %CPU  %MEM     TIME+ COMMAND
 6706 satnogs   20   0  101076 100848    152 R 100.0   5.1   0:20.19 medet_arm
 6703 pi        20   0   10296   3048   2548 R   0.3   0.2   0:00.08 top
That being said it doesn’t run for long to process a 5m35 pass.
pi@pinog:~/satnogs/meteor $ time sudo -u satnogs ./process_meteor.py
Waiting for 5 seconds before processing.
Attempting to process: /tmp/data_2387319_2020-06-16T08-51-18.s
Total:        55.876305
Processing:   6.691829
Correlation:  0.444239
Viterbi:      45.528801
ECC:          3.202699
Remainder:    0.008737
Packets:      2891 / 2903
Elapsed time: 00:05:27.480
convert-im6.q16: length and filesize do not match `/tmp/meteor_image_temp_vis.bmp' @ warning/bmp.c/ReadBMPImage/839.
Total:        6.691481
Processing:   6.687521
Correlation:  0.000000
Viterbi:      0.000000
ECC:          0.000000
Remainder:    0.003960
Packets:      2891 / 2891
Elapsed time: 00:05:27.480
convert-im6.q16: length and filesize do not match `/tmp/meteor_image_temp_ir.bmp' @ warning/bmp.c/ReadBMPImage/839.
VIS processing successful!
IR processing successful!

real    1m14.571s
user    1m2.550s
sys     0m7.144s
I was initially confused by the medet times, but of course they’re the elapsed time of the pass, not the processing runtime. Read the time values, and note that this covers processing the IR image as well which always seems to be blank so could be suppressed.
So:
-
Flowgraph: 70% CPU. This could possibly be minimised by reducing the bandwidth a little. I increased it to 180 KHz whilst having trouble, but it could probably be dropped back to ~156.25 KHz or even less. Not sure how much difference that will make. Turning off the IQ recording would also likely make a difference, and I can do that now that the flowgraph has a valid output.
-
Decoder: 100% CPU for about 75 seconds of a 335 second pass works out at about 33% CPU. The medet_arm code is in Pascal. I have no idea whether it’s possible to optimise that at all with multithreading, native instructions, etc. I haven’t really looked at it.
Sounds plausible but close to capacity and likely to cause overruns. It doesn’t leave a lot of headroom to run anything else like satnogs-monitor (7% CPU).
How many other signals will need similar post-processing? Is it better to optimise this to run in real time, or to maintain an add-on module that nicely post-processes a few seconds later?
I dropped the bandwidth down to 2 x sample_rate = 144KHz for Observation 2391761. It doesn’t seem to have made a lot of difference - was varying between ~70% and ~90%.
top - 18:44:28 up 1 day,  4:01,  2 users,  load average: 1.97, 1.03, 0.48
Tasks: 128 total,   1 running, 127 sleeping,   0 stopped,   0 zombie
%Cpu(s): 18.8 us,  4.9 sy,  0.0 ni, 75.6 id,  0.0 wa,  0.0 hi,  0.8 si,  0.0 st
MiB Mem :   1939.4 total,    496.5 free,    391.3 used,   1051.6 buff/cache
MiB Swap:   1939.4 total,   1939.4 free,      0.0 used.   1200.2 avail Mem

  PID USER      PR  NI    VIRT    RES    SHR S  %CPU  %MEM     TIME+ COMMAND
28073 satnogs 20 0 369556 105296 53140 S 89.7 5.3 3:45.44 satnogs_lrpt_deOk, based on what you see it should be possible to do the entire process on the PI. I’m using 156.25ks/s as sampling rate, I will try to generate the soft symbols in real time on the PI and then focus on the post-processing script.
Your observations look very good by the way ![]() , were they generated automatically?
, were they generated automatically?
How many other signals will need similar post-processing? Is it better to optimise this to run in real time, or to maintain an add-on module that nicely post-processes a few seconds later?
Yes I understand, I don’t see an issue with running the process to convert soft symbols to the image after the observation, this could be supported in the out of the box installation for LRPT decoding. Do they want to avoid post-processing to free the schedule right after the observation?
Do you know where I can find documentation about some of the gr-satnogs blocks like the doppler correction block?
Observations 2392643 and 2391762 were entirely automatic using @vk5qi’s process_meteor.py script. The only thing I changed was reducing the WAIT_TIME for debugging purposes - 200 seconds is a long time to sit around! The previous observations needed a bit of jollying along as I’d got my scripts in a tangle. Personally I’m impressed that I got sufficient signal for 2392643 as it’s low on the horizon.
Not sure on why post-processing isn’t within the architecture. One of the issues would be the schedule immediately after being affected but it’s fairly deterministic how long it will take so that could be solved.
No idea on the Doppler Correction block, the documentation seems fairly scant on most blocks so I’ve relied on seeing how other example flowgraphs are configured and trying things. Google’s about your best bet!