Sorry, real work and real life got in the way. Just taking another look at this.
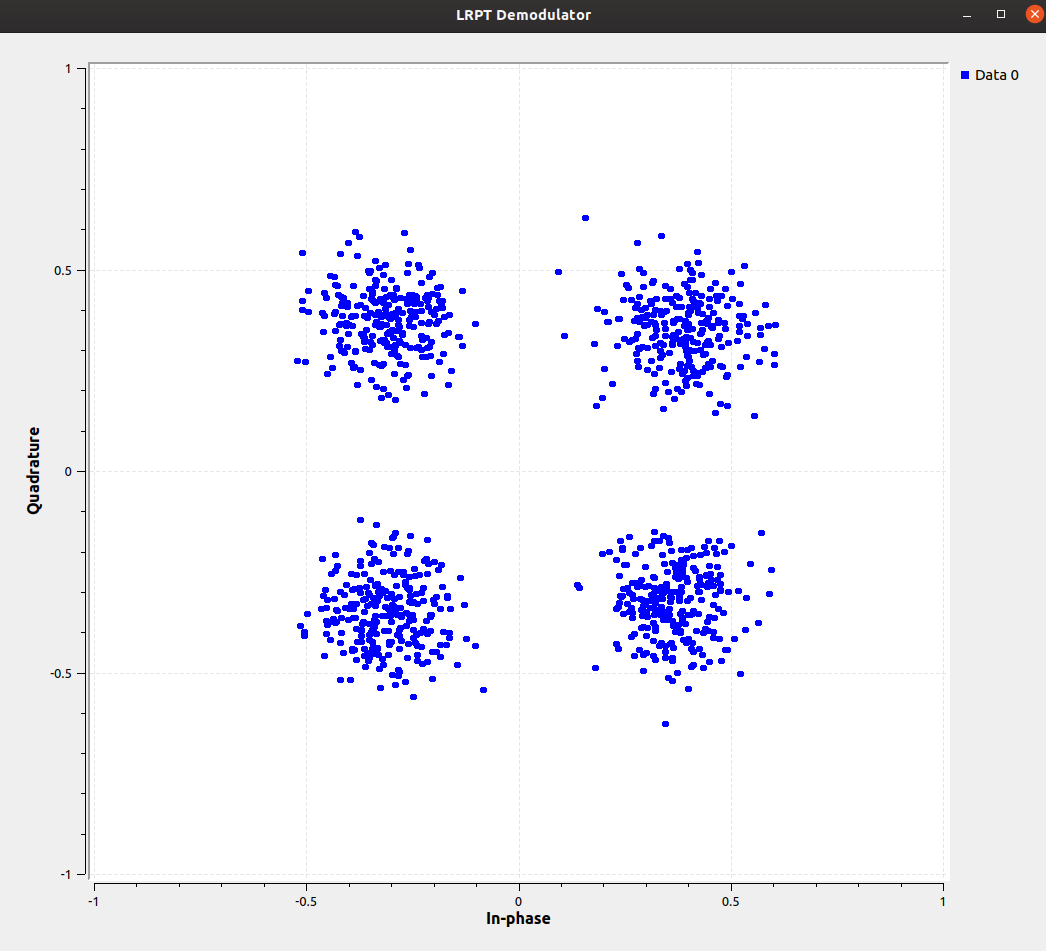
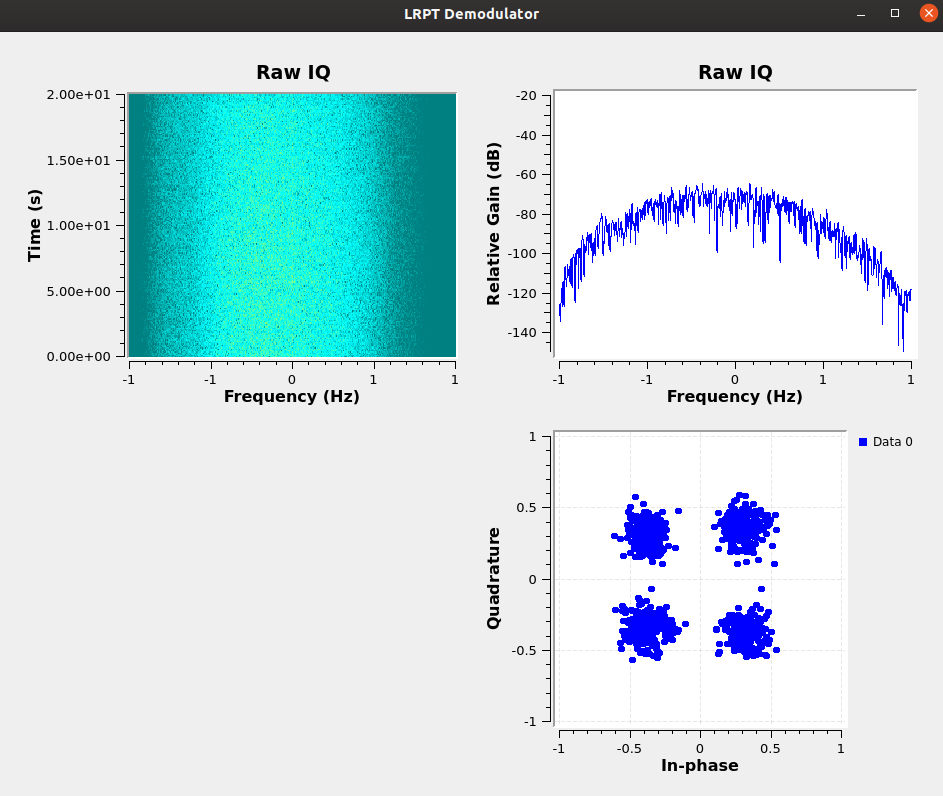
Constellation plot
@anders, this is a plot from the middle of Observation 2235610 this morning. Looks like mine are similarly askew from 0.5. I assume this doesn’t really matter for a strong signal, but worth fixing nonetheless. I don’t know the theory any more than you do - sounds like you’ve got further with adjusting this than me.
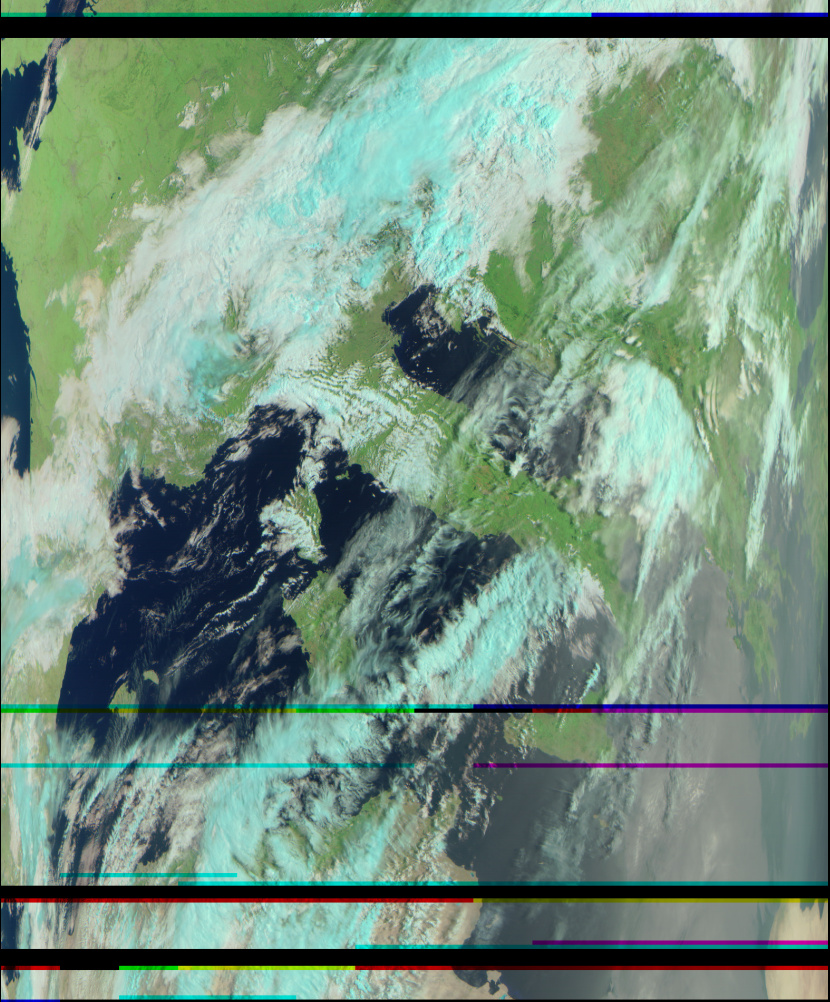
I don’t get the same jerks as you do, so assume that’s down to local interference. (I can’t figure out a quick and easy way to capture a video). Looks like you’re getting similar artefacts through the image that I get on the periphery. I’ve not looked into the image encoding to know whether this is a direct artefact of poor signal or more complicated.
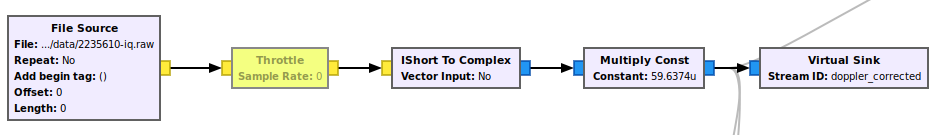
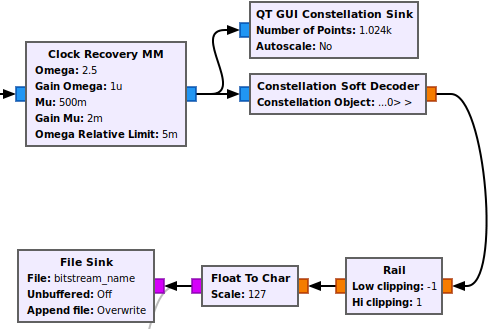
I’m still only getting valid symbol files by running the IQ through GnuRadio Companion on my VM and not on the Pi. This is only reversing the IQ Sink scaling but it must be having some other effect:
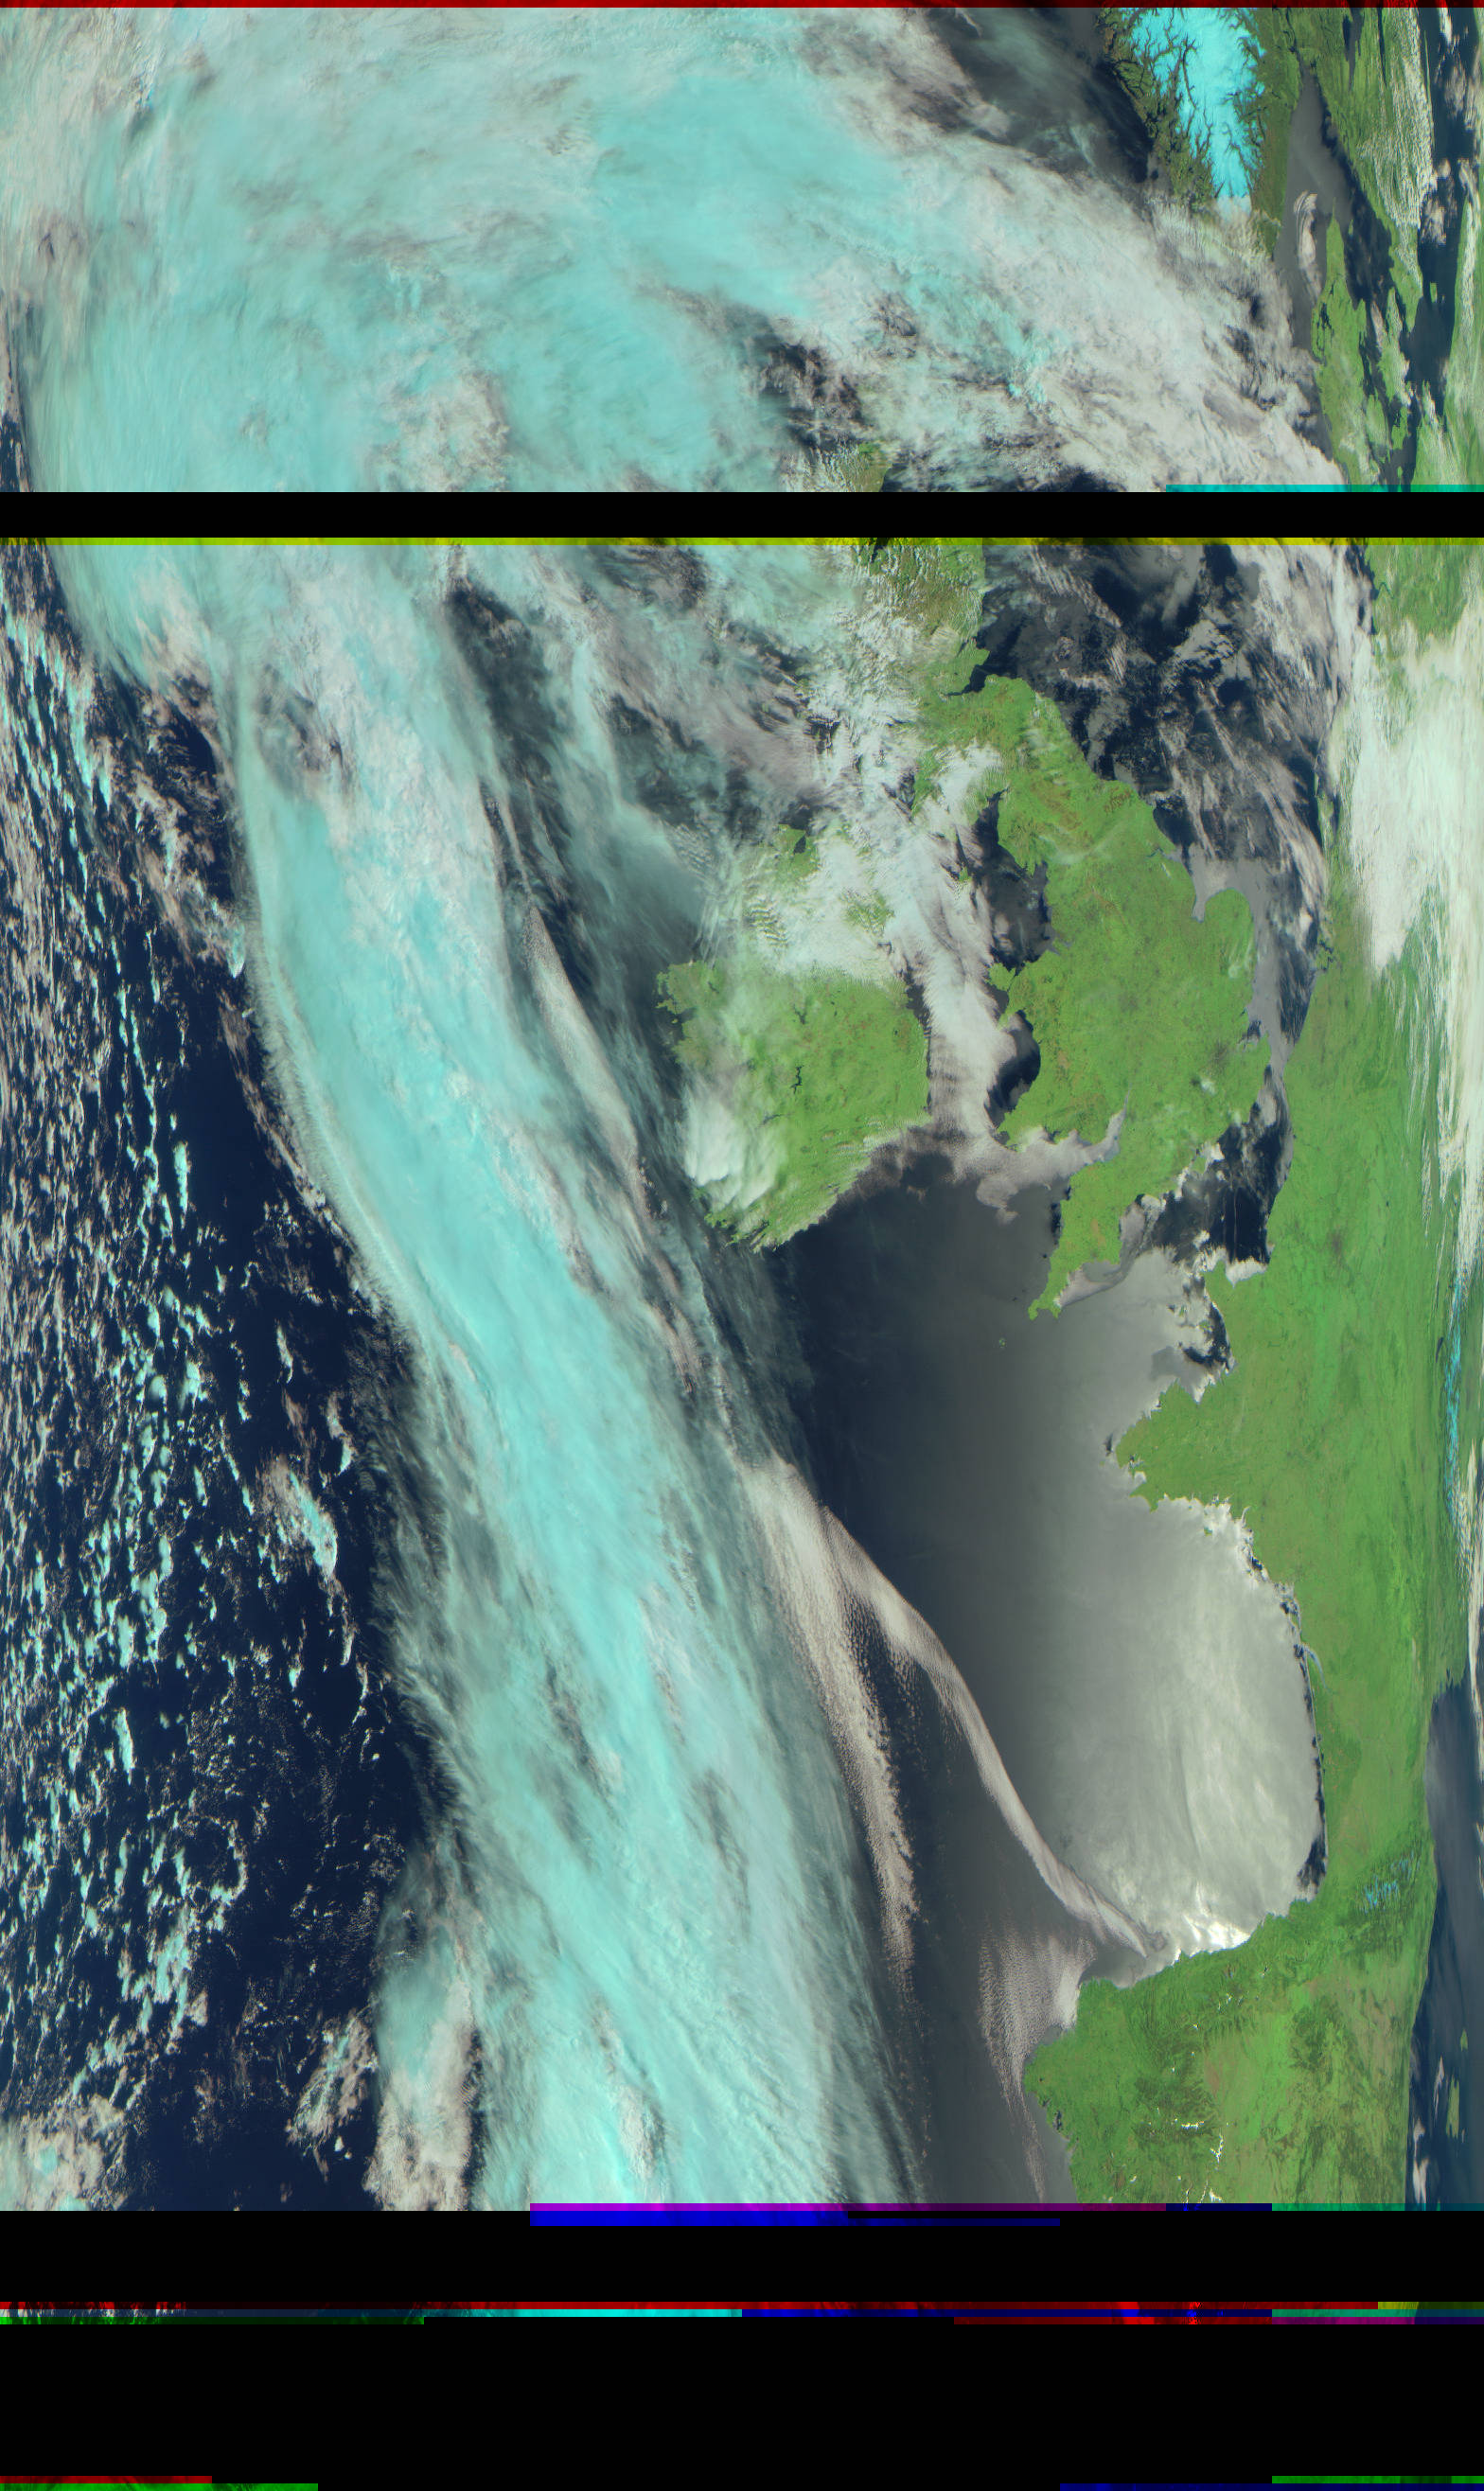
There’s something odd going on there - the former run has 3168/6620 packets. This is commensurate with about half the waterfall image looking like it’s got a reasonable signal. The latter has 8126/8126 but there’s an awful lot of FFFFFFFFs.
I wonder if there’s a way to detect a valid constellation and not output gibberish when there’s not. Sort of a squelch? That would reduce the symbol file size a bit. Then again, I wonder how much of medet could be done in the flowgraph in realtime.
So, I thought I’d copy my flowgraph to the Pi and run it manually to see what happens:
$ ./satnogs_lrpt_demod.py
/home/pi/.gnuradio/prefs/vmcircbuf_default_factory: No such file or directory
vmcircbuf_createfilemapping: createfilemapping is not available
gr::vmcircbuf_sysv_shm: shmat (2): Invalid argument
gr::vmcircbuf_sysv_shm: shmat (2): Invalid argument
gr::vmcircbuf_sysv_shm: shmat (2): Invalid argument
Seems I can ignore the first couple as warnings; not sure about the remainder but they do seem to stop and don’t recur on next run so I assume it’s to do with setting stuff up.
This creates a 128MB file, but still doesn’t process through medet:
There’s something different happening on the Pi compared to my VM. Question is - what?
With a bit of faff I’ve managed to get the flowgraph to run on the Pi with the GUI rendered onto my dev box. I imagine it’s not at all performant, but I do get a good constellation:
I tried it with the GUI disabled first, then realised that wasn’t going to tell me much, so figured I’d try it with the GUI. It worked surprisingly well. I just connect from my Ubuntu VM to the Pi over ssh with X forwarding (ssh -X I think) and it all appears on-screen like magic. Really surprised it was that easy.
I hard coded everything, including the input filename in the flowgraph. Compiled in GRC then copied the build .py file to the Pi using scp. Run it like any other command. That way I didn’t need to mess with command line arguments, but I guess you could do it that way too.
Good point, which I forgot to mention. I’m running it on an x86, so CPU, RAM and tmpfs diskspace are not a problem.
I have not tried this on an RPi, nor did I try the pre-gnuradio 3.8 version of lrpt_demod.py, but I do note that the 180kHz quadrature rate is about 15% higher than the 156.25kHz from the old version. Also note that the currently the Doppler correction block filters the bandpass; it may be that that requires more CPU power.
Would the Raspberry Pi run out of horsepower processing an IQ file rather than a stream? I’ll have to watch top while running the flowgraph next time.
I’m not sure whether I should expect feeding the same IQ file in twice to be deterministic? Although I guess I could try running the same data through twice on the same system then I’ll know. Struggling to work out where to attack next.
I would, perhaps naively, think that processing an IQ file would give better results as it does not require realtime processing that a stream does. However, I think that with the 3.7 version of lrpt_demod.py, LRPT observations could be processed in realtime using an RPi.
I was doing realtime processing of LRPT (at least to the QPSK soft-bit stage) on a RPi 3B+ without issues. It wasn’t possible to do the image decoding step however, that ran afterwards in a post-processing script.
Remember that as this flowgraph is going to be kind of separate from the regular satnogs flowgraphs, we can fix various parameters - e.g. we could drop the quadrate rate down to 156.25 kHz if that’s an issue.
Hi all, just chiming in as I did see something like that in the past.
With client version 0.9 I had a working automated LRPT receive chain going. But when watching the output of satnogs-client during an observation I sometimes saw a string of OOOO’s in the log, which is printed by librtlsdr when a buffer is overrun, so apparently sometimes the RPi CPU could not keep up with the data stream from the dongle.
Since with the flowgraph included in version 1.3 the observation bandwidth has only increased, the chance of this happening is even bigger, so perhaps it is better to not do the symbol recovery in real time in the flow graph when using an RPi, but just record an IQ file and then run meteor_demod and medet in a post observation script so the CPU gets some breathing room during the observation. Another advantage is that you don’t need to change anything in satnogs-client, you just need to configure the post observation script in the settings. Of course you will end up with huuuuge IQ files, so they should be stored somewhere else than on the ramdisk or it will choke the Pi. I will see if I can get that to work in the near future.
Given the LRPT flowgraph is going to be a completely separate flowgraph (since it breaks the satnogs convention of doing all processing in realtime), there’s no reason why the observation bandwidth can’t be narrowed back to what we were using in the original LRPT flow-graph.
I was able to do the QPSK demodulation portion in realtime on a RPi 3B+.
Ok, the 288000 sample rate IQ files are a bit big to handle, so maybe not touching the default flowgraph an using th dump iq functionality is not a good idea after all.
Unfortunately I don’t seem to be able to get anything useful out of the observation. medet_arm does produce a .dec file (~7Mb), but i can’t seem to get it to output any images.
Are you running an RPi 4 or RPi 3B+? I see you are using an SDRPlay at 1 msps, an rtlsdr is at 2.048 msps in satnogs which takes quite a bit more CPU load to handle.
The setup where I saw occasional overruns was with an RPi 3B+, client 0.9, flowgraph from your repository and an rtlsdr at 2.048 msps. It was really on the edge, because on some observations I saw overruns and on other observations I didn’t. I also tried an airspy mini, but with that it was really impossible since the minimum sample rate of that is 3 msps.