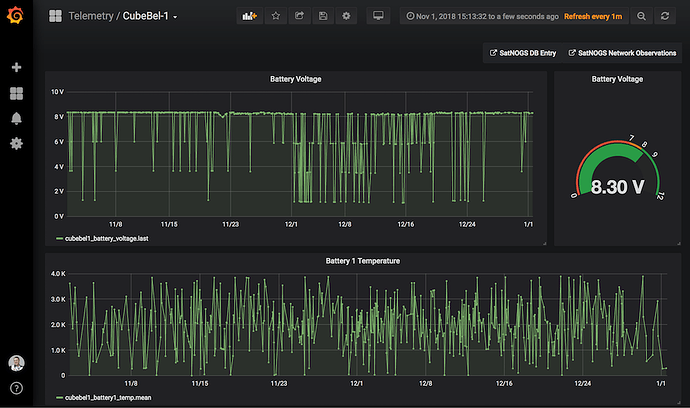
This has been a long time coming, and we are happy to share the latest in the SatNOGS suite: the SatNOGS Dashboard and Data Warehouse, at dashboard.satnogs.org
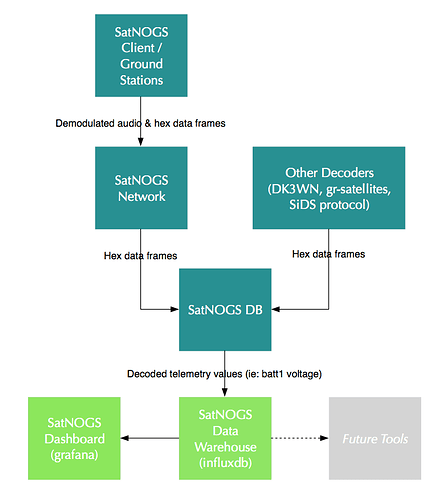
This is a time-series database where decoded telemetry and data from captured data frames can be stored and analyzed. In this setup we are using influxdb as the database to hold telemetry, and grafana for the visualization layer.
To put this into perspective with the whole ecosystem of data collection in mind, see the bottom green boxes representing the new pieces we have added:
We want satellite graphs to be crowd-sourced and collaborative. We welcome you all to sign in to the dashboard, and if you would like to hack on your own graphs let us know and we will grant you privileges to do so. We have some rough docs on creating dashboards on the wiki.
It is important to note that we will only be decoding data for satellites we have written decoders for, see the satnogs-decoders repository. We welcome help from anyone who would like to contribute to this effort as well.
Also note that we are not decoding historical data for most of the satellites yet so you may only see data for the past week (and new data moving forward). We will add historical data as resources allow.
Kudos to @DL4PD and @kerel in working on the dev environment and our initial decoders, and to @Acinonyx getting this off the ground!

