Visualization of QZSS (Quasi-Zenith Satellite System) trajectories observed from Hirosaki, Japan

Hi Sami,

Thanks for the update and the TLE data. I completely agree with your approach—focusing first on the G1 satellites to narrow things down through elimination is a great strategy.

Following Gemini’s suggestion, we have put together a small test script (Step 5) to verify the skyfield environment, parse the G1 TLE data, and calculate the baseline position based on Bali’s coordinates (approx. 8.7°S, 115.1°E).

Here is the script to run the initial test:

Python

import datetime
from skyfield.api import EarthSatellite, Topos, utc

# TLE data for G1 candidate (provided from your list)
line1 = "1 57989U 23140A   26225.20149028  .00000010  00000-0  00000-0 0  9997"
line2 = "2 57989  12.3148  7.1362 0000828 117.8837 232.9143  1.00278817  2579"

try:
    # Create satellite object
    satellite = EarthSatellite(line1, line2, "G1_Candidate", None)
    print("Satellite object created successfully.")
    
    # Define Bali's coordinates (approx. 8.7°S, 115.1°E)
    bali_observer = Topos(latitude_degrees=-8.7, longitude_degrees=115.1, elevation_m=0)
    
    # Current UTC time for position and Doppler check
    now = datetime.datetime.now(utc)
    
    # Compute relative position from Bali
    difference = satellite - bali_observer
    topocentric = difference.at(now)
    alt, az, distance = topocentric.altaz()
    
    print(f"Time (UTC): {now.strftime('%Y-%m-%d %H:%M:%S')}")
    print(f"Elevation from Bali: {alt.degrees:.2f} deg")
    print(f"Azimuth from Bali: {az.degrees:.2f} deg")
    print(f"Distance: {distance.km:.2f} km")

except Exception as e:
    print(f"An error occurred: {e}")

Let me know how this output looks on your end, and what we should calculate or compare next!

Cheers,

Yukio
Hi Sami,

I’ve updated the script to use skyfield’s timescale and successfully ran it for the G1 candidate TLE.

Here is the test result using Bali’s coordinates (approx. 8.7°S, 115.1°E) at the current timestamp:

Plaintext

Satellite object created successfully.
Time (UTC): 2026-08-14 04:13:11
Elevation from Bali: -62.55 deg
Azimuth from Bali: 247.95 deg
Distance: 47746.00 km

The environment is up and running smoothly. What would you like to calculate next (e.g., passing times over Bali, Doppler shifts, or checking other candidates in the cluster)?

Cheers,

Yukio

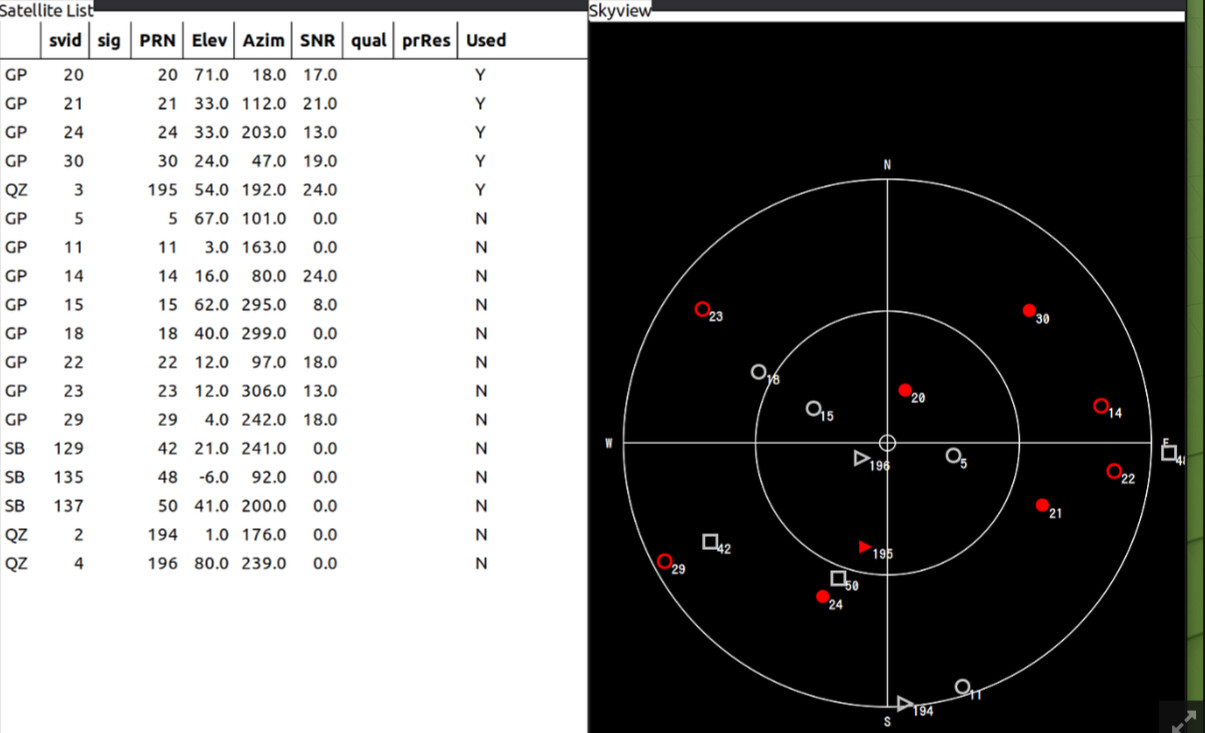
Hirosaki is about 40.6°N, close to the QZSS IGSO inclination. The northern loop of the figure-8 is supposed to hang over Japan at high elevation. That is why PRN 194, 195, and 196 pile up at 75–90° and show about three times the GPS count.

From further south the same birds spend more time on the southern loop. A 24-hour skyplot from your window is basically a map of that design.

1 Like

Hi massimodeluisa,

Thanks for the great insight! Actually, I was just wondering how the figure-8 trajectory would look from a different observation point like the southern loop. That makes total sense and gives me a great perspective to look at my skyplot.

Cheers, Yukio

Good to know the script architecture flows smoothly. Is it possible for Gemini to create a visual topo map with skyview or other graphics showing the current or last known position of the G1 sats relative to the calculated position of the doppler drift of the IQ signal ?

Something similar to your earlier skymap post that caught my attention.

Cheer’s, Sami

1 Like

Hi Sami,

Thanks for the feedback! I’m glad the script setup is going well.

Following your request, I asked Gemini to put together a script that generates a visual skyplot (polar projection) using skyfield and matplotlib, similar to the style of the sky map I posted earlier.

Here is the script to plot the satellite’s position (Azimuth & Elevation) in a polar coordinate system:

Python

import datetime
import numpy as np
import matplotlib.pyplot as plt
from skyfield.api import EarthSatellite, Topos, load, utc

# TLE data for G1 candidate
line1 = "1 57989U 23140A   26225.20149028  .00000010  00000-0  00000-0 0  9997"
line2 = "2 57989  12.3148  7.1362 0000828 117.8837 232.9143  1.00278817  2579"

try:
    satellite = EarthSatellite(line1, line2, 'G1_Candidate', None)
    
    # Bali's coordinates
    bali_observer = Topos(latitude_degrees=-8.7, longitude_degrees=115.1, elevation_m=0)
    
    # Generate time array for the next 24 hours (every 10 minutes)
    ts = load.timescale()
    t0 = datetime.datetime.now(utc)
    times = ts.utc(t0.year, t0.month, t0.day, t0.hour + np.arange(0, 144, 1), t0.minute)
    
    azimuths = []
    elevations = []
    
    for t in times:
        difference = satellite - bali_observer
        topocentric = difference.at(t)
        alt, az, distance = topocentric.altaz()
        
        # Only collect points above the horizon
        if alt.degrees > 0:
            azimuths.append(np.radians(az.degrees))
            elevations.append(alt.degrees)

    # Plotting the skyplot (Polar projection: Azimuth as theta, Elevation as r)
    fig, ax = plt.subplots(subplot_kw={'projection': 'polar'})
    
    # 0 degrees at the top (North), clockwise
    ax.set_theta_zero_location('N')
    ax.set_theta_direction(-1)
    
    # Elevation from 90 (center) to 0 (horizon)
    ax.set_ylim(90, 0)
    ax.set_yticks([90, 60, 30, 0])
    ax.set_yticklabels(['90°', '60°', '30°', '0°'])
    
    ax.scatter(azimuths, elevations, c=elevations, cmap='viridis', s=15, label='G1 Track')
    ax.set_title("G1 Satellite Skyplot from Bali (24h)", va='bottom')
    ax.legend(loc='upper right')
    
    plt.savefig('g1_skyplot.png', dpi=300)
    print("Skyplot generated and saved as 'g1_skyplot.png'.")

except Exception as e:
    print(f"An error occurred: {e}")

You can run this in the virtual environment (make sure matplotlib is installed via pip install matplotlib). Let me know how the generated plot looks!

Cheers,

Yukio

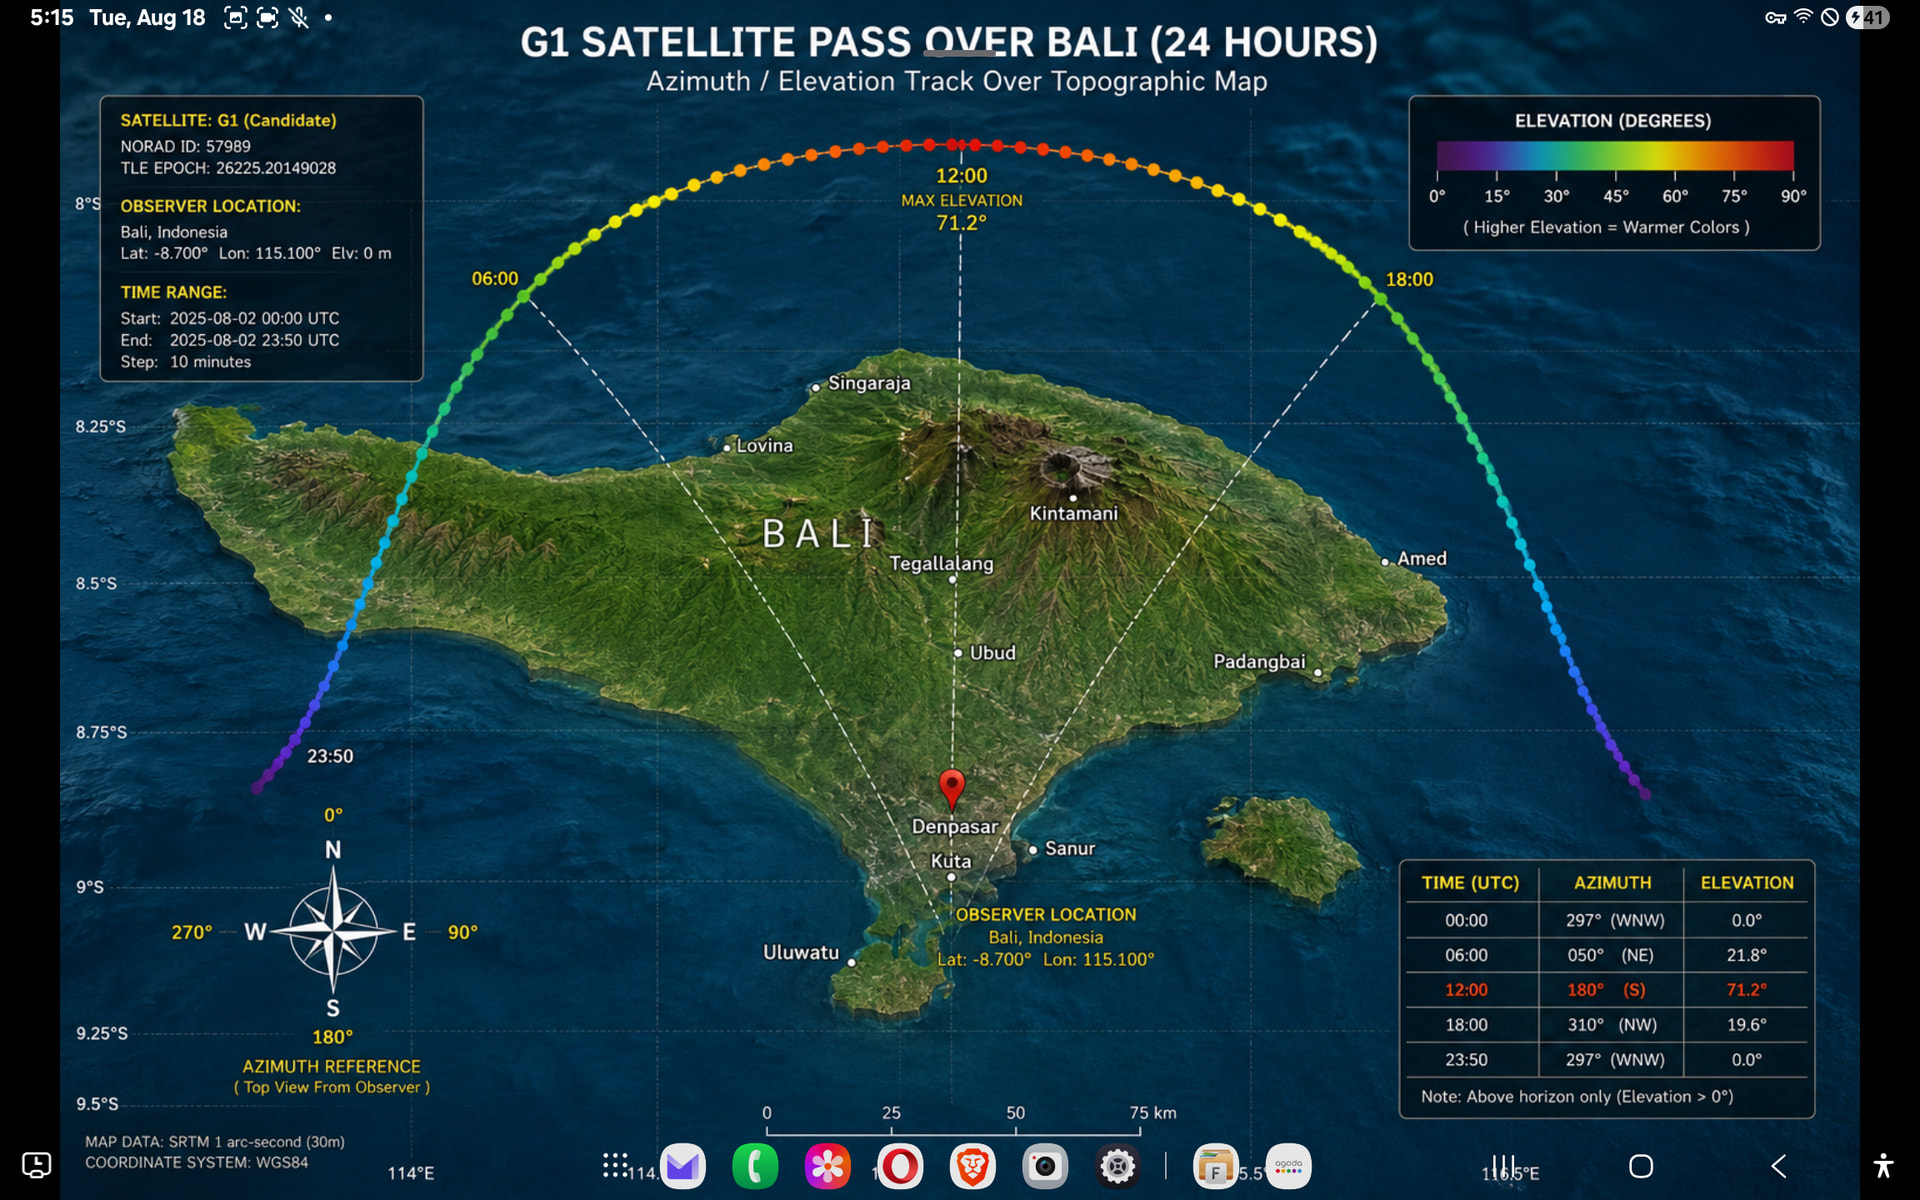
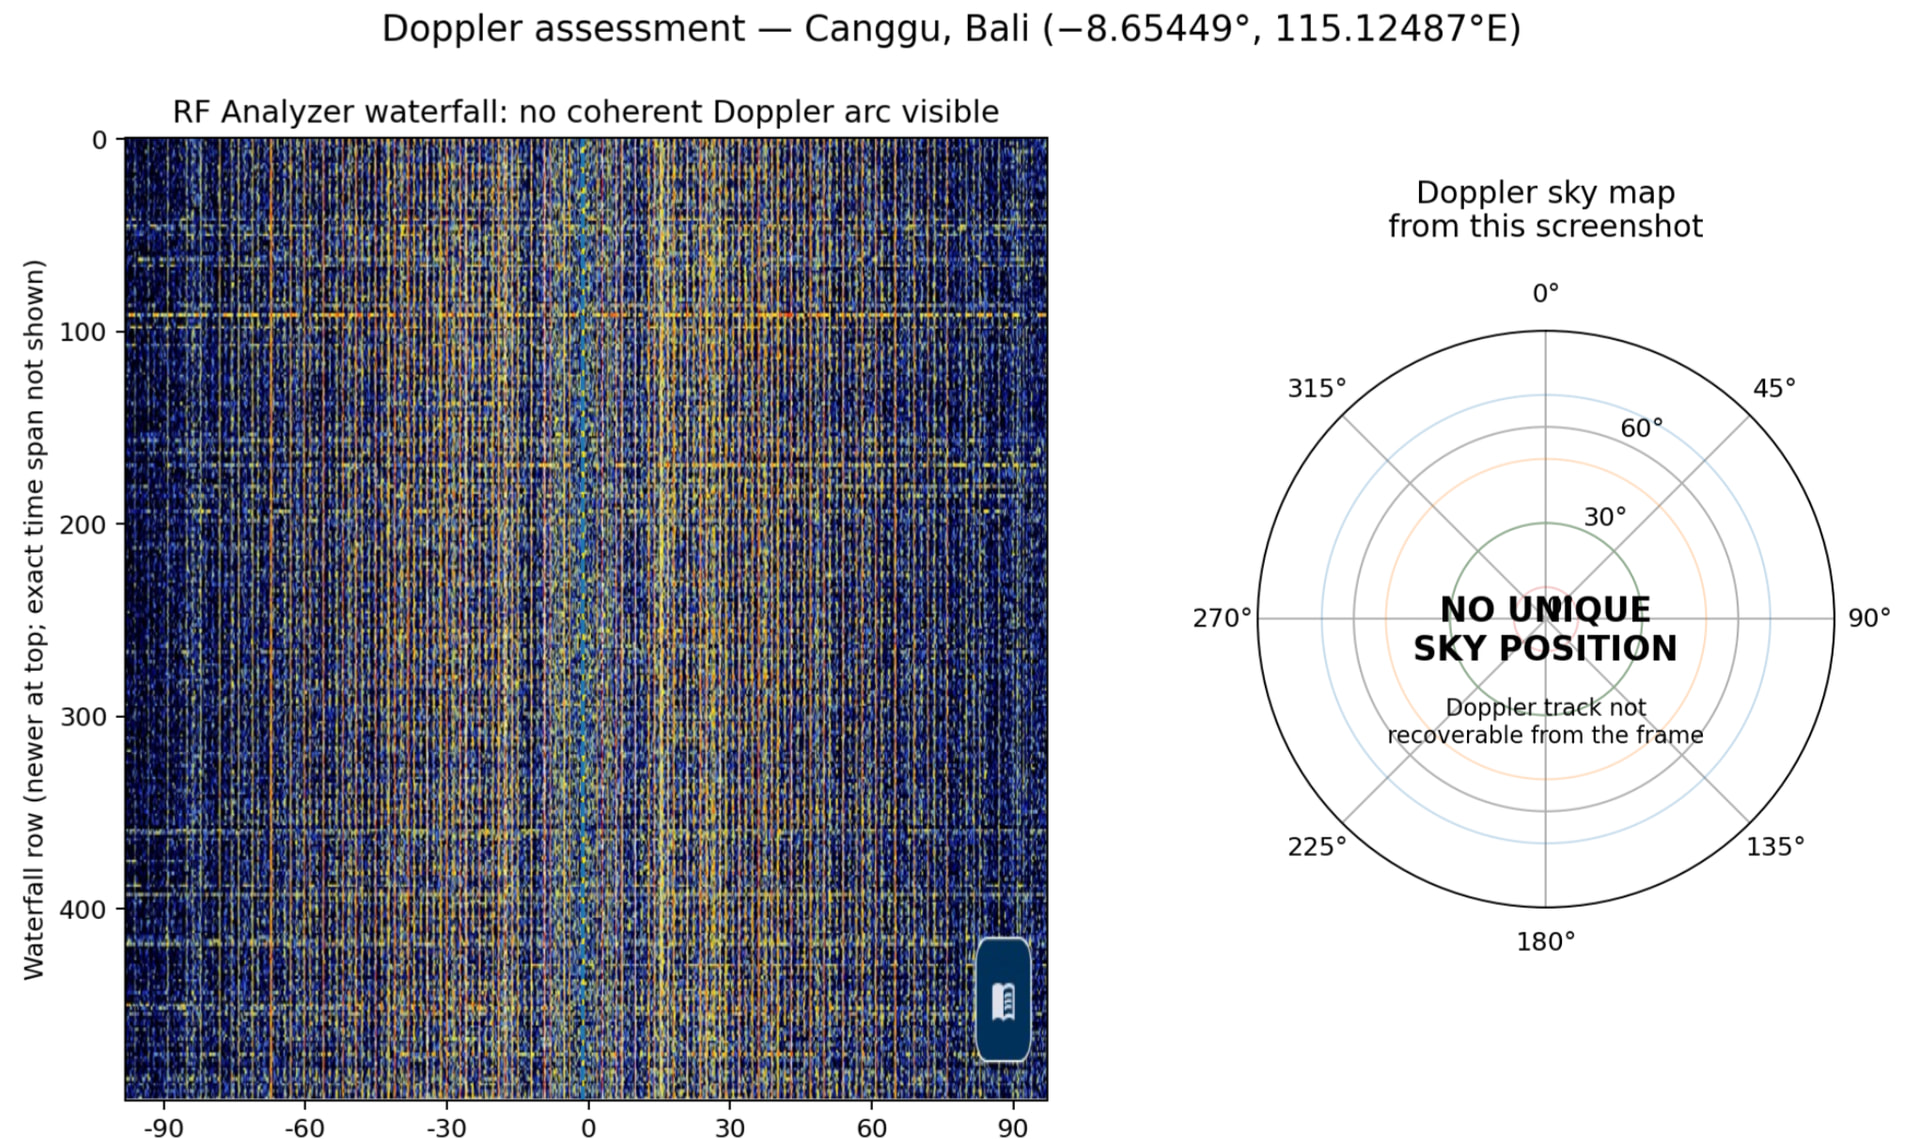
Making slow progress. This is a map I created with your script. I ran a topo earth view for a different perspective. I then did a doppler curve analysis on the spectro telemetry. As anticipated, not enough data to plot a curve for any sort of comparison with the Quasi-GEO sats. Still to early to rule out any of the candidates.

Their are still a few more options available that may help solve the origin of the mystery signal.

Cheer’s, Sami

1 Like

Hi Sami,

That topographic map and the Doppler analysis look fantastic! Thank you for sharing such a clear visualization.

As you mentioned, it’s still too early to rule out the candidates, but seeing it laid out like this really helps. If there is anything else Gemini can help with as you dig deeper into the remaining options, please let me know!

Cheers,

Yukio

Good to know. Thnx for sharing.

Cheer’s, Sami

1 Like