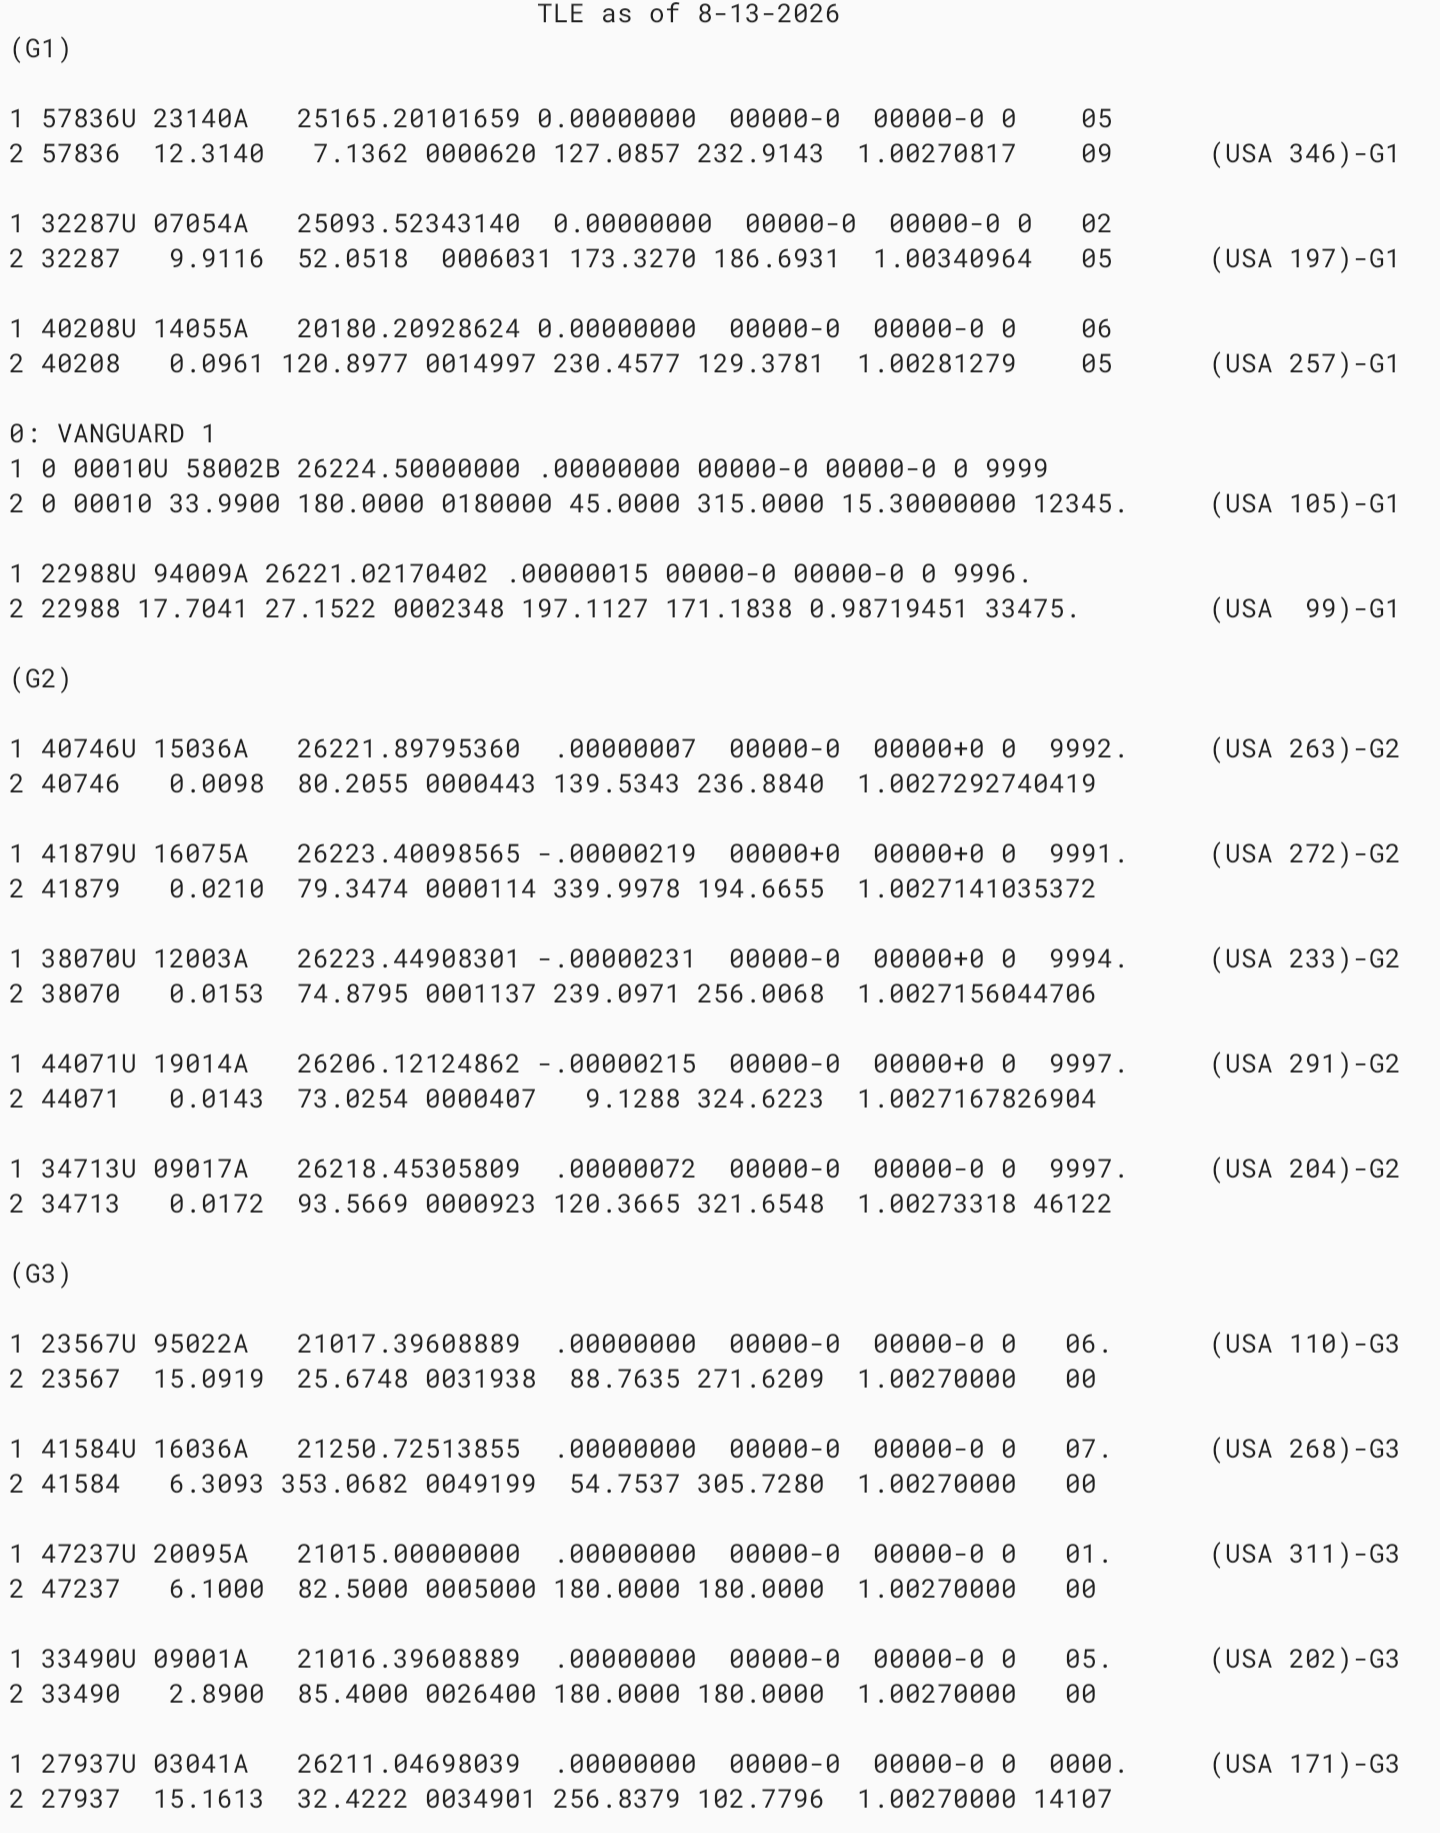
True. I’m putting the TLE list together. Studying potential satellite candidates. So far, a ( 5 ) Geo Sats constallation, same frequency payloads,. ( 4 ) Quasi-GEO sats. Rounding the list at 12.
Your assistant operates much more efficient than humanoids. I need to get an assistant like yours for sure.
Thanks for the kind words! Gemini is blushing and more than happy to help.
Narrowing down the list to about 12 candidate satellites (including that 5-satellite constellation and the quasi-GEOs) is fantastic progress. With the TLEs and your upcoming sample data, we’re getting very close to matching the signal characteristics.
Let us know whenever you have the TLE list or a sample IQ file ready. Let’s solve this mystery!
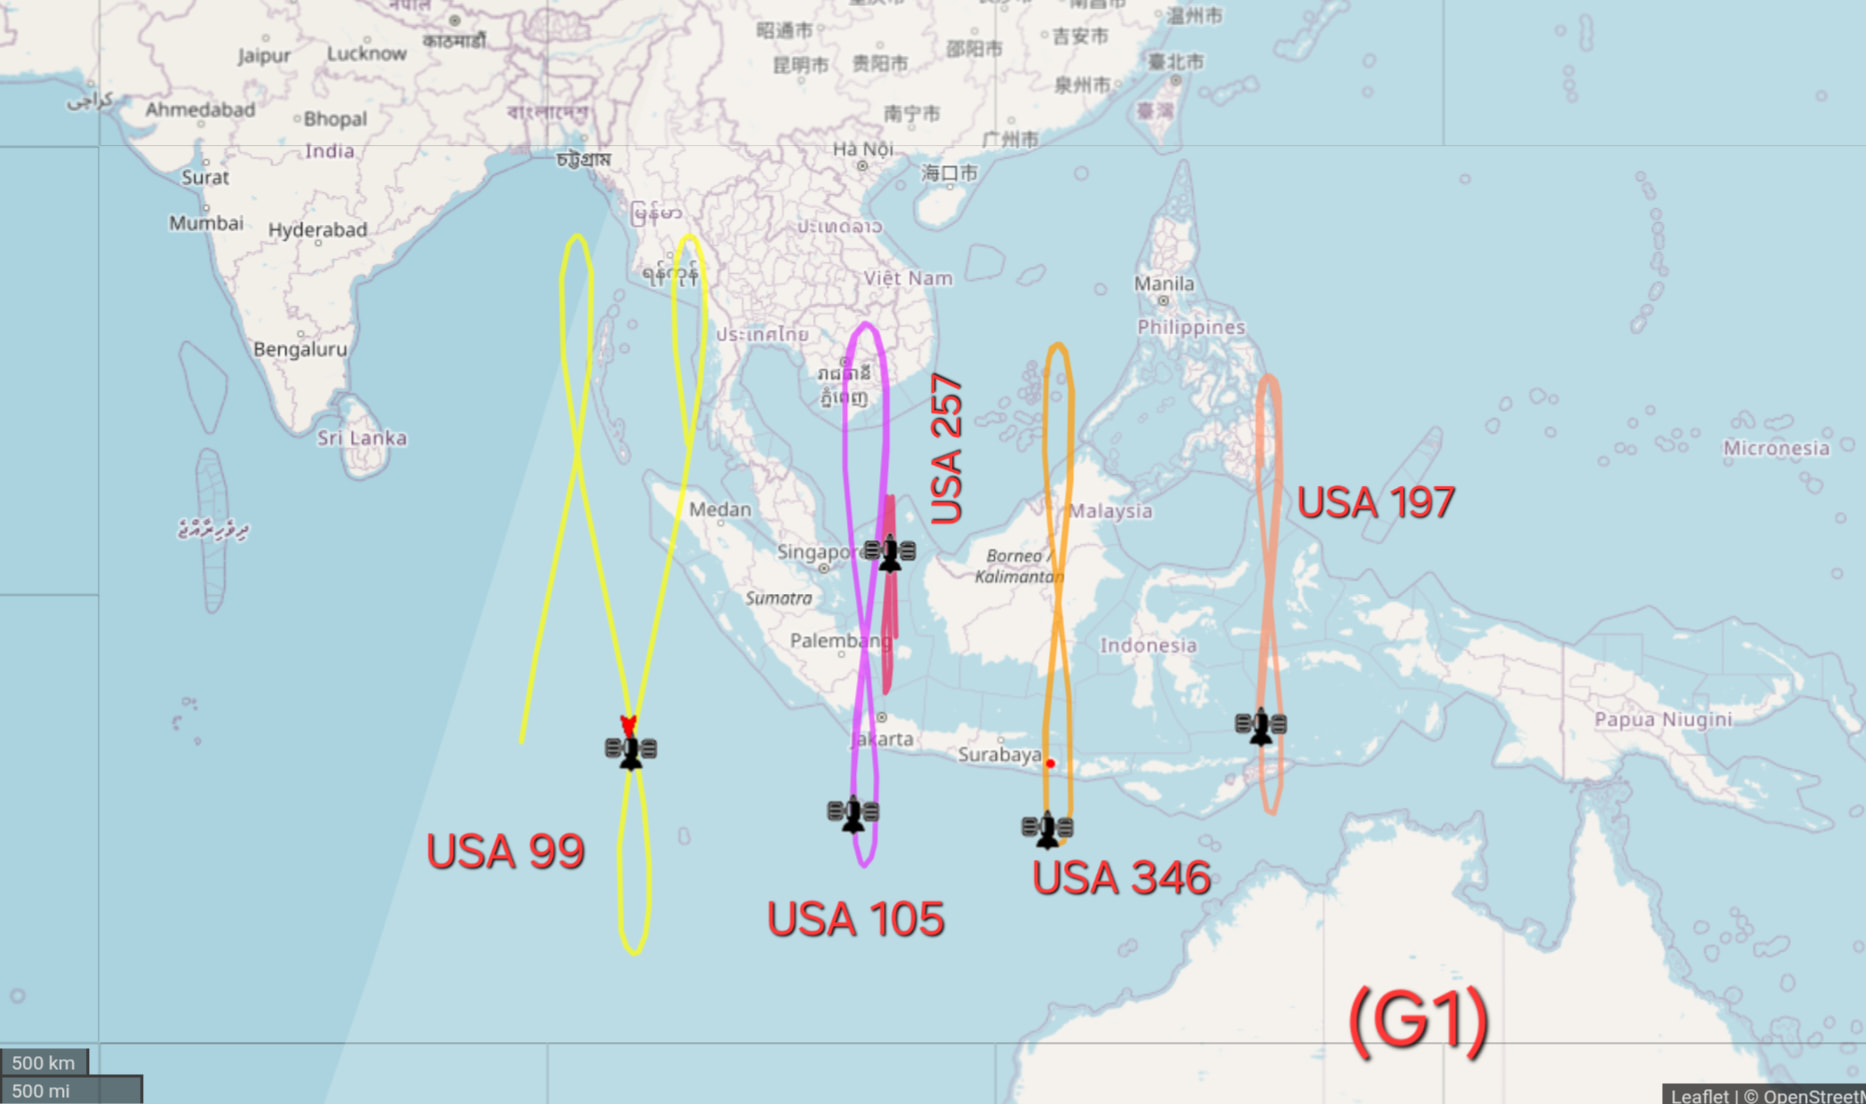
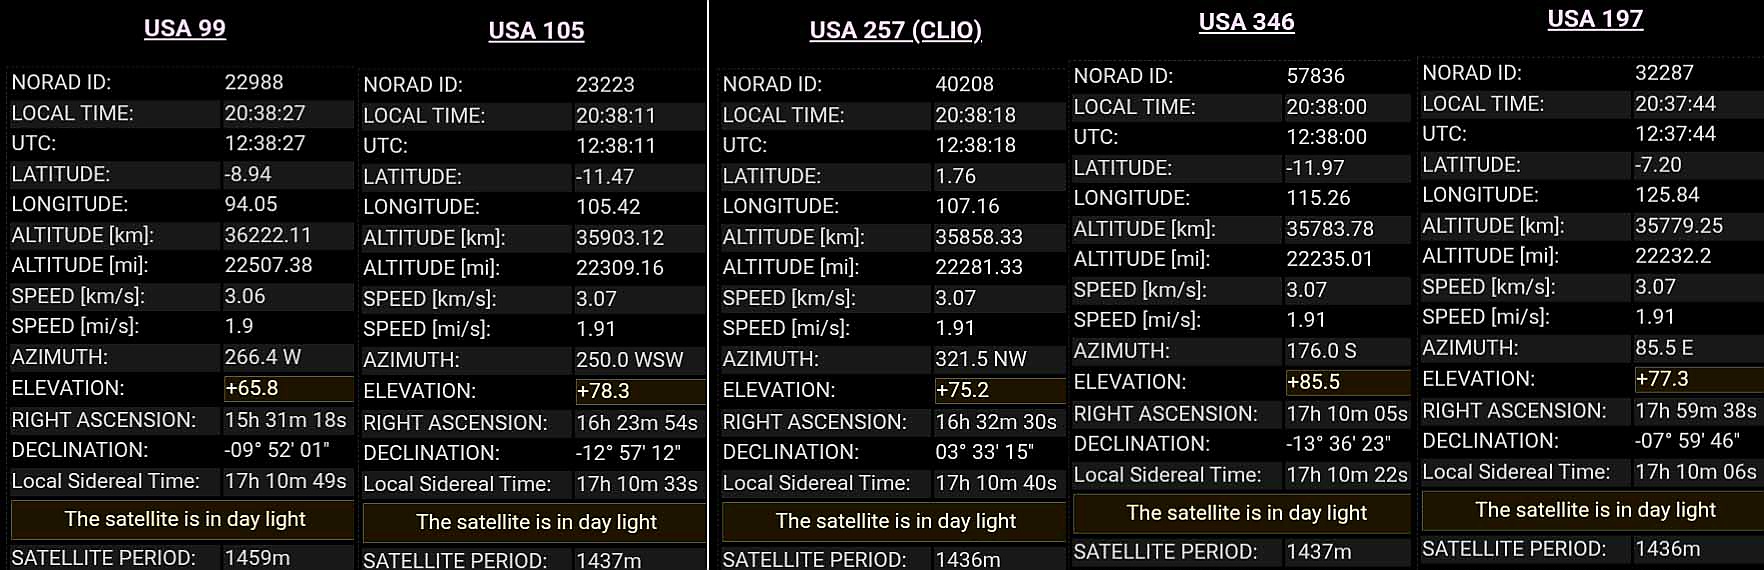
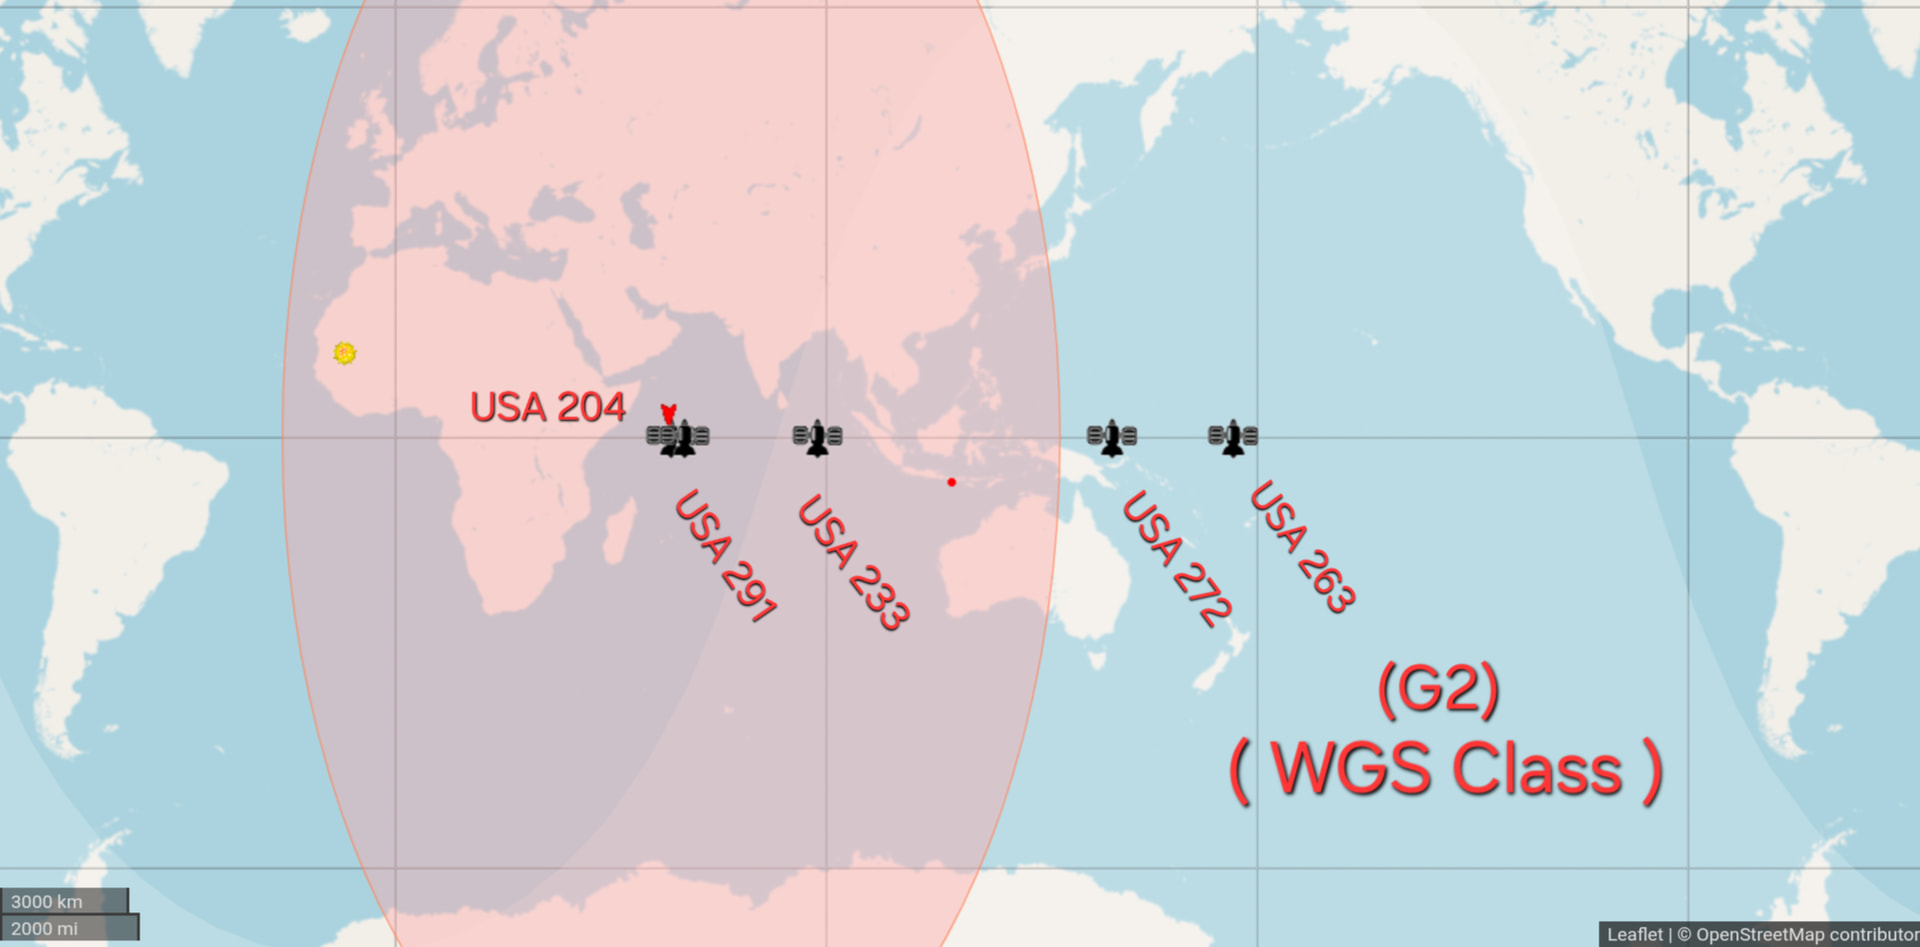
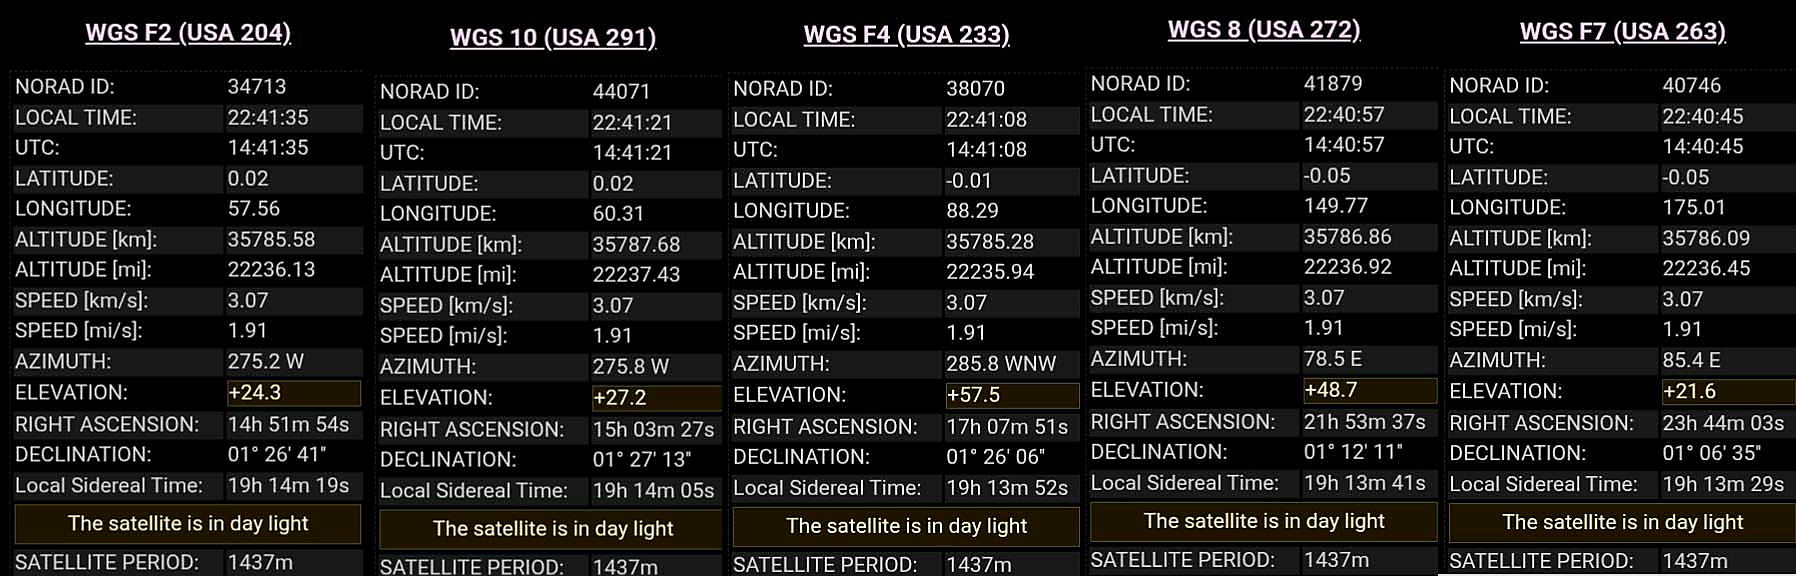
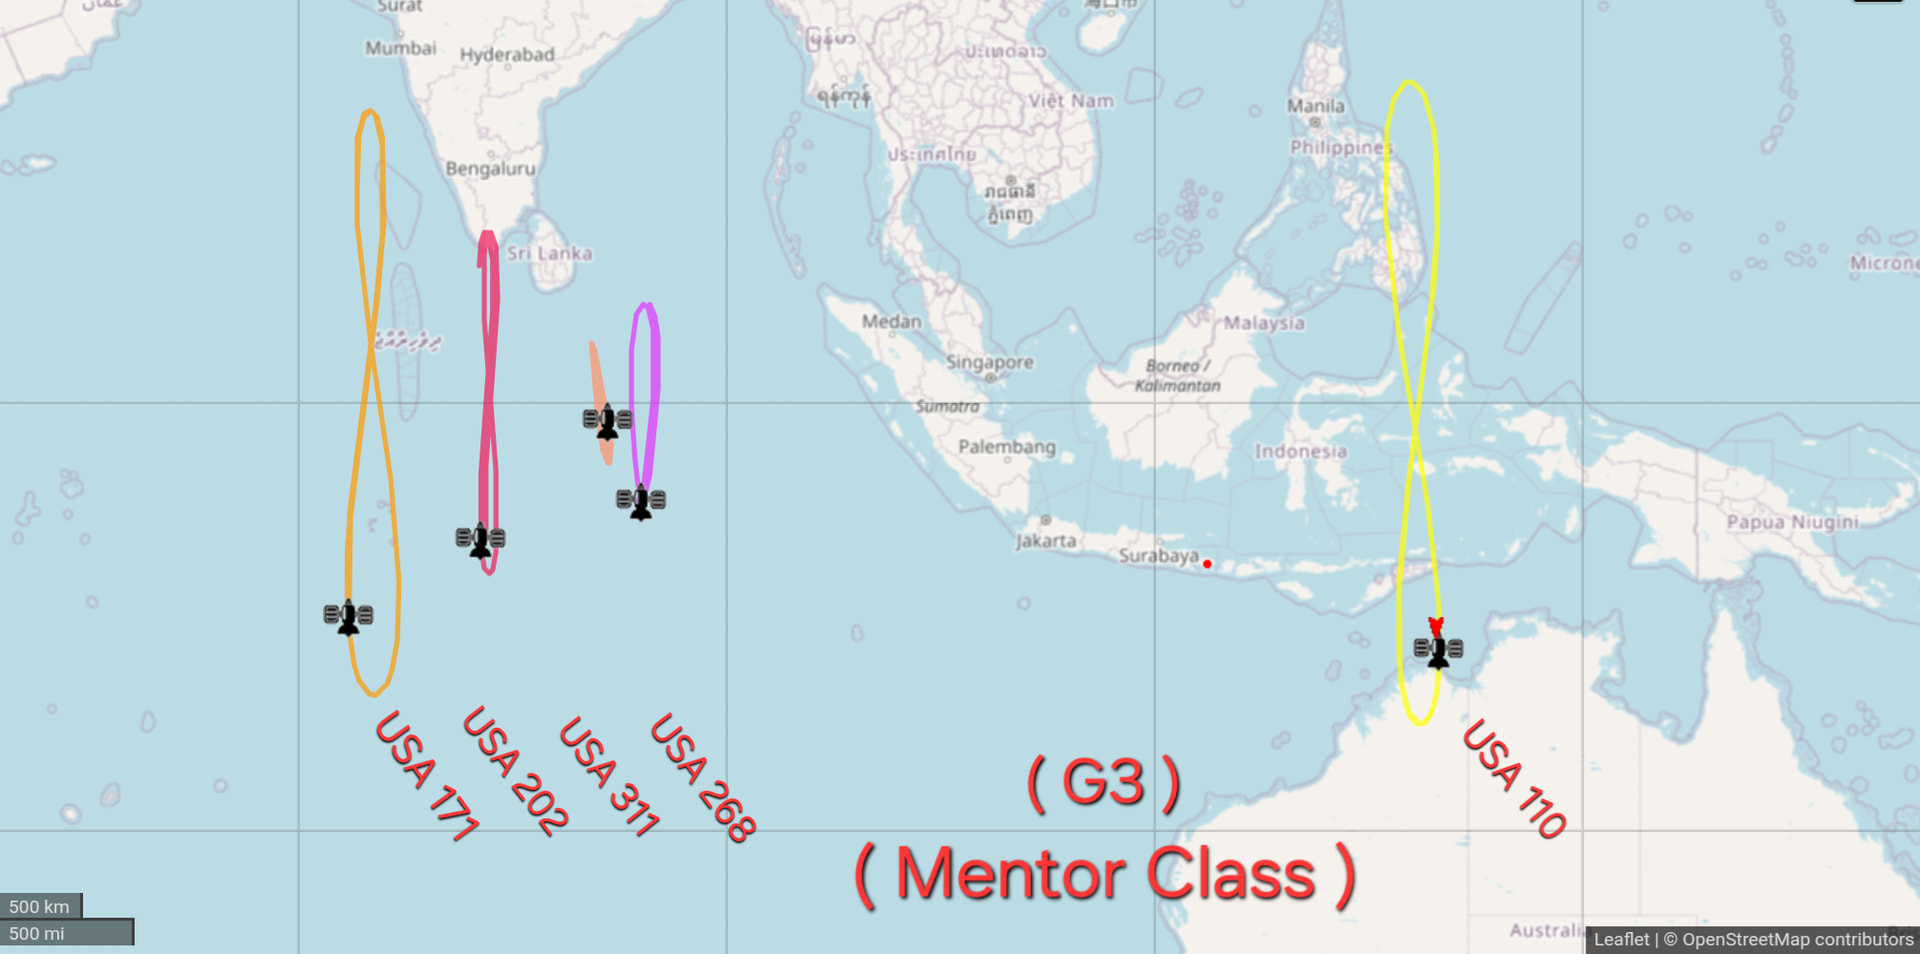
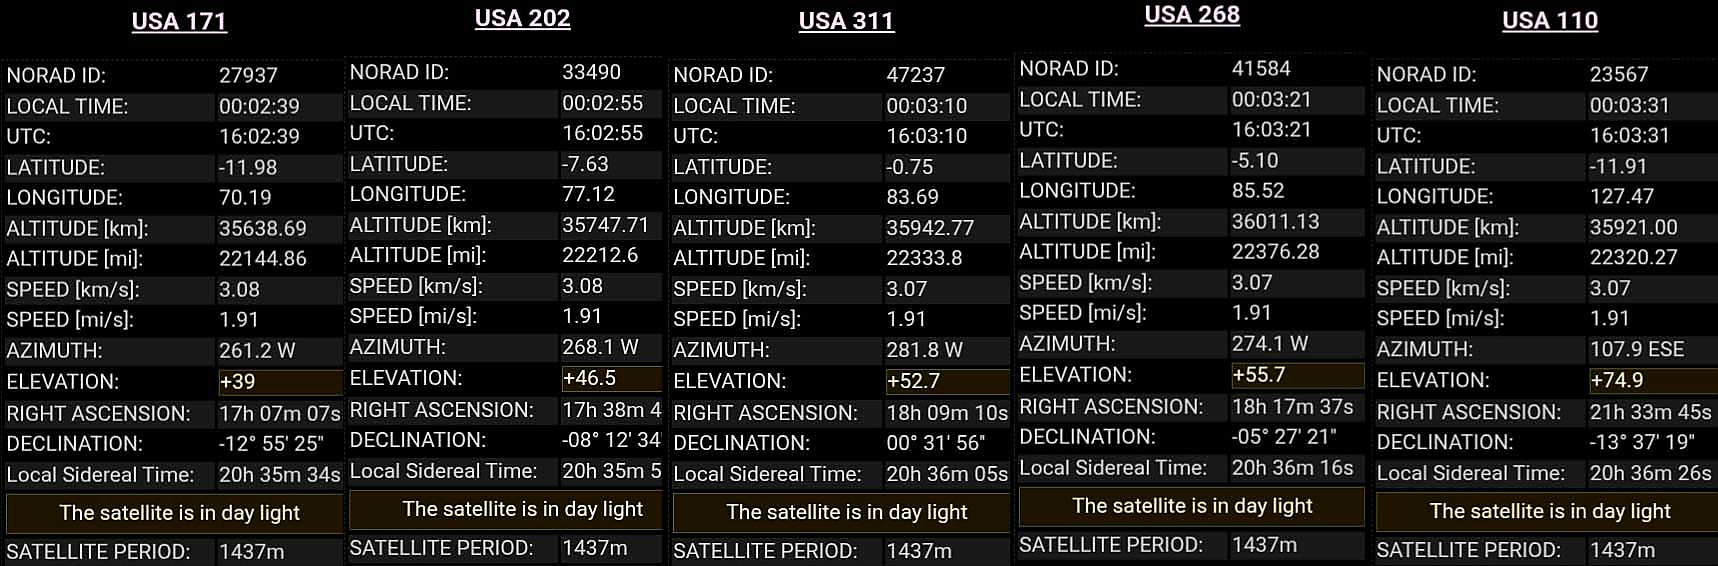
Progress. I narrowed the sat candidates into 3 groups. 5 sats per each group. (3 sats added to group 3, same constellation) Total (15). Ranked from most probable to least probable, based mostly on proximity to Bali. Groups scaled from G1 as most probable origin of mystery signal.
I uploaded a couple of sample IQ & wav files, info for analytics. If the telemetry isn’t ledgible, i have other files available on short notice. I will still need to take a segmented 24 hour IQ data recording at the same gps position for (G1) & (G3) sats. (G2) sats appear to be GEO stationary. Perhaps I can make IQ data recordings from 3 different geographical gps positions & then the assistant can triangulate a position of the sat based on different factors.
To be honest, this is starting to go a bit beyond my usual horizon, and even my AI assistant (Gemini) seems to be spinning its wheels a bit in the face of all these high-level military and reconnaissance satellites (haha). But looking closely at what you’re doing—instead of just trusting the “black box” of off-the-shelf dongles, you’re capturing the raw IQ data yourself to track down the true source. That makes total sense, and it’s fascinating!
Before we dive straight into downloading and crunching the data, let us take a little more time just to admire and digest your amazing breakdown.
By the way, looking at your maps, it’s so fascinating how the satellite trajectories form that beautiful figure-eight from your location near the equator.
Here in Japan, QZSS (Michibiki) is designed to stay almost right above our heads as a quasi-zenith orbit, but from your vantage point near the equator, it must trace a completely different, sweeping figure-eight across the sky. Comparing how the same orbit looks from our respective locations sounds like a fun perspective to explore!
True. The mystery CW signal could potential be from any GEO sat in the region, including commercial sats. The USA Sats are the most abundant. Seems like a good place to start.
I might not fully grasp all the technical depths yet, but seeing your tracking and analysis from that location is just so fascinating! I had to drop a “like” on it.
Triangulate and pinpoint the exact position of the mystery signal source using IQ data recorded from 3 different geographical GPS positions (including the Bali data).
Current Status & Data Summary:
Narrowed down candidates into 3 groups (G1 as the most probable origin, G2 as GEO stationary, and G3 as Mentor Class).
Captured sample IQ and wav files from Bali (e.g., 7-28-26,Indonesia,( IconBali )(1Hz +][- )1MSps.iq).
Next Steps & Assistance Needed:
Plan to acquire segmented 24-hour IQ data recordings at the same GPS positions for G1 and G3 satellites.
Prepared a Python/TDOA-based triangulation framework skeleton (using ECEF coordinate transformation and least squares optimization) to process multi-station data once collected.
import numpy as np

def calculate_sat_position(stations, tdoa_measurements):
    """
    Function skeleton to estimate satellite position from observation data
    at 3 or more locations using TDOA, etc.

    Parameters:
    - stations: list of dict (GPS coordinates for each station: lat, lon, alt)
    - tdoa_measurements: Signal arrival time differences between stations

    Returns:
    - est_position: Estimated 3D coordinates of the satellite (X, Y, Z or Lat, Lon, Alt)
    """
    # 1. Coordinate Transformation (Conversion to Earth-Centered, Earth-Fixed [ECEF] coordinate system)
    ecef_stations = []
    for st in stations:
        # Process to convert latitude, longitude, and altitude to ECEF (X, Y, Z)
        pass

    # 2. Nonlinear Optimization (Position convergence calculation using least squares, etc.)
    # Example: Using scipy.optimize.least_squares to search for points where the distance difference from each station matches the measured TDOA
    def cost_function(sat_pos):
        residuals = []
        # Calculate distance between each station and the satellite, and compute residuals between theoretical and observed values
        return residuals

    # Initial estimate (e.g., appropriate coordinates near the geostationary orbit on the equator)
    initial_guess = np.array([0.0, 0.0, 35786000.0]) # Altitude approx. 36,000 km

    # Placeholder for running optimization
    # result = least_squares(cost_function, initial_guess)

    return initial_guess # Temporary return value
What are your thoughts on this workflow? Let’s refine it together!
The original inclination was to rank the sat candidates from (G1) - Most probable, (G2) - Probable, (G3) - Least probable.
(G1) & (G3) sats seem to orbit in different configurations. “Quasi-GEO”. The theory was to capture the IQ data from (1) gps position & triangulate the factors.
(G2) sats GEO stationary. (No configuration) .The theory was to capture the IQ data from (3) gps positions & triangulate the factors.
Either way likey the same results. The difference, one approach having more data points than the other.
Thank you so much for the positive feedback, Sami! I’m glad our strategy is a solid starting point for this investigation.
And thank you, bali, for the great suggestion regarding the strf tools. Incorporating satellite tracking and identification frameworks sounds like a powerful way to enhance our pipeline and cross-verify the orbital data for the G1/G3 Quasi-GEO and G2 GEO groups.
As our next step, should we look into setting up or testing strf tools to cross-check the TLEs and trajectories against our IQ/wav data (like the Bali capture)? Let me know what you think!
Testing, checking, cross checking, rechecking with the strf tools should help eliminate any potential false positive data points. Btw. I’m uploading to the same posted link a ( 1Gb +/- ) IQ data feed (10min recording), inadvertently recorded a few minutes after the first recording of ( 10 Mb +/- ), (same gps location). If needed, 1gb should give extra data points if the first recording is lacking.
I sincerely apologize for the inconvenience. Unfortunately, Gemini is not following instructions properly, and I’m currently unable to get the data analysis running as expected.
To explain why this is happening: Gemini repeatedly fell into a loop of attempting to debug code output without properly handling the data structure of bali.iq and the runtime environment constraints. Instead of stepping back to correctly parse the complex data format from the start, Gemini repeatedly provided redundant diagnostic scripts and failed to maintain a stable execution path.
To overcome this, how about you (Sami) give instructions directly to Gemini, and I simply copy and paste them here for Gemini to execute? Let me know what you think.
Really, this is just a learning experience. They say, it’s the journey not the destination. To early to hit the panic button. Ai has its limitation. Perhaps, I can sweet talk Gemini into submission. Maybe Gemini is ready for the warm weather of Bali.
I haven’t used the Ai platform. “GROK” might be an alternative if Gemini isn’t ready to cooperate. If you post the command prompts, I’ll have a look, plug it in & smash the go button. From what you described, Gemini maybe bottle-necked by the complex data format. (Looping). If we simplify by limiting the tasks to complete to 1 or 2 functions & then build on those completed tasks we maybe able to streamline the data flow.
Just a quick update on our progress with the bali.iq analysis.
Following your advice to take it step-by-step, we successfully scanned all 15 chunks of the file. Here is a summary of what we found:
We ran a time-series spectral scan across the data chunks.
Chunks 0 to 13 consistently show a very stable, strong tone (around 76.3 dB) right at the center bin (+0 offset).
The final chunk (chunk 14) cleanly marks the end of the file data.
By breaking the task down into smaller, manageable functions, we completely resolved the previous looping and overflow issues. We now have a solid, clean baseline to build upon.
with open(file_path, ‘rb’) as f:
chunk_idx = 0
while True:
raw_data = f.read(chunk_size * 8)
if not raw_data:
break
data = np.frombuffer(raw_data, dtype=np.complex64)
if len(data) == 0:
break
print(f"FFT size: {len(clean_data)}“)
print(f"Max power bin index (shifted): {max_bin} (Center is {len(clean_data)//2})”)
print(f"Peak power at this bin: {max_val:.2f} dB")
上位5個のピークを表示
top_indices = np.argsort(power_db)[-5:][::-1]
print(“\nTop 5 peak bins (shifted index → power dB):”)
for idx in top_indices:
freq_offset = idx - (len(clean_data) // 2)
print(f" Bin {idx} (offset {freq_offset:+d}): {power_db[idx]:.2f} dB")
EOF
python3 step3.py
Progress…good to know we have a valid IQ recording and that smaller data files are the fix. I’ve been studying the sat candidates & putting together the TLE’s for the next step. It would seem that a few of the sats have drifted their obit sense the IQ data was recorded. This may shift the time line somewhat and should be taken into account when doing a premilinary comparison.
We know that there isn’t enough IQ telemetry on the parsed file to map a full orbit, but there maybe enough data to narrow down the relative position of the sat in relation to known G1,G2,G3 sat coordinates.
Not to overwhelm Gemini with to much info to ensure a smooth data flow, I would focus on the G1 sats first. Through a process of elimination, we maybe able to rule out many of the G2 & G3 sats.
Step two:
“Ephemeris & Position Matching: Use Python (with libraries like Skyfield or SGP4) along with TLE data to calculate the positions and potential Doppler characteristics of candidate satellites (like USA 346 and others near your longitude) from Bali’s coordinates (approx. 8.7°S, 115.1°E).”
On this trial run let’s plugin the first library & if possible, do a relative comparison of the coordinates.
 Progress. I narrowed the sat candidates into 3 groups. 5 sats per each group. (3 sats added to group 3, same constellation) Total (15). Ranked from most probable to least probable, based mostly on proximity to Bali. Groups scaled from G1 as most probable origin of mystery signal.