As the title suggests, I need help in understanding and interpreting .oem (orbit ephemeris messages) files that are downloadable from the satellite tracking and visualization site Wayfinder by the private company Privateer. Moreover, I want to understand a few other things about that site;
Where does it get the .oem files from? If I understood correctly, it’s only a 3rd party program that summarizes/visualizes the totality of all the manmade satellites orbiting the earth but gets the actual data from somewhere else.
Is it accurate, and reliable?
(Not sure if this is the appropriate category or if this inquiry is relevant to the community, but I have not found any other more appropriate forums. Please do let me know, and thanks in advance.)
From the filters it looks like that gets orbital data from planet, see-sat, space-track and vimpel.
I guess It depends on the application you want to use it. Two points to have in mind, the size of the dots representing satellites it’s not accurate, in reality they are smaller. The other one is how often the orbital data get updated.
For open-source solution for visualizing the orbits I would suggest gpredict.
In each ephemeris entry in the .oem file, there are 6 columns: x,y,z positions, and x,y,z velocities. What’s the ‘origin’ (0,0,0) in this system/where is it located?
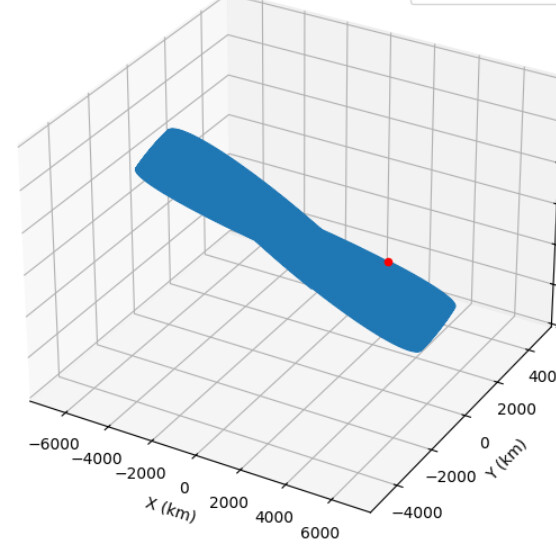
For visualizing the orbits, what is the difference between using gpredict, and just simply plotting the position coordinates directly with numpy+matplotlib? I did the latter, and I still got a result of some sorts. In the pic below, I got a static 3d graph of all the info to be plotted from starlink-1010s oem file that i downloaded around mid-september.