[Project Update] Open Source Monitoring for TVAC (Turbovac 1350 iS + Grafana) 🚀

Hi everyone,

A quick update (and a bit of a show-off) on the progress we are making with the Thermal Vacuum Chamber (TVAC) setup.

As anyone who has dealt with industrial equipment knows, their interfaces are often… “old school.” Our vacuum pump (Leybold Turbovac 1350 iS) came with a proprietary web interface that just didn’t cut it for the remote monitoring and logging we need at Libre Space.

So, we decided to build our own stack! :hammer_and_wrench:

The “Hack”:

We reverse-engineered the pump’s communication protocol (HTTP requests over port 8080). We discovered that this specific version (the iS model) uses a different memory map than what is found in the standard manuals.

After some digging (aka brute-forcing IDs and packet sniffing), we found the correct registers for pressure (IDs 4616/5616), rotation speed, current, and temperatures.

The Stack:

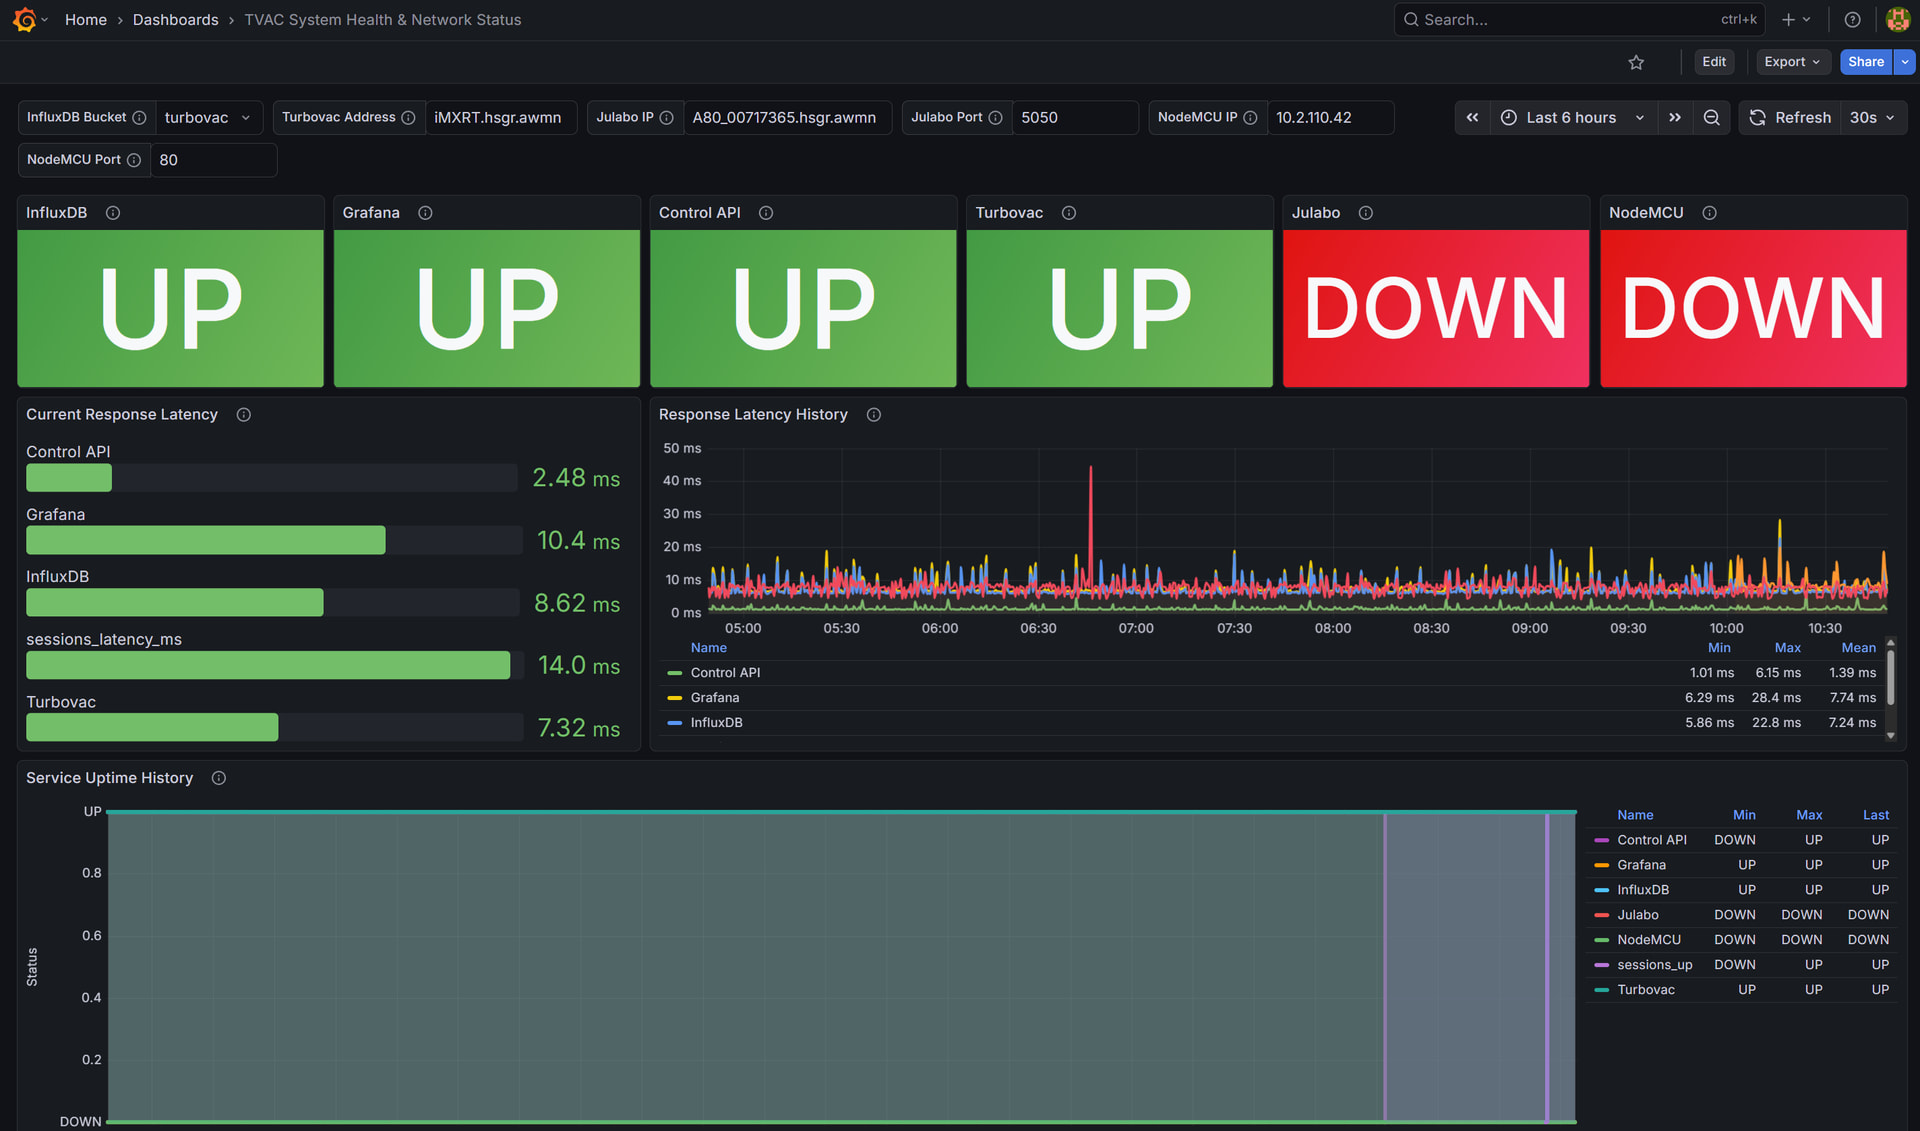
The whole system is now running on a Raspberry Pi (thanks @manthos !) via Docker Compose and includes:

  • Collector (Python): A custom script that talks directly to the pump’s API (bypassing login/session timeouts).

  • InfluxDB: For time-series data storage.

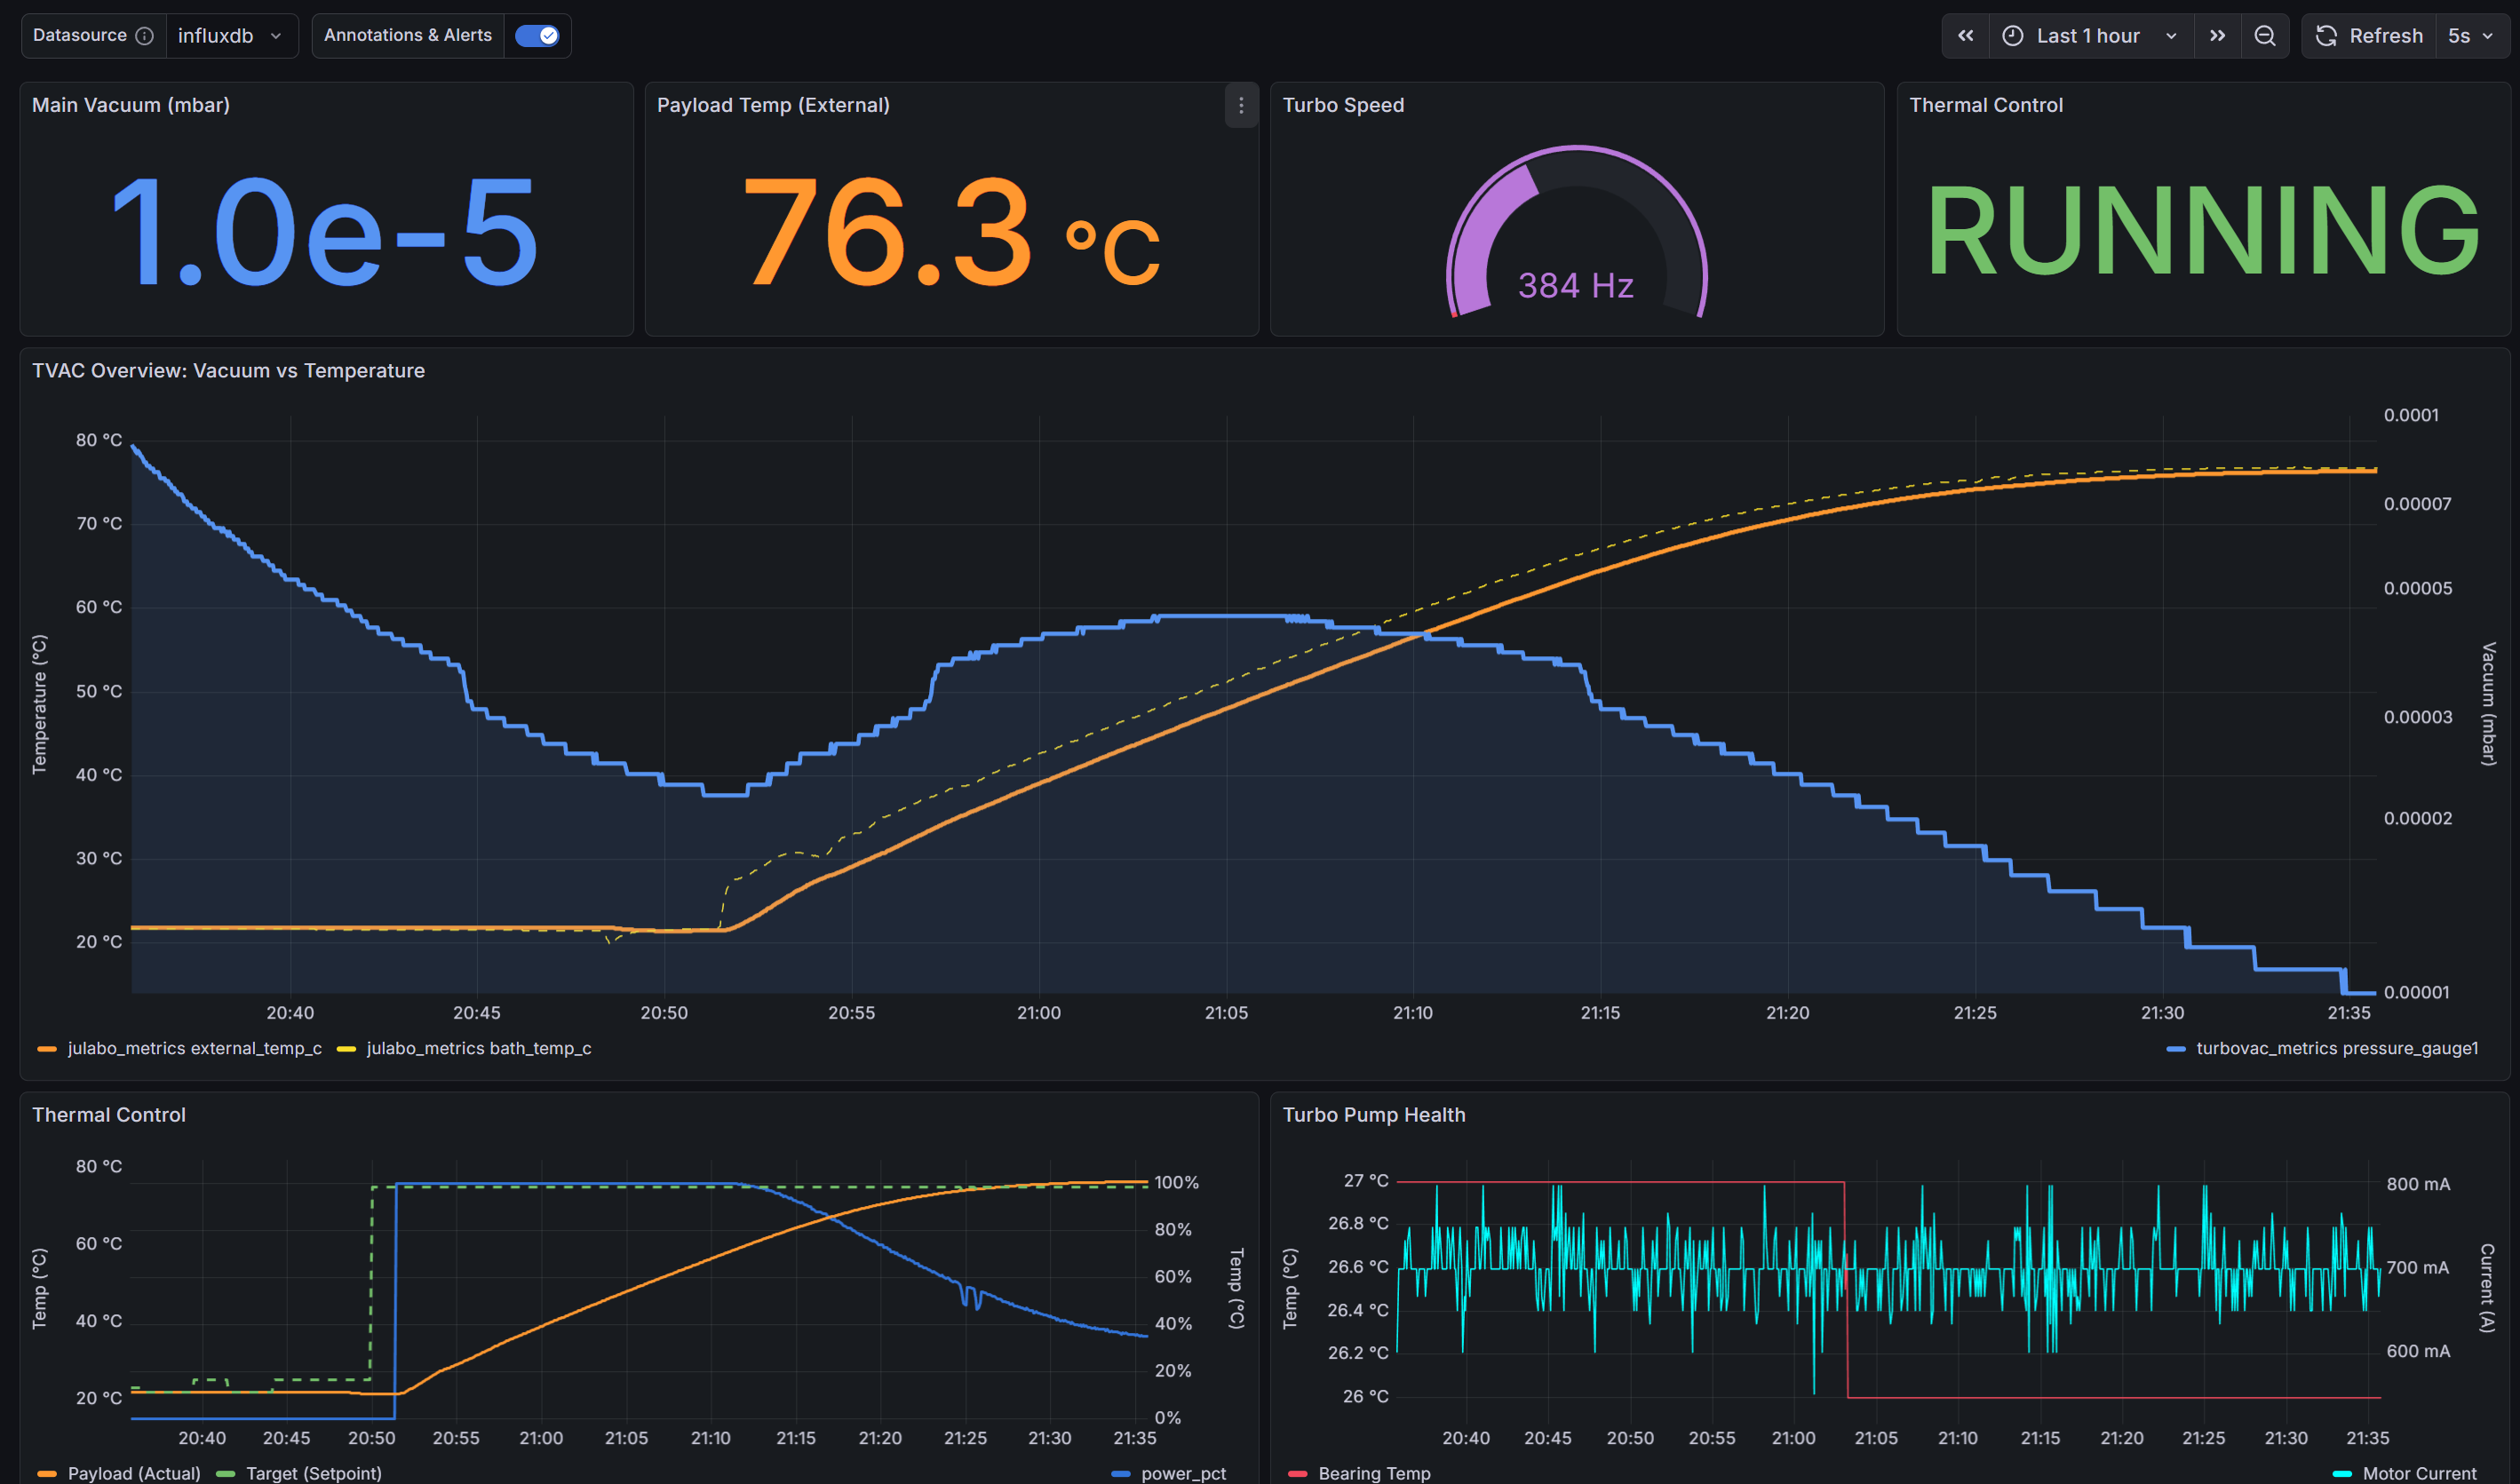
  • Grafana: For visualization (featuring logarithmic scales for vacuum pressure and traffic light thresholds for bearing temps).

  • Cloudflare Tunnel: For secure remote access at tvac.librelabs.space.

Work in Progress & Next Steps:

This project is very much Work in Progress. Basic pump monitoring is fully functional, but the next big milestone is temperature control.

:bullseye: Goal: We want to hook the Julabo circulator (which controls the chamber temperature) into the same dashboard, so we have a complete picture (Pressure + Temperature) in one place.

Code / Contribute:

The code is, of course, open source and available here:

:backhand_index_pointing_right: https://gitlab.com/pierros/tvac-monitor

If anyone wants to take a look or suggest improvements (especially if you have experience with Julabo protocols), feel free to jump in!

Happy Hacking! :satellite:

3 Likes

its a pro setup

Following up on my previous post we successfully integrated our Julabo Presto thermal controller into the same stack, effectively turning our passive monitoring dashboard into an active “Mission Control” for the chamber.

Here is what’s new since the last update:

1. Data Fusion: The “Outgassing” Plot :chart_decreasing:

Previously, we just saw pressure dropping. Now that we are pulling data from the Julabo (via Ethernet), we can overlay Vacuum Pressure (Logarithmic) against Payload Temperature (Linear) on a single pane.

This is critical for bake-outs: we can now visually correlate a temperature ramp-up (Orange line) with a specific pressure spike (Blue area), giving us immediate feedback on outgassing events without guessing which variable caused the change.

2. From “Read-Only” to actionable :control_knobs:

Grafana is fantastic for visualization, but it doesn’t support sending commands out of the box. We didn’t want to run a separate proprietary app just to change the temperature, so we built a microservice workaround:

  • The Backend: A custom FastAPI container running on the Pi that accepts commands (e.g., POST /set_temp/80.0).

  • The Frontend: We injected a custom HTML/JS panel directly into the Grafana dashboard.

This allows us to Start/Stop the circulation pump and set target temperatures directly from the web interface, keeping everything in one place.

The full stack (InfluxDB + Grafana + Collectors) is stable. Updated code is pushed in the repo!

Ad astra! :rocket:

5 Likes

Third update — Session Management, Payload Sensors & More

Following up on the previous posts (#1 reversing the Turbovac protocol, #2 adding Julabo control), the system has grown quite a bit since — thought it was worth sharing the full picture.

What’s new:

NodeMCU payload sensor array — An ESP8266 running custom firmware handles a 1-Wire DS18B20 bus (up to ~20 sensors) and exposes temperatures over HTTP. The collector discovers sensors dynamically, so you can add sensors to the payload without touching any configuration. Sensors are sorted by ROM address so sensor_0 always maps to the same physical device across reboots.

System health monitoring — A lightweight collector probes every service (InfluxDB, Grafana, the control API, and all three external hardware endpoints) via TCP/HTTP every 30 seconds and writes up/down status + latency to InfluxDB. There’s a dedicated Grafana dashboard for this — useful during integration when you’re not sure whether a gap in data is the sensor, the network, or the Pi.

Session management — Probably the biggest addition. We now have a proper notion of experiment sessions: named runs with a start/stop lifecycle. Every InfluxDB write from every collector is tagged with the active session_name, so you can filter any Grafana panel to a specific campaign with a dropdown. We built a standalone admin dashboard for this (served at port 5002, not Grafana — it needs to be actionable) with create/start/stop/delete, a live elapsed-time ticker, and a share modal that generates: (check it on https://sessions.librelabs.space )

  • A Grafana deep-link pre-filtered to the session’s exact time window and session name

  • CSV and JSON exports of all InfluxDB measurements from that session

Data collected outside a session is tagged unsessioned rather than dropped, so you don’t lose anything if you forget to start a session before a run.

The whole thing is still fully containerized and the session manager is a single FastAPI + SQLite service — no extra databases. Export uses InfluxDB’s raw annotated CSV format, so it opens cleanly in pandas or any spreadsheet program.

The code is on GitLab as before — README has been fully updated with the architecture diagram, full service table, data model, and API reference.

Happy to answer questions or compare notes with anyone doing similar test campaign data management.

1 Like