I have been thinking about this for some time and tried to figure it out on my own, but was unable to do so.
I’m sure the answers are obvious, but I am just missing it.
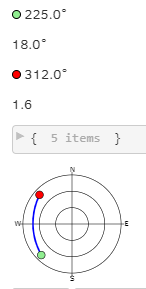
First I would like to ask for some clarification as to what the max, set and rise parameters included in the observation means, my understanding is that the max is the maximum EL angle the rotator will approach during the observation and the set is the AZ angle that the rotator will start the observation at and the rise is the AZ angle the rotator will end the observation at. Is my understanding correct?
Additionally, is there any way that I can determine the polar function used to plot the curve?
The reason I ask is that I would like to be able to create some sort of “monitoring dashboard” for my rotator as it is doing an observation including the polar plot and the rotator position at x time during the observation.
As of now, I have been able to determine the obvious, the set and rise are plotted at their respective degree, however, what does the radius of the polar coordinate represent? and how is the curve plotted between the two polar coordinates.
Forgive me if I am lacking some fundamental knowledge regarding polar plots as it has been a while since I have had any experience with them.
Correct! By changing the min-horizon station setting during scheduling these azimuths will be modified accordingly.
Sure, SatNOGS is open source! The polar plot is generated by the javascript calcPolarPlotSVG function and this html template. Ideally this method could be extracted into a re-usable element using Web Components.
Cool idea! If you like terminal UIs there is also the SatNOGS Monitor written in rust.
The radius coordinate represents the elevation of the satellite as seen from the station at the given azimuth coordinate. So 90° elevation is at the point in the center (radius coordinate zero), and 0° elevation is on the outer circle. The two circles in-between have 30° increments.
The blue curve in-between the track endpoints is calculated by propagating the satellite orbit using satellite-js in the browser.