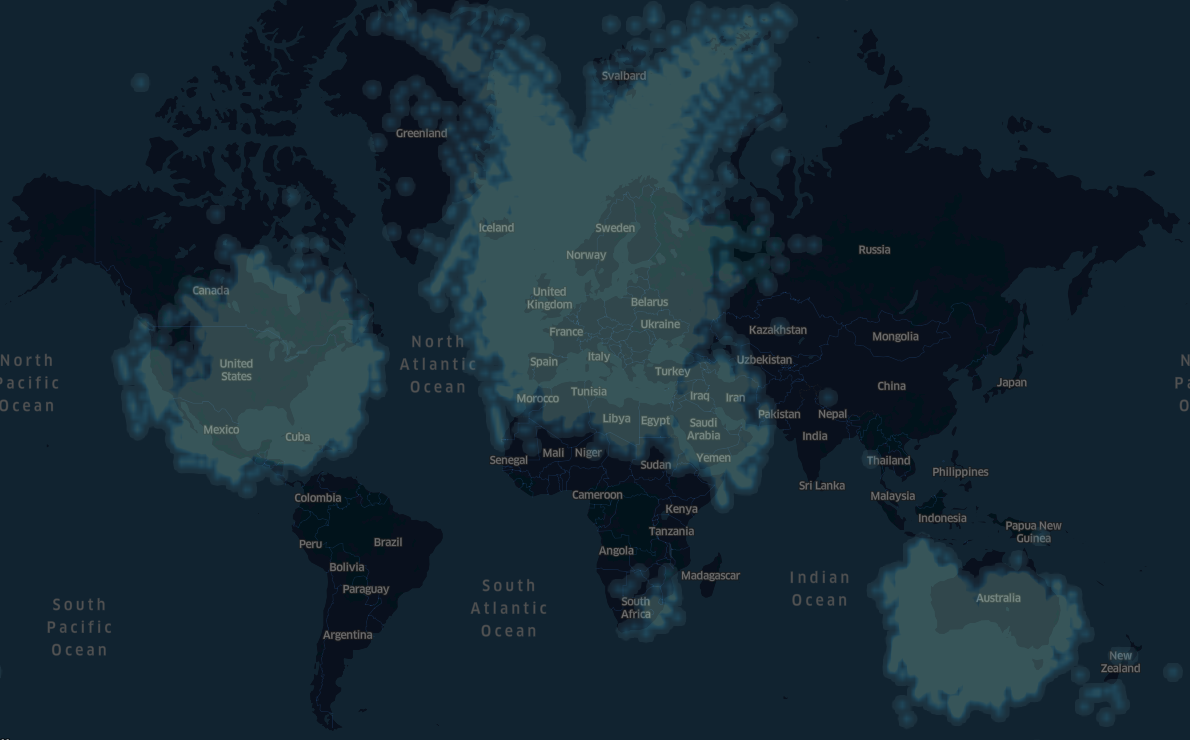
Starting on 27th August 2017 from observation 14410 network was able to demod data. Almost 1 year demoded data day by day with different colored trails which show the satellite height:
The video was created with the help of kepler.gl. You can perform your experiments by downloading this json file (link to external file hosting service) and go to kepler.gl demo and load the downloaded json file.
For example try to increase the 1 day period in animation… or remove this filter and use heatmap instead of point. Check the data which contain lat/lon/alt of satellite, time and satellite name.
Disclaimer from these data points are missing NOAA and SSTV ones, also few of the points are invalid demoded data.
Feel free to share here the results of your experiments.
Special thanks to @manthos for this idea and letting me know about kepler.gl!
I tried to export a similar video, however the data are so many that the animation is not smooth enough. I’m going to check other solutions but this it may take a while, hopefully until OSCW. If someone wants the data to try, let me know!
I could take a try. I could generate a CZML file for it. And then take a recording. (Or even try and do some rendering of it myself to record it with out CesiumJS.)
The last time I tried to add all the data, I couldn’t run the animation. However loading static data on the map was possible. I’ve also another idea for generating animation but it will take some time to implement and run.
If you have the data in the same format in a CSV as last time I can run that thru my animation code from last time. Granted it doesn’t look as cool as the other one but its something.