how to read the graphic? i try with this step:
- created a tle file in same directory contain:
0 OBJECT-XH
1 65732U 98067XL  25277.95744807  .00079735  00000-0  12102-2 0  9999
2 65732  51.6311 122.7344 0000908 251.3090 108.7802 15.53887789  2427
- and running this command:
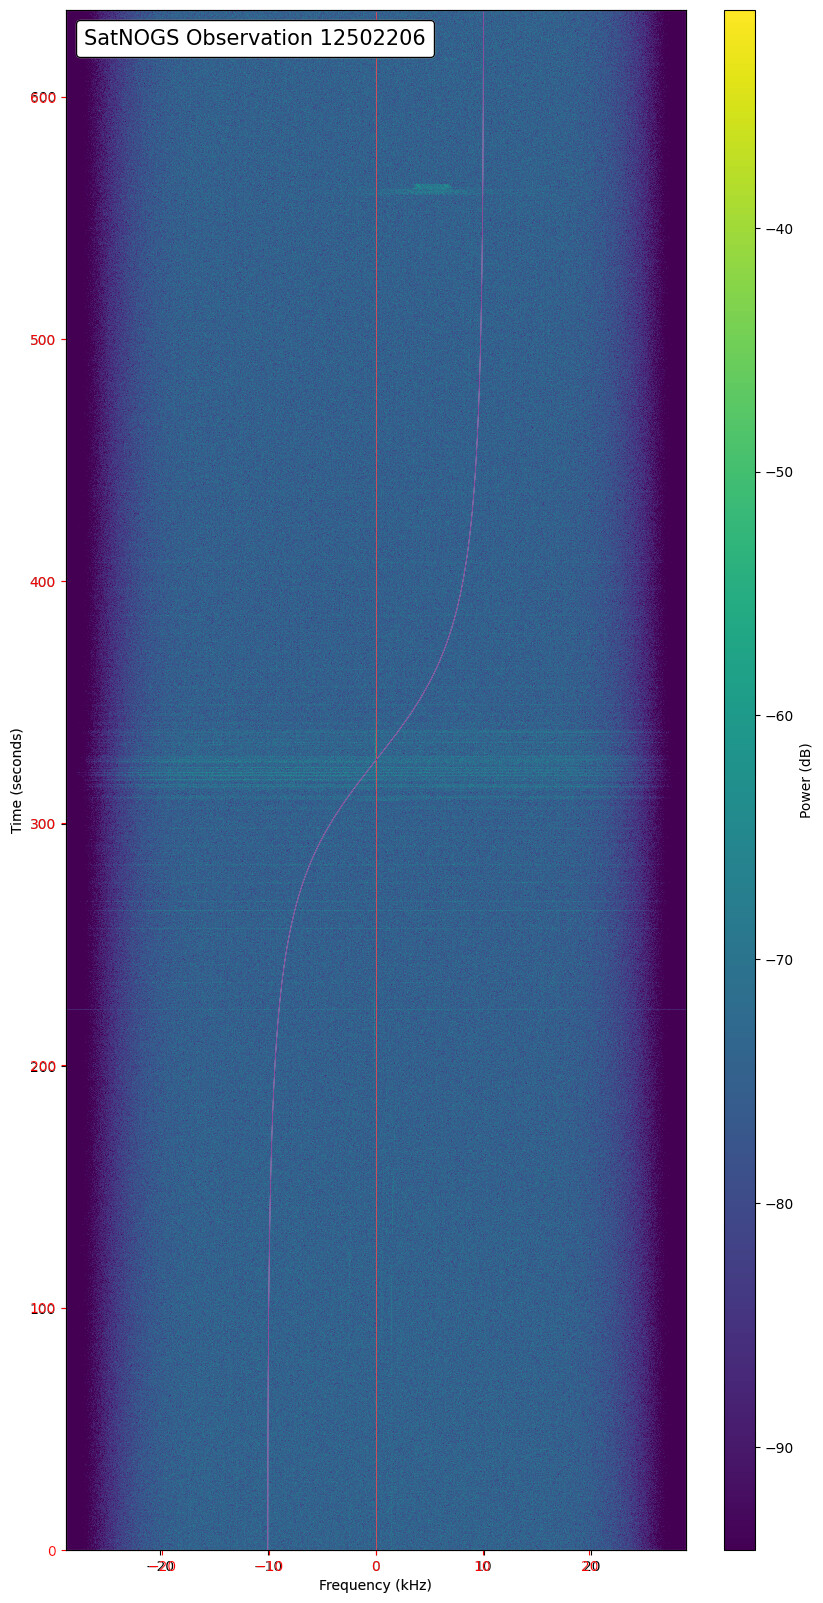
./ikhnos.py -r 29.0 -v 12502206
result: