Hello,
I recently noticed that some observations (e.g. Observation 5839141) from my station are marked ‘failed’ even though the observation contains a waterfall and the sound recording. Is it a bug?
1 Like
I’m not sure how it got marked, but to me that one looks like it should be marked “Bad” not “Failed”.
This happens automatically when the audio duration is at least 1 minute different from the scheduled duration. In the linked observation the scheduled duration is 4min 58s and the audio is 3min 28s.
This difference usually happens when there are lost samples, samples that the cpu can not handle. The reason behind that tends to be a high sample rate or high cpu temperature that force cpu to run in lower frequency and lose samples or not good power supply which has the same effect as the high temperature on cpu.
4 Likes
@fredy I’m still having this problem with my station 858 for some observations. I have changed both power supply and USB power cable to the RPI. I also measured the power current to the RPI and it is way below 2.5 ampere.
The problem started 20 june after I did a “Update” in the configuration tool. Before that I had several month without any failed observations. Installed versions are:
satnogs-client-ansible-202209101521, satnogs-client-1.8.1, satnogs-flowgraphs-1.4-1
Any ideas what can be the problem?
Looking at the observations on that station I think I see a pattern, the bpsk is the ones failing.
Off the bat this flowgraph usually is a bit higher load.
You did run my gr-satellites integration on this ? I don’t see any demodulated data on the nayif-1 obs.
My suggestion is to run htop and watch for threads that maxes out single core, comparing a fsk obs with bpsk in this case.
1 Like
Thanks @SA2KNG Yes I also see this pattern. I have tried both with your gr-satellites integration and without, same problem.
I have used htop and see that one CPU core is at 100% during all the BPSK satellite pass.
I have done a new update of the system today and see if upcoming pass today have the same problem. And, before my update the 20th June, I did not see this failures for BPSK.
1 Like
Perhaps try running volk_profile again to select the optimal kernels ?
1 Like
Will try that. Will see in a couple of hours if it helps.
Perhaps try running
volk_profileagain to select the optimal kernels ?
1 Like
I have spent many hours trying to found what is happening. I have removed both the new soapy Airspy driver and satnogs_gr-satellites pre/post scripts, and I still get the faulty observation for BPSK. So the new Airspy driver or satnogs_gr-satellites has nothing to do with this problem.
When looking at htop when observation running I can see many threads with satnogs_bpsk.py and one of the CPU cores are always at 100%.
I also see the ‘oooooo’ in the logs as I understand is lost samples.
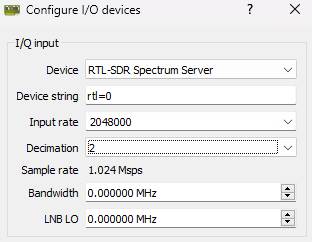
When searching the forum I see that several others had the same problem, and lowering the sample rates seams to fix the problem, but the lowest Airspy supported rate is 3e6.
Forgot to specify thread names, F2 in htop and set the highlighted option
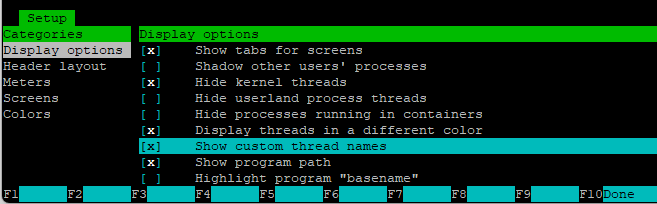
Then you can see the gr function names running.
But yeah, perhaps 3e6 is too much. I cannot find any driver decimation either, this could have been used to cut the bw in half.
In gqrx this can be done, but I think that is after the source.
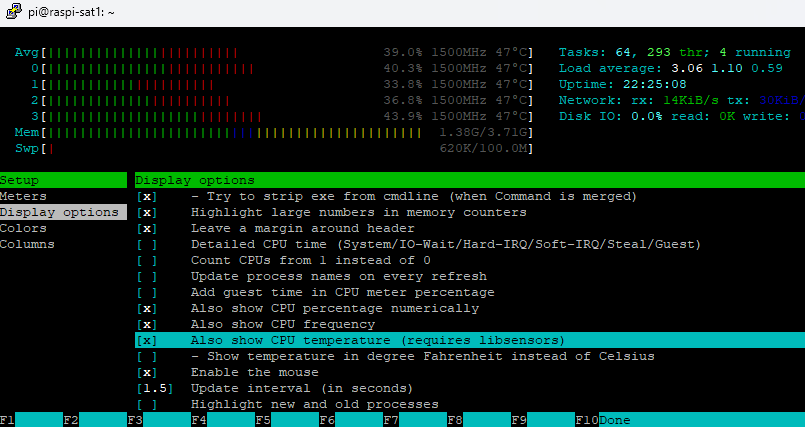
Another thing, is there a heatsink on the cpu ? thermal throttling is a thing, when the load rises and temperature with it, performance goes down.
It is available in htop as well, just enable the highlighted display option, visible in the cpu load bars.
You can get the actual throttled value as well,
watch 'vcgencmd get_throttled; vcgencmd measure_temp'
if it says anything else than throttled=0x0 you have a issue there.
    0: under-voltage
    1: arm frequency capped
    2: currently throttled
    16: under-voltage has occurred
    17: arm frequency capped has occurred
    18: throttling has occurred
Thanks. Yes I have a heatsink on the CPU. What I can not understand is why this has started after an update I did via satnogs-setup
One thing that I have not tested is switching to a RTL-SDR v3 and running a lower sampling rate.
And, as a final step, reinstall everything from scratch…
Updating via satnogs-setup runs apt update & upgrade as well, so a lot of packages from the debian repo as well as from satnogs repo is updated.
comparing obs 7652902 and a recent 7889374 shows metadata difference:
name: "gr-satnogs", version: "v2.3-compat-xxx-v2.3.3.0",
name: "gr-satnogs", version: "v2.3-compat-xxx-v2.3.4.0",
Althou there’s nothing regarding performance that has changed there sompared to 2.3.3.0.
The soapyairspy hasn’t changed in the last 3 years.
Perhaps some libs have, don’t know.
Backing up uSD and start from scratch perhaps.
Yea, thinking of that, it takes to much time to troubleshot. I’m actually think I will get a new RPI 4 and getting it up and running on that one. My RPI 3 has been running for many years now.
Thanks for your support.
1 Like
RPI 4 up and running and no problems at all now with lost samples.
2 Likes