Hello Patrick…
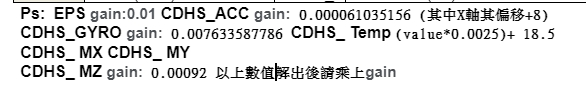
The temperature value is a signed short, not unsigned short, and please multiply the resulting value by 0.01.
1 Like
Which Temperature value do you mean?
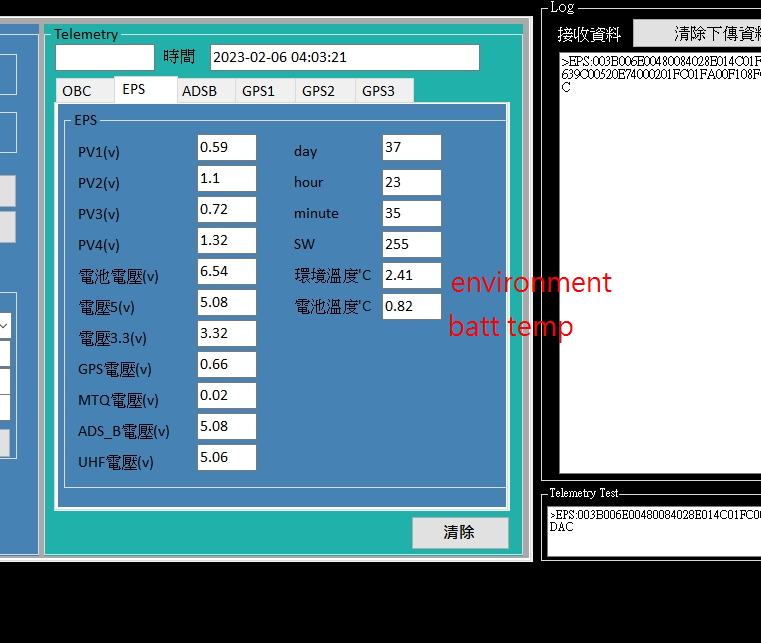
I meant that the “battery voltage” at the 5.08V value window is named "DC 5V.
You said on Twitter that it seems the temperature is wrongly indicated. So I asked the engineer, and his reply was that it is a 16-bit short signed, not unsigned short. Sorry for any confusion.
S/W engineer he admitted that in the word document, he had made a mistake in the description for this part.
1 Like
Is this true for any temperature value?
The data from EPS and CDHS are primarily short, and the output should be multiplied by the gain value. CDHS_Temp is special and requires the calculation of (value * 0.0025) + 18.5. Please refer to the diagram for his explanation.
EPS:003B006E00480084028E014C01FC0042639C00520E74000201FC01FA00F108FC0DAC
decode:
PV1:003B
PV2:006E
PV3:0048
PV4:0084
Battery:028E
Power3.3:014C
Power5:01FC
VGPS:0042
SW:639C
T_BAT:0052
Day:0E74
VMTQ:0002
VADSB:01FC
VUHF:01FA
T_ENV:00F1
EPS_hour:08FC
EPS_minute:0DAC
the batt temp: = 0052(H) *0.01(D) = 82(D)*0.01(D) =0.82
The problem with the string below is: the values are not fixed in size. -0.6 will turn into 3.0if it gets positive I think. Or will it turn into 03.0 then?
>R04.9VT0.0C-0.6-\'v'/ FORMOSA BN0UT TT&C-3 \'v'/ -
As I see for the battery temperature: the value needs to be multiplied by 0.0001and it seems the environmental temperature also needs this conversion, right?
This is a directly read value without conversion. Sorry for any inconvenience caused.
Ok, that was clear to me!
Question is: how are the following values represented: 11.2V for RX, 1.5, 5.0, 10.0 V for TX, -1.0, -10.2, 1.0 and 10.2 °C. Could you explain that?
Are you talking about the TT&C Beacon mentioned above? This beacon was designed by the TT&C module and has no direct relationship with the satellite’s telemetry. I have never observed any values that greatly vary. Can you please specify which data you are referring to so I can better understand?
R04.9VT0.0C-0.6-'v’/ FORMOSA BN0UT TT&C-3 'v’/ -
RX 4.9V
TX 0.0V (yes…but wrong value, this value is the one captured by the last emission signal.)
C(temp):-0.6 c
Can you clarify if the temperature value shown is an average, the latest reading, or both are displayed? I am confused about the correctness of the temperature reading, can you explain?
I’m sorry, I’m working on two parts right now: one is the parsing of the ASCII telemetry, and the other one is the dashboard. I am enhancing the decoder right now to correctly show the temperatures as signed integers, parse the ASCII beacon and I am also trying to apply the correct conversion formulas.
Gimme a few minutes and you can see your desired voltage graphs ![]()
1 Like
What is the expected telemetry or beacon interval? I’ve scheduled some observations and it does not seem to transmit at all.
See, e.g., SatNOGS Network - Observation 7123583
1 Like
Hi Patrick,
Thank you for your assistance. The dashboard you designed is very attractive and easy to understand, even for students who are not familiar with it.
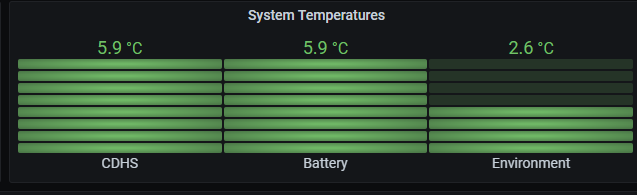
- Could you change the label “Environment of temperature” to EPS? That sensor is for the EPS board.
- The temperature reading of the EPS seems to be incorrect and doesn’t match the readings of the other subsystem modules. They are all located in the temperature sensor within the satellite body. Please conduct some research to resolve this issue.
- I noticed that the data updates every 30 seconds, but I haven’t seen any new data entering the RAW DATA. Is it a mistake on my part or is there another way to import the data?
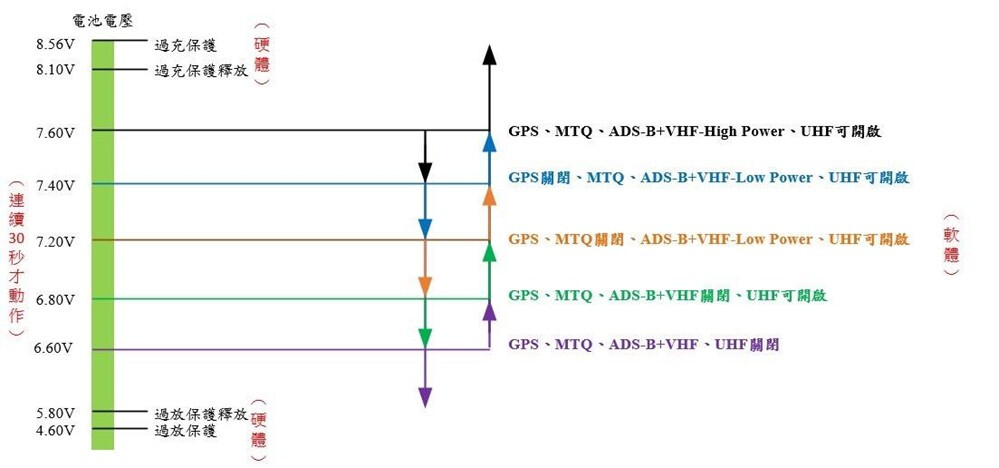
- There is a chart below (interpretation lasting 30 seconds) which has some Chinese font. I apologize for not changing it, but I believe you’ll be able to understand it as it simply represents on and off. This voltage critical judgment chart helps explain why many observatories have not received beacon queries. When the battery voltage reaches 6.6V (with an error margin of 0.4V), the transmission of TT&C will stop and only a small power consumption of the OBC board will remain. It is therefore important to repeat and continue to assist the senior observatories at the next voltage critical point.
Randson /BV2DQ /WJ2I
2 Likes
There is a chart below (interpretation lasting 30 seconds) which has some Chinese font. I apologize for not changing it, but I believe you’ll be able to understand it as it simply represents on and off.
This voltage critical judgment chart helps explain why many observatories have not received beacon queries. When the battery voltage reaches 6.6V (with an error margin of 0.4V), the transmission of TT&C will stop and only a small power consumption of the OBC board will remain.
It is therefore important to repeat and continue to assist the senior observatories at the next voltage critical point.
I appreciate if OM you can keep to help.
Thank you.
1 Like
I’ll have a look at the wrong readings!
That there is not much data shown is caused by the fact that nearly no one receives telemetry from the satellite, as it doesn’t seem to transmit any…
1 Like
Dear All.
The NUTSat (55124) enters a low-voltage sleep state and waits for charging to resume normal operation. I am very grateful for your help. Please continue to help me receive signals.
Thank you.
Vy 73!
Randson BV2DQ/WJ2I
2 Likes