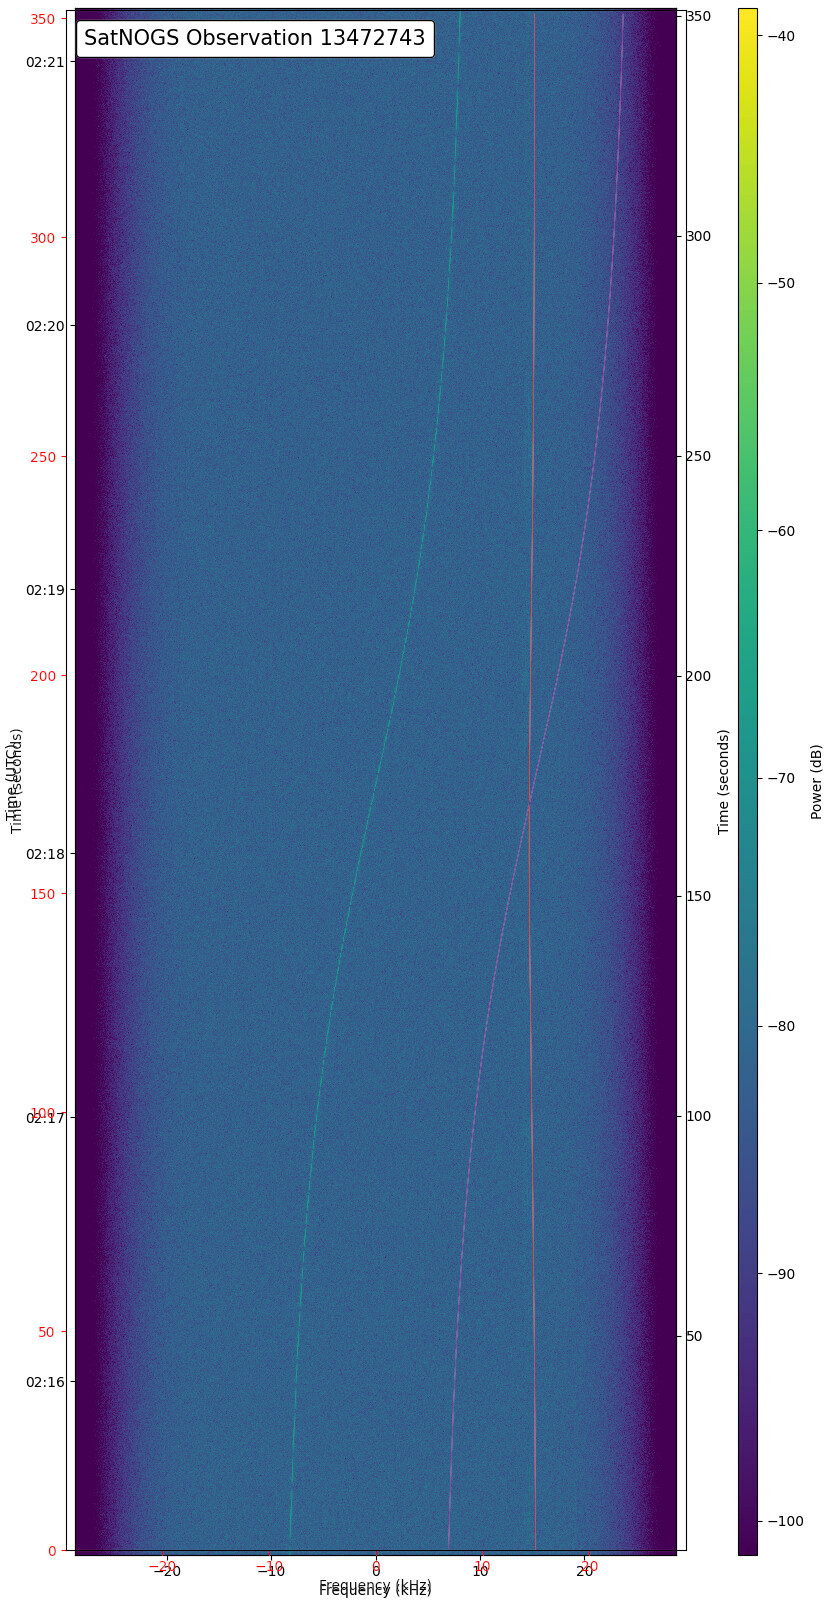
Regarding Observation 13472743 …Could the track on the right side be a signal from Knacksat-2?
Using ikhnos tool, this is signal from KINEIS-2A (62932) at 400.645 MHz
Thanks fredy - I will try to install the ikhnos tool on one of my raspberry Pi’s.
1 Like
That would be great, if you need any help let me know.
By the way, it is in my (unfortunately not near) future plans to add this kind of analysis directly to Network, so it would possible to compare dynamically and online the signals against other satellites.
However to make it easy and meaningful, first we need to start pushing towards making waterfall data (aka artifacts) results as the new standard instead of the waterfall image. Waterfall data are currently in an experimental status and used by a couple of stations.
Next steps on this front are:
- Move @kerel work into Network in order to be able to load, view and analyze the waterfall data
- Make by default stations to upload both waterfall data and make waterfall image optional (by default not uploaded)
- Deprecate in both client and Network the waterfall image and support only waterfall data.
- In parallel with the above steps continue working on @kerel work and add analysis tools, like ikhnos etc
Unfortunately due to unstable human resources power, it’s difficult to estimate when these changes are going to be implemented, on the good news, the last months the human resources have been increased and there is an increasing progress on various fronts of SatNOGS project, even if this is not always visible to the end user.
For the context waterfall data vs waterfall image:
Waterfall image is created from waterfall data on the client side, while this is useful for quick visual inspection of the observation, it is not a good format for further analysis, also for different durations the waterfall image has the same size, which results in variation of resolution of the “data/pixels” you get visualized.
With waterfall data uploaded, we will be able to visualize more dynamically the spectrum, for example be able to zoom in/out, to adjust power visualization/filtering, to change color-maps. Additionally the data will not have to be extracted from the image with adding errors in during this process. They will be available directly to use and perform further analysis, either on the spectrum visualization online or locally with other tools.