Regarding Observation 1037954 …
Hi
I am doing my PhD at UniSA. Can you please share your recorded raw data? I want to process it to extract Doppler curves.
Hi,
The raw IQ data for this pass is available here: https://satnogs-iq.s3-ap-southeast-2.amazonaws.com/1037954.raw This is in signed 16-bit format, 48000 Hz sample rate.
HOWEVER - SatNOGS performs doppler correction as part of the demodulation chain, and the IQ recording is after this doppler correction step. As a result, you can see that the target signal from LightSail-2 appears as a vertical line in the waterfall, while other local interferers appear to shift in frequency throughout the pass. I’m not sure you’ll be able to do whatever you are after from this recording.
What information are you after in particular? As you can probably guess from my station location, I am based in Adelaide, and I have fairly regular dealings with the likes of Bill Cowley, Ady James, and others in ITR.
Cheers,
Mark VK5QI
1 Like
Hi,
Yes, I am at ITR too (joined in March and working with Dr.Gottfried). I am looking for raw data without any correction. I simply want to see Doppler vs time for the recorded signal for same satellite over multiple passes. I thought you record data before applying the correction.
As you mentioned, Doppler compensation is already done but in the waterfall I am still looking some signals which are not compensated for Doppler. Can you please tell a bit about those signals?
You’re wrong! They are doppler corrected but are of terrestrial source. That means they are static in their frequency, as they are not moving relative to the observer, and do not underly doppler shifts. That’s why a straight line for a satellite signal results in curved lines for terrestrial signals.
1 Like
Ok Thanks, I got it. It means I need to have my own setup running to record raw data (before correction) and I can’t find here on SatNOGS.
Correct. The STRF tool written by Cees Bassa is what many of us use to analyzer doppler from satellite passes and perform orbit determination: https://github.com/cbassa/strf
Dani Estevez has a blog post giving some information on using this tool to fit a particular doppler curve to a satellite TLE: https://destevez.net/2019/01/an-strf-crash-course/
@cgbsat and others have performed much more complex analysis using multiple passes to determine the orbits of unknown objects. I’m sure he could provide more information.
3 Likes
Thanks for your help. I already have done work on orbit prediction by using TLE’s and I have predicted Doppler vs time curves for satellite. Now, I just want to validate predicted results with actual measured values.
You can find a zip file with 35 Doppler curves of the CW signal from MAX VALIER SAT (SatNOGS DB - MAX VALIER SAT) at Dropbox - 42778.zip - Simplify your life
These have all been obtained with station #39 running in STRF mode in parallel with SatNOGS observations.
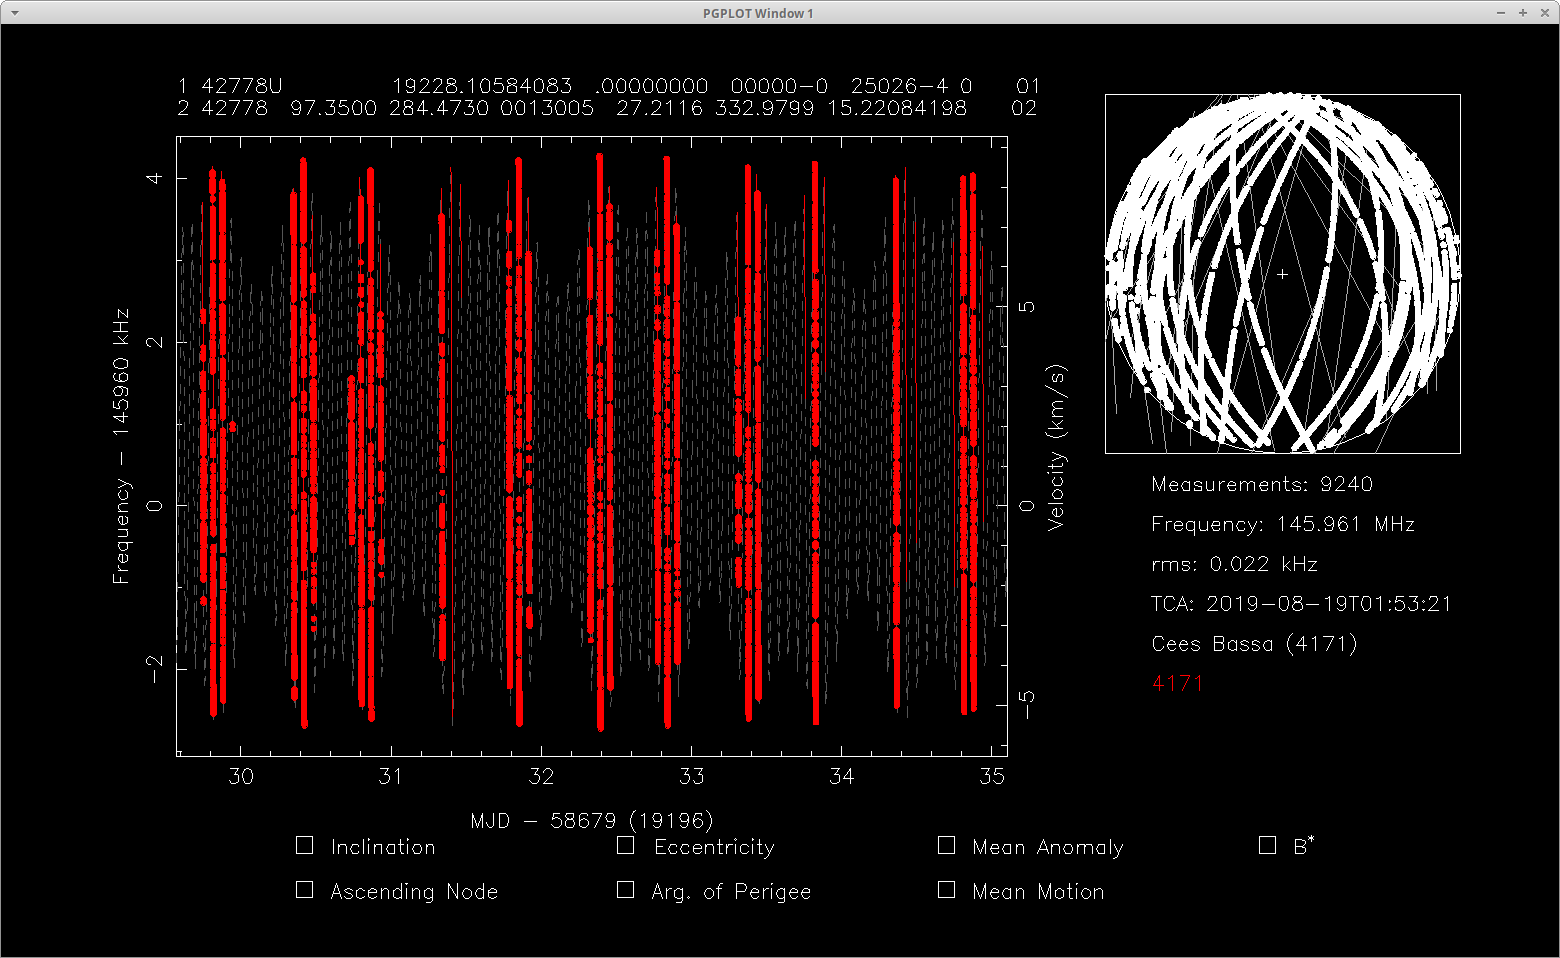
Here’s a plot comparing the Doppler curves from August 2019 with the CSpOC TLE.
1 Like
Can you explain a bit around this? How much is the divergence? I am not able to understand it through the graph. Thanks!
The RMS of the fit is given as 0.022kHz (22Hz). With a transmit frequency of 145.961MHz that amounts to 45 m/s RMS in the line-of-sight velocity.
Using those Doppler curves to fit the orbit from scratch, I get this TLE.
1 42778U          19230.73549533  .00000000  00000-0  62594-4 0    05
2 42778  97.3266 287.0211 0010632  47.3087 312.8832 15.22089773    06
# 20190813.75-20190818.88, 9240 measurements, 0.019 kHz rms
Which you can compare with the CSpOC TLE from the same epoch
0 MAX VALIER SAT
1 42778U 17036P   19230.73549533 +.00000491 +00000-0 +24410-4 0  9998
2 42778 097.3497 287.0434 0012757 018.3163 341.8530 15.22087108119527
The positional difference at the time of the TLE epoch between these TLEs if about 5 km.
2 Likes
What is your method to run STRF in parallel with SatNOGS. Do you have 2 SDR on the same line or how do you prevent the doppler correction in STRF?
It is very hacky, but involves the following steps:
- Add a UDP sink to the
gr-satnogsflowcharts connected directly to the osmocom source. Use 127.0.0.1 as the IP and10*rigctl_portas the port. - Set the
SATNOGS_PRE_OBSERVATION_SCRIPTenvironment variable to call a pre-observation script. Pass it the frequency, and possibly the script name. I useSATNOGS_PRE_OBSERVATION_SCRIPT="sh <path_to_script>/preobs_vhf.sh {{SCRIPT_NAME}} {{ID}} {{FREQ}}" - Create a pre-observation script that starts
rffftreading from a fifo andnclistening to UDP packets from the specified port and dumping them into the fifo. My script is below.
My VHF (#39) and UHF (#40) stations run from the same x86_64 PC. Hence, I use 10*rigctl_port to differentiate between VHF and UHF recordings scripts, this to prevent both flowcharts sending UDP packets to the same port. The VHF and UHF satnogs-clients then have their own SATNOGS_PRE_OBSERVATION_SCRIPT and SATNOGS_RIG_PORT variables.
By using the UDP port, the gr-satnogs flowcharts can run even when starting nc or rffft failed, or are even turned off.
As you can see from the VHF pre-observation script, it only runs on the CW and AFSK flowcharts. I’ve also hardcoded the 1e6 sample rate, which is the gr-satnogs definition for an rtl-sdr. The -n 3600 option means only a single bin file is written by rffft, as the passes are usually shorter than 20 mins or so.
#!/usr/bin/bash
# Run strf
if [ "$1" = "satnogs_cw_decoder.py" ] || [ "$1" = "satnogs_afsk1200_ax25.py" ]; then
    freq=`echo $3 | awk '{printf("%d\n",$1-100000)}'`
    rffft -i <path_to_fifo> -p <output_path> -f $freq -s 1e6 -q -c 20 -n 3600 -F float &
    nc -l -p 45340 -u ><path_to_fifo> &
    echo "rffft and nc started"
fi
6 Likes
It is impressive. May be developers could tell us if the sink could be integrated in gr-satnogs mainstream. It looks like a feature some other people would want.
2 Likes
Hi
I want to open all 35 records by rffit, but it show only one record for me.
can you help me which command shows all record with rffit and pgplot window?
Hi, the .dat files contain simple text values, which can be read with a text editor. You can merge the .dat files into one big file. For merging run something like:
less *.dat >> total.dat
Be careful to run this only once, otherwise the total.dat gets full with double values. And use total.dat in rffit.
1 Like
Hi,
thanks so much. It worked me well
1 Like
Hi,
I have a problem when I select points by s and push the i button for inter rmse limits. when I use this command, the core dumped error showing and cannot set limit rmse. can you help me solve this problem?
Hi
There are lots of audio files in the Satnogs network that are downloadable. I want to use them as input STRF Software. Unfortunately, I am always unsuccessful.
Can you tell me, is it possible to use them as input STRF software and how?
Thank you in advance.
The audio files can not easily be used for Doppler analysis as they have been corrected for Doppler using the known TLEs and have been demodulated. However, we are working to upload waterfall files that can be analysed to extract frequency offsets. Some stations are already uploading this. @kerel can explain in more detail if you are interested.
Thanks for reply Dear Cees Bassa.
Can you explain how should I find stations that are already uploading waterfall files that can be used to extract frequency offsets?
Does Karal is one of the stations? I couldn’t distinguish the difference between his observation and others.
Are you familer with WebSDR, We can record signals online from the browsers. I think STRF and WebSDR can work together properly.
(http://websdr.org/)