There has been many discussions about the fsk deviation setting and what it does, the default value and what is needed to determine it.
Best source is of course the ones who built and configured the transmitter, but that is seldom available.
Looking around the internet on how this is done results in many articles, some of them using spectrum analyzers with the transmitter in the lab and transmitting continuously, methods that simply isn’t available when it is up in space and transmitting data bursts, or for that matter to someone not having access to pricey hardware.
I finally decided to dive in to this and see how hard it was. This is certainly not the first time this was discussed, but Jan @PE0SAT started an issue over at Daniel @EA4GPZ brilliant repository and I joined the discussion. Some PM’ing later I had a basic idea what needed to be done.
The requirements for this guide:
Acquire the IQ recordings. In this case int16 iq as used with --rawint16 later on, but other formats will also work if command line is adjusted accordingly.
- Either enable IQ dump on your SatNOGS station and set the filename as shown in the user guide. You will need a script to rename/move this after the observation is done to keep it from being overwritten by the next observation.
- Download from other stations, a few have this available publicly or on request.
Install gr-satellites, it is available as a package on the repos for our raspberry pi images.
My workflow is based on a Debian 11 or 12, satnogs-client is currently using Debian 11 and that works ok. Optionally running this under docker with the docker-gnuradio image or similar. Or some other dist (ymmv).
Let’s get started with a example of MCUBED-2 observation 9702028 running at 57600sps, recording available at: iq_9702028_57600.raw (decompress with 7z).
Run: gr_satellites mcubed-2 --iq --rawint16 iq_9702028_57600.raw --samp_rate 57600
and you should be greeted with a bunch of data following Packet from 9k6 FSK downlink.
To analyze this further, it is quicker to select a small section of the file, like some 10s with one strong packet.
Looking at the waterfall of that observation, the middle has the strongest signals so we’ll select a 20s stretch from the 350s mark with the following command: (4 is int16 iq, 57600 is the sample rate)
dd bs=$((4*57600)) if=iq_9702028_57600.raw of=mcubed2_cut.raw skip=350 count=20
and also create a directory for the data dump: mkdir -p dump
Now run: gr_satellites mcubed-2 --iq --rawint16 mcubed2_cut.raw --samp_rate 57600 --deviation 5000 --disable_dc_block --dump_path dump
Notice the additional arguments appended. This will dump (amongst a few more) the internal demodulated samples to the file dump/waveform.f32 . The package will probably not be properly demodulated due to the disabling of the dc block. The deviation is set to the default 5000 as to override it if it’s already defined in the satyaml.
Plot this with numpy and matplotlib, for example waveform_plot.py
Run: python waveform_plot.py dump/waveform.f32
and you should get a window popping up showing the contents:
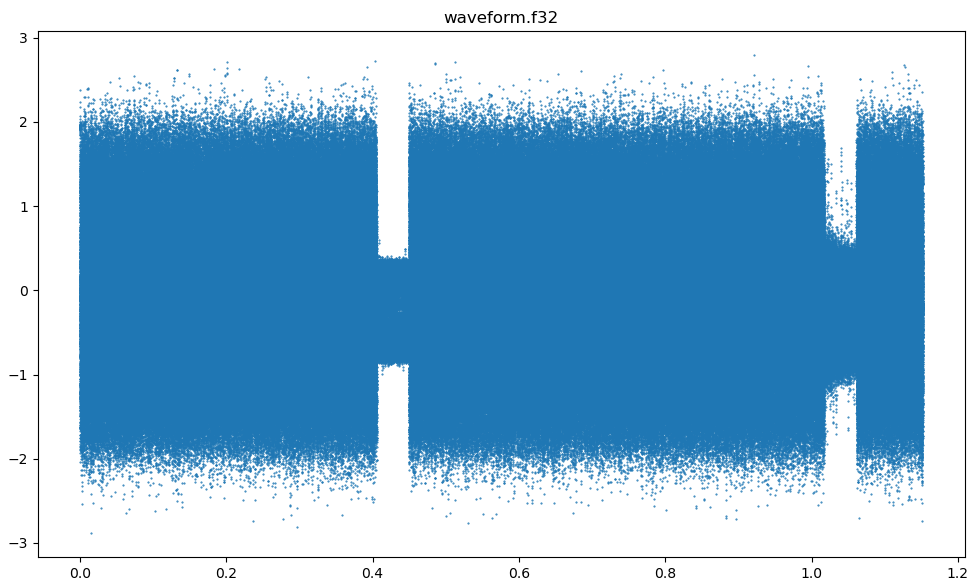
Zooming in to the first packet (narrow part):
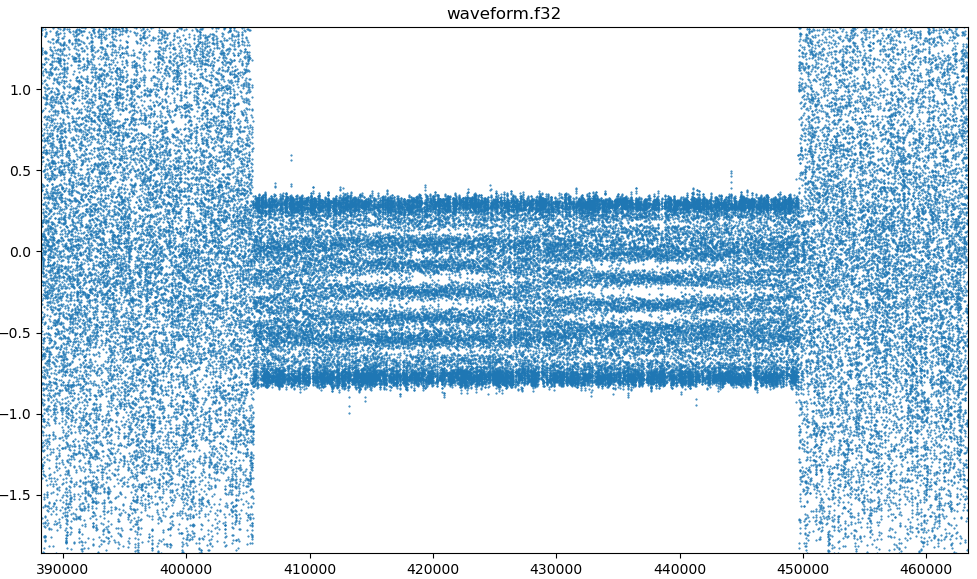
Here you can start to see what is going on, in this example you have two edges at approximately position +0.3 and -0.7
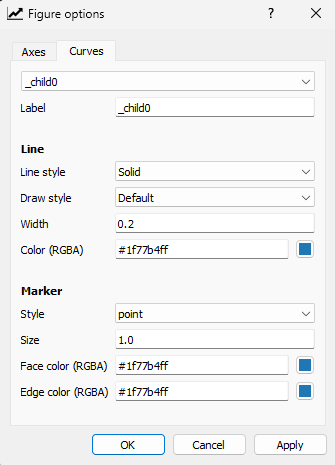
Zooming in further and changing the plot line style to solid and width 0.2 will show another interesting detail:
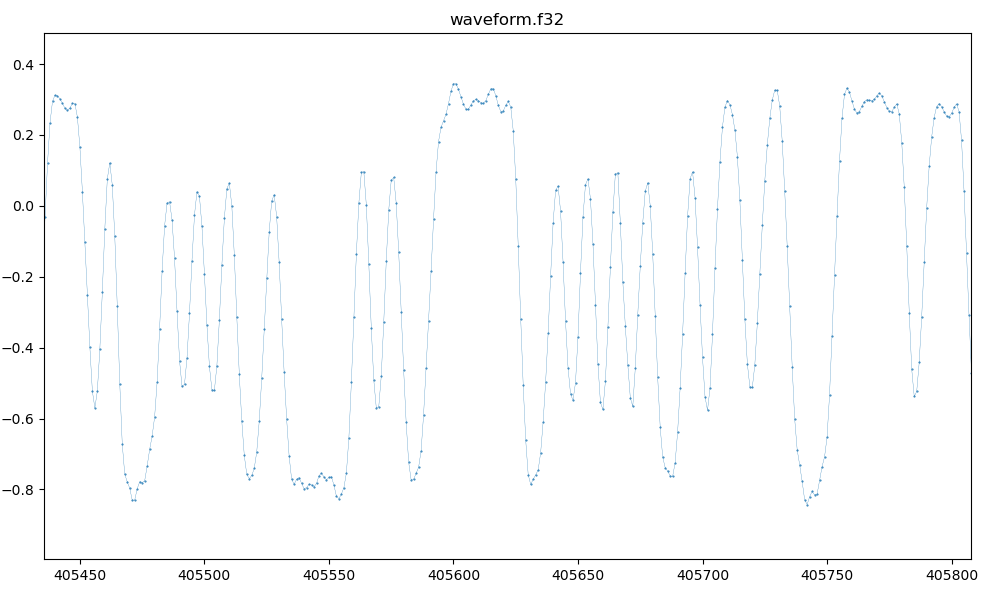
Here, use the mouse to hover over the points at the peaks to see the exact values. In this case with approximately 0.3 to -0.7 adds up to 1 peak-to-peak.
What we want is 2 peak-to-peak, so this tells us that the default deviation of 5000 is roughly twice as wide as it should be. The suggested deviation is around 2500.
Regarding the intermediate level that some of them turn at. Quoting Daniel:
This is because of inter-symbol interference. You can notice that the higher level only happens when there are two or more consecutive symbols with the same sign. Depending on the transmitter pulse shape filter, there can be more levels. Inter-symbol interference makes measuring the deviation harder. The best is to measure it in segments where there are many consecutive symbols with the same sign, so that there is no inter-symbol interference.
In this case I settled for a round value of 2400, tested another run with that and plotting the results too see if they were 2 peak-to-peak, which they seemed.
A short list of “round values” for 9600 baud: 2400, 3000, 4800, 5000. Maybe we can compile a more complete list on why these values and what they apply to.