I just started with my little RTL-SDR and rasperry pi, and I’m curious about having a grafana dashboard that could monitor and gets stats for my GS.
I tried to navigate through the Wiki and the community but I didn’t find something easy to implement.
Question: is there on the docker/client installed in my rasperry pi already a possibility to do it?
is there a tutorial or someone that did it from his GS?
I’m interested to have these data in my dashboard:
power consumption of the rasperry pi
status (doing a pass or stadby for instance)
number of passes done, number scheduled pass at by which user
After enabling snmp you would need a program that reads that snmp data and writes it into a database from which you could query it with another program (e. g. grafana).
oki thanks! I’ll try to do something on my side and I’ll post it here!
Related question to grafana (not sure if open another topic): I saw lots of satellites data/tlm and housekeeping on grafana from satnogs. how those data are taken from satnogs to grafana?
I got some data from Alsat-N1 or others but I don’t see my GS contribution to their dashboard. Is it required another step?
ahh thanks!
Is because of my GS configuration or because of the pass or the satellites?
Those data are wrong I guess.
so it is automatic the transfer? thanks again for your explanations! (I’m still new and learning)
the timestamp of the decoded data is data_11430284_2025-04-17T18-06-55, and waterfall /waterfall_11430284_2025-04-17T17-59-32.png.
So at the end of the pass.
What should I notice?
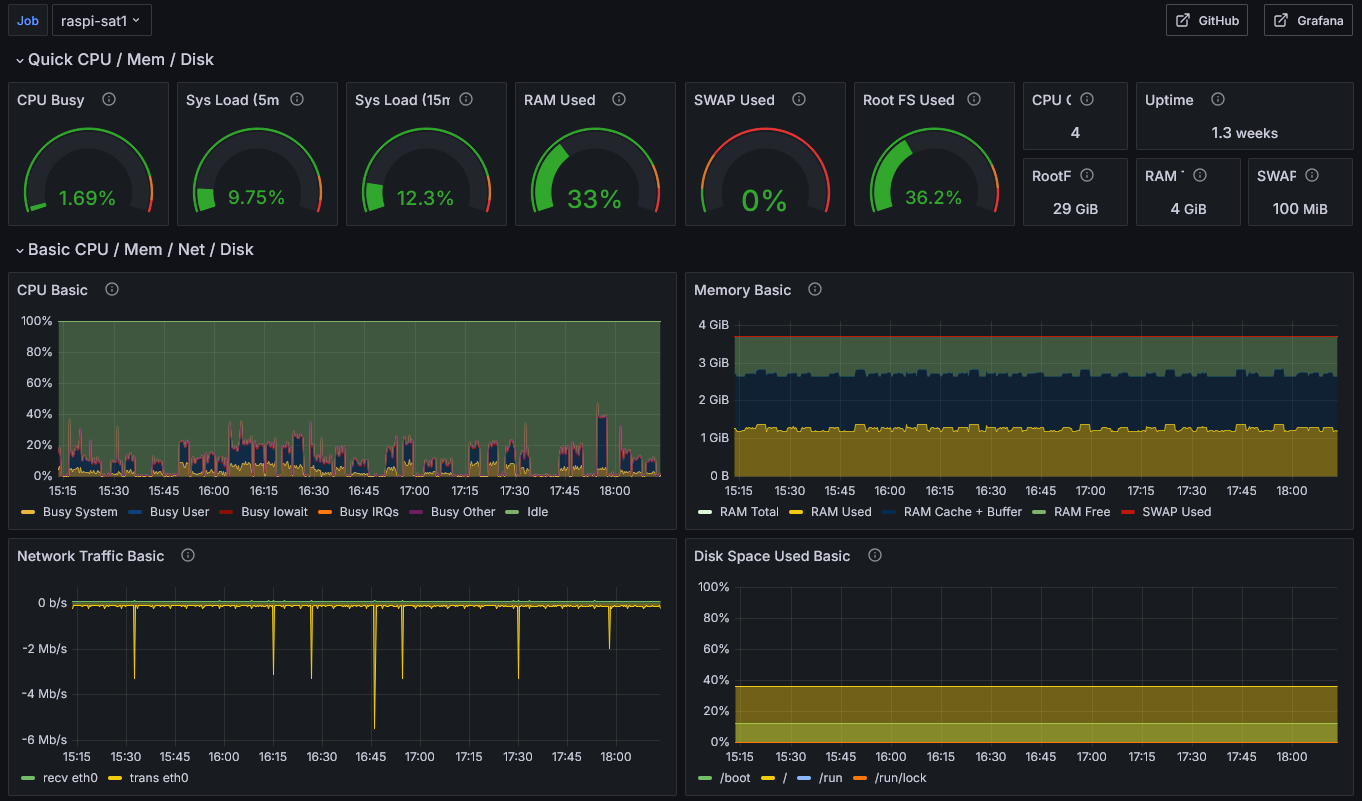
I run a combination of; node_exporter, prometheus and grafana with this dashboard.
Either look for node-exporter setting to export raspberry pi related stuff, or make/find a small program that presents this for prometheus to collect.
I’m also interested at collecting/presenting more information.