Glouton : a satnogs data downloader

Hi everybody,

it seems to be a while that i didn’t provide any updates on Glouton (at least, here), so here it is :

  • The big one is that from now one glouton is able to download frames from the satnogs DB using norad id, dates, app_source, observer and transmitter parameters.
  • The module part changes, now you can create module for observations (from satnogs network) and for telemetry (from satnog db).
  • And Glouton can be used as a pypi package (running the pip install command).

I m currently working on making the scanning page mechanism more faster.

I think that’s it :slight_smile:

the repo
the docker image

Have a nice day !

3 Likes

Hello everybody,

I have update glouton to 0.7.0 regarding the recent change about using a key to download telemetry from the satnogs DB API.
Just register to db.satnogs.org, add you key to the config file and you are good to go :slight_smile:

the repo
the docker image

See you

4 Likes

Hello everybody,

I have updated glouton to 0.9.0. The changes are :

  • Added the functionality to run module after a download process (Before, you were able to run module only after each data download, not at the end).
  • Added a module to decode Painani-1 pictures for both network and DB data sources. The decoder code is from the work of @DL4PD and i on the subject :slight_smile: .

the repo
the docker image

See you

4 Likes

Hej all,

many thanks @deckbsd for this tool ! I can successfully download waterfall and archive data for my station as i’m trying to use this data to investigate an issue on one of my station.

I haven’t found a way to download meta data for the observations (mainly start and end time, but ideally also other like the software version and the used sample rate for example). Did i miss the option for this or is it not possible ?

Hi @hb9fxx,

Thanks for your reply :slight_smile:

Regarding the metadata. Since the use of the data can be multiple (JSON, CSV, specific), i didn t implemented one way to get the metadata, instead i let the user the possibility to develop a module that can run either after each download of data (can be waterfall, archive, …) and/or after the whole download as been completed. So to get the metadata you have develop your own. There are some example here (csv, …). Since you want the metadata of observations, you will have to create a module that inherit of ObservationModule (The doc is on the README file of the repo). On the module depending you need you just have to implement a method and the observation metadata are available trough the observation parameter (ex : runAfterDownload(self, file_name, full_path, observation)). Once the module is developed you can loaded using glouton command line.

You talked about sample rate, version, here the metadata i m talking about is the ones provided by the satnogs observation endpoint API : https://network.satnogs.org/api/observations/ . I don’t see any of those on that endpoint. I see a client version on the station API endpoint , this endpoint is not supported by glouton, but if it’s needed i can handle it.

I hope i answered your question :slight_smile:

1 Like

Hi @deckbsd,

thanks for your complete answer. Yes this endpoint API seems what i need. It seems to contains everything. The most important part for me being the start and end timestamps. The rest of the client metadata is hidden under the client_metadata key. In your link it shows future observations, so the client metadata is not available yet. If you look at https://network.satnogs.org/api/observations/?page=1000 there is all the client metadata.

I’ll take a look at your code to see if i can add an --metadata option that will save a per obs .json of the data provided by this endpoint following the same pattern as done for archives and waterfall. But my python3 skills are a little rusty.

Thanks !

I’ll take a look at your code to see if i can add an --metadata option that will save a per obs .json of the data provided by this endpoint following the same pattern as done for archives and waterfall. But my python3 skills are a little rusty.

Yes true, sometimes i forgot. Let me couple hours or days to find times to do it. I m going to add a basic module that you will be able to load and will create json files with all observations fields for all the files type you request :slight_smile:

1 Like

Great ! Thanks @deckbsd !

Here it is,

I don’t know you installed glouton do, if you cloned the repo, than just pull for last changes and you are good to go. At this moment it’s just on the master branch, i didn’t create a release or updated the pypi package.

The name of the module is ObsMetadataToJsonFile . To get the observation metadata related to archive and waterfall files for instance you can run : glouton -s 2017-09-19T00:51:54 -e 2017-09-20T00:51:54 -n 25338 --waterfall-module ObsMetadataToJsonFile --archive-module ObsMetadataToJsonFile . This will create a json file for each file you downloaded with the data in it.

1 Like

Thanks a lot, that works well. I built it from git so just pulled the new version !

Now i’ll have to do an analysis of the data.

1 Like

Great, thanks to glouton i could concentrate on the data and didn’t have to deal with the api myself. I could get the .ogg and .json files for 4 sats observed by one of my stations over 2 month to investigate an issue.

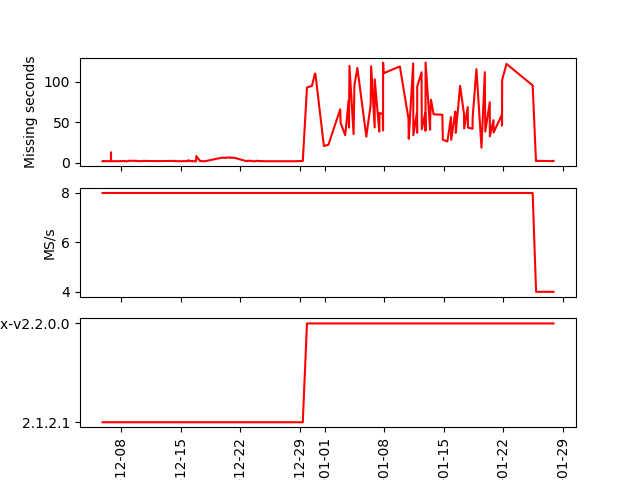
The issue was that since last update many obs were automatically vetted as failed as the .ogg file was more than 1 minute shorter than the planned duration. It was suspected by @fredy it might be a dropped sample issue. And yes looking at the logs i got dropped samples…

So i could plot a graph about the ‘missing’ seconds of the .ogg file along with the version and samplerate used. And indeed since last update the number of missed samples rose, and was fixed by reducing the samplerate. The issue was already present sometimes to a much lesser extent before the upgrade, so i guess the upgrade increased a little the CPU load and at 8MS/s it was too much for my Pi4, going down to 4MS/s seems to have fixed the issue:

example

Will see in some times if no more lost samples appear.

Sorry for the bad quality of the graph, I’m no matplotlib expert. And many thanks again @deckbsd for the quick glouton add-on. Really a nice tool to investigate stats or issues !

2 Likes

In case someone is interested in doing some similar analysis, i post the little python script used to generate the above graph:

Glouton has been called with following arguments (use start/stopdate, sat id and groundstation id as you which):
glouton -s 2021-01-20T00:00:00 -e 2021-02-10T00:00:00 -n 38771 --gsid 1868 --archive-module ObsMetadataToJsonFile
(When calling it on a too big time interval, i got http errors, probably doing too much requests in parallel, so i split them into smaller chunks (14 days).

Then i called the python script below as:
./analyzer.py archive__01-20-2021T00-00-00__02-10-2021T00-00-00/satnogs_35* .json
of course your exact path will vary. Important is to use *.json at the end to only give the json and not the audio files as argument.

Finally my anayzer.py script:

#!/usr/bin/env python3

import csv
import dateutil.parser
import json
import numpy as np
import pylab as plt
import pyogg
import sys

observations = []

# Read all observation into array
for json_filename in sys.argv[1:]:
    print("Processing " + json_filename)

    with open(json_filename) as json_file:
        data = json.load(json_file)
        start_time = dateutil.parser.parse(data['start'])
        end_time = dateutil.parser.parse(data['end'])
        obs_duration = (end_time - start_time).seconds
        client_version = data['client_version']
        client_metadata = json.loads(data['client_metadata'])
        radio_version = client_metadata['radio']['version']
        samplerate = float(client_metadata['radio']['parameters']['samp-rate-rx'])

        # Read corresponding audio file to get recorded duration
        ogg = pyogg.VorbisFile(json_filename[:-5])
        # / 2. as 16 bit ?
        ogg_duration = ogg.buffer_length / ogg.channels / ogg.frequency / 2.

        observations.append({'start_time': start_time, 'end_time': end_time, 'obs_duration': obs_duration, 'ogg_duration': ogg_duration, 'duration_delta_in_seconds': (obs_duration - ogg_duration), 'duration_delta_in_percent': (obs_duration - ogg_duration) / obs_duration, 'client_version': client_version, 'radio_version': radio_version, 'samplerate': samplerate})

observations.sort(key=lambda obs: obs['start_time'])

# Generate output .csv and graph
g_T = []
g_Secs = []
g_Samplerate = []
g_Version = []

with open('out.csv', 'w', newline='') as csvfile:
    fieldnames = ['start_time', 'end_time', 'obs_duration', 'ogg_duration', 'duration_delta_in_seconds', 'duration_delta_in_percent', 'client_version', 'radio_version', 'samplerate']
    csv_writer = csv.DictWriter(csvfile, fieldnames=fieldnames, delimiter=',', quotechar='"', quoting=csv.QUOTE_MINIMAL)
    csv_writer.writeheader()

    for observation in observations:
        csv_writer.writerow(observation)
        g_T.append(observation['start_time'])
        g_Secs.append(observation['duration_delta_in_seconds'])
        g_Samplerate.append(observation['samplerate'] / 1000000)
        g_Version.append(observation['radio_version'])

ax1 = plt.subplot(311)
plt.plot(g_T, g_Secs, 'r')
plt.setp(ax1.get_xticklabels(), visible=False)
plt.ylabel("Missing seconds")

ax2 = plt.subplot(312, sharex=ax1)
plt.plot(g_T, g_Samplerate, 'r')
plt.setp(ax2.get_xticklabels(), visible=False)
plt.ylabel("MS/s")

ax3 = plt.subplot(313, sharex=ax1)
plt.plot(g_T, g_Version, 'r')
plt.ylabel("Version")
plt.xticks(rotation='vertical')

plt.xlabel("time")

plt.savefig("out.png")
1 Like

Hello,

I didn t get any http errors running glouton -s 2020-01-20T00:00:00 -e 2021-04-30T00:00:00 -n 38771 --gsid 1868 --archive-module ObsMetadataToJsonFile (i took a large date range on purpose)