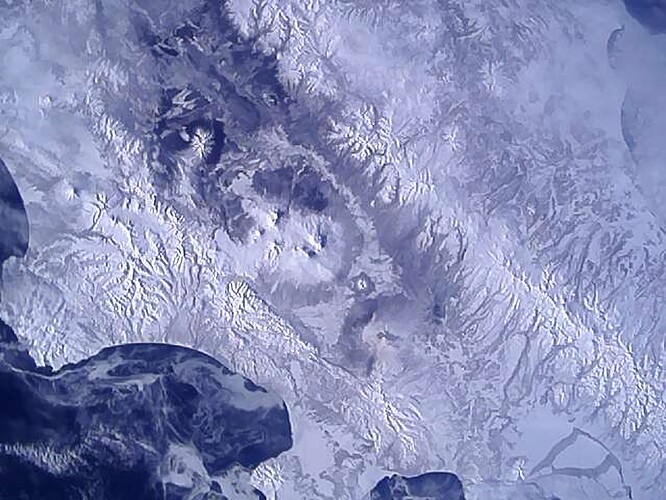
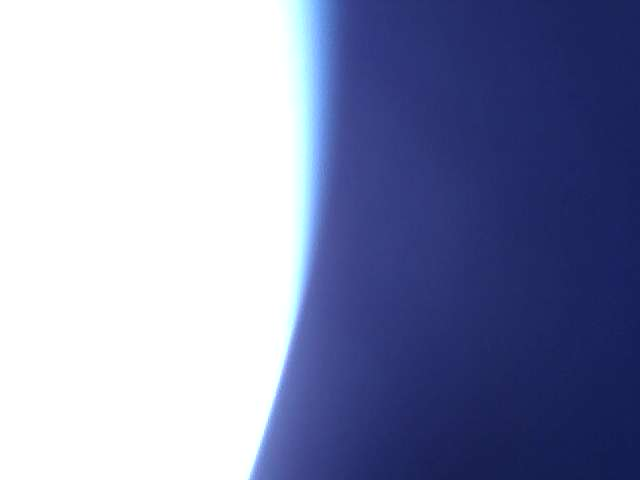
Could please help to decode the photo?
Here is new big schedule for image transmissions!
We will be capturing Southern Hemisphere ![]()
23.02.2023 scheduled (UTC Time):
Image 1: 04:06:00 + 08:30:30 + 08:32:30
Image 2: 10:02:30 + 10:04:30
Image 3: 16:14:00 + 16:16:00
24.02.2023 scheduled (UTC Time):
Image 4: 05:13:00 + 08:01:00 + 08:03:00 + 09:34:00
Image 5: 15:46:00 + 15:48:00
25.02.2023 scheduled (UTC Time):
Image 6: 09:06:00 + 10:36:00
And now after SatNOGS Network Release: 1.102 we can test images being appeared in data tab!
I tried, but there’s too many frames missing iirc.
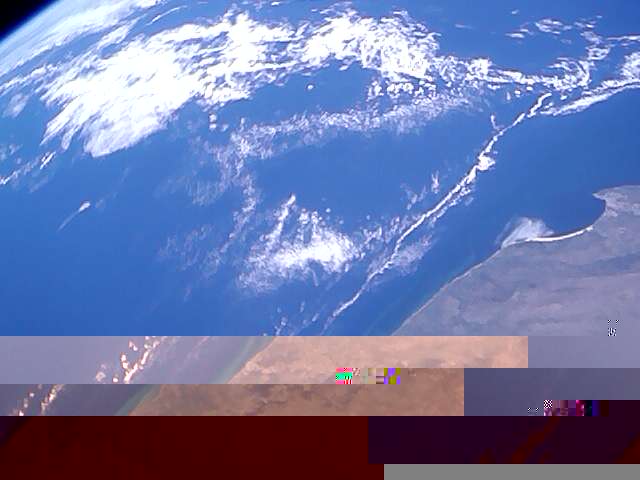
From SatNOGS DB
-
Image 1 (-42.63, 170.69)
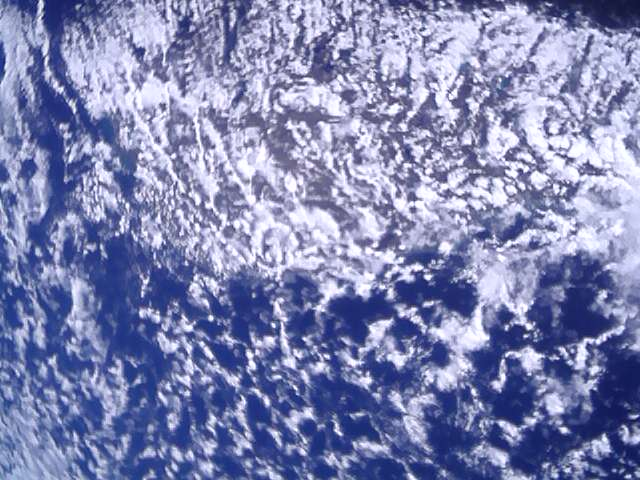
-
Image 2 (-30.30, 26.32)
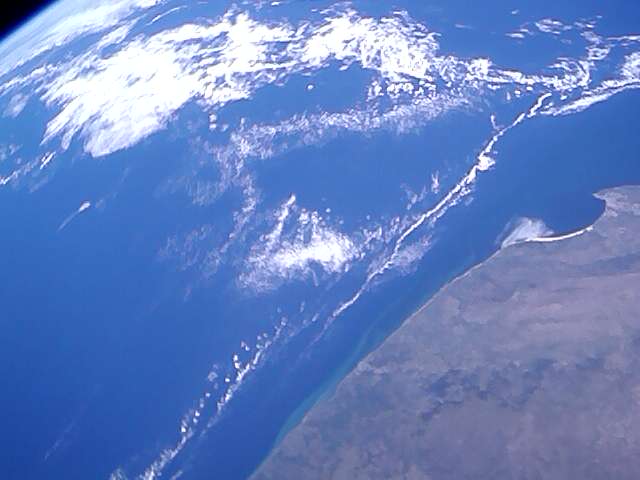
-
Image 3 (-53.29, -37.01)
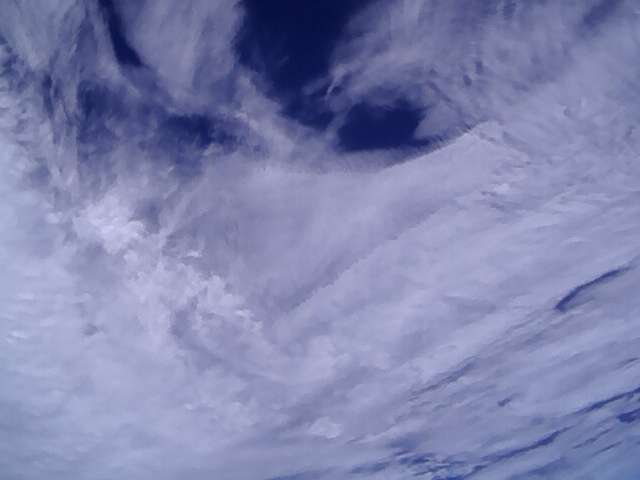
-
Image 4 (-31.65, 151.56)
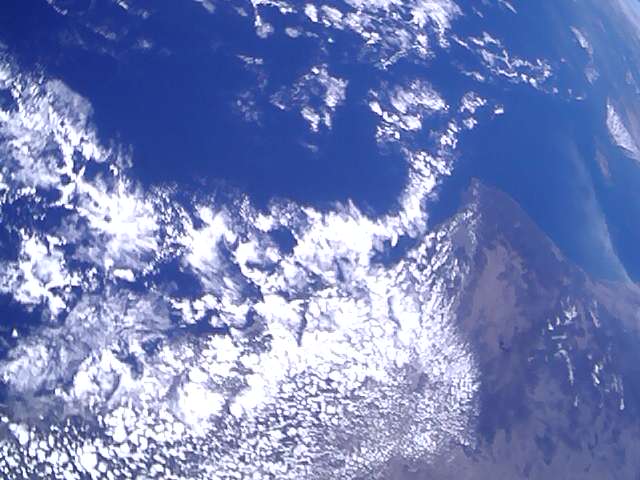
-
Image 5 (-55.23, -28.75)
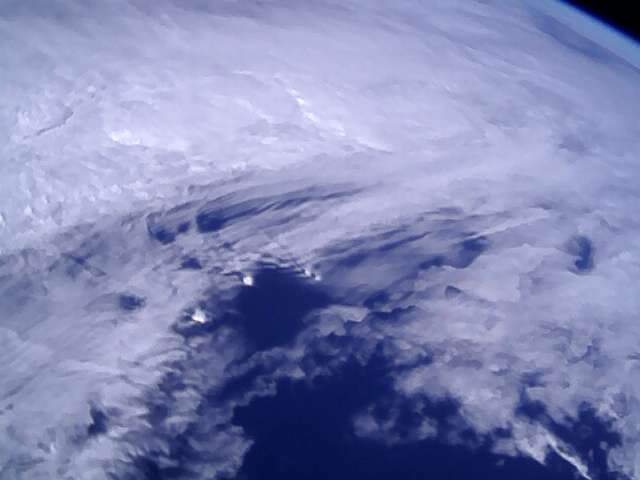
-
Image 6 (-18.64, 38.49)
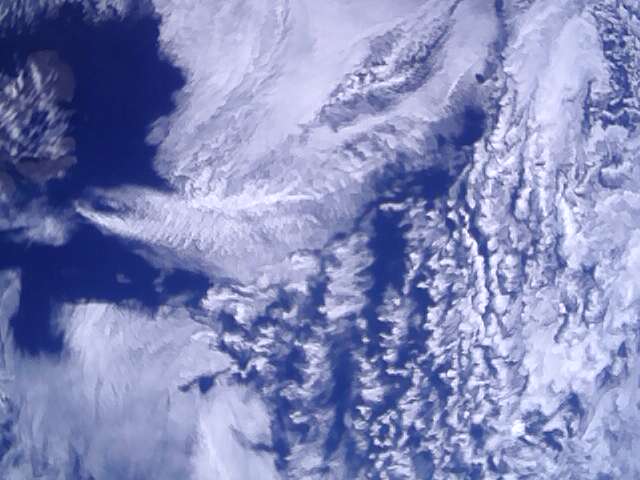
When will we test again on X-band ? ![]()
We will run series of experiments upcoming two weeks. Geoscan-Edelveis will be back with image transmissions after!
Is there anything we can do in grafana to participate in your experiments?
Thank you! I will try to add needed grafana graphs to visualize data after transmissions of telemetry will be planned!
From SatNOGS DB (restored)
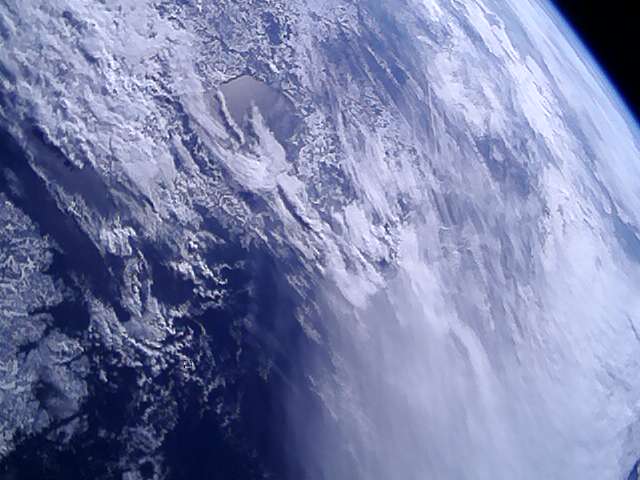
I had some fun overlaying the Kamtchatka photo of 2022-02-28 on a satellite image (ESRI World Imagery). Nice to see how the winter coastline differs from that in summer.
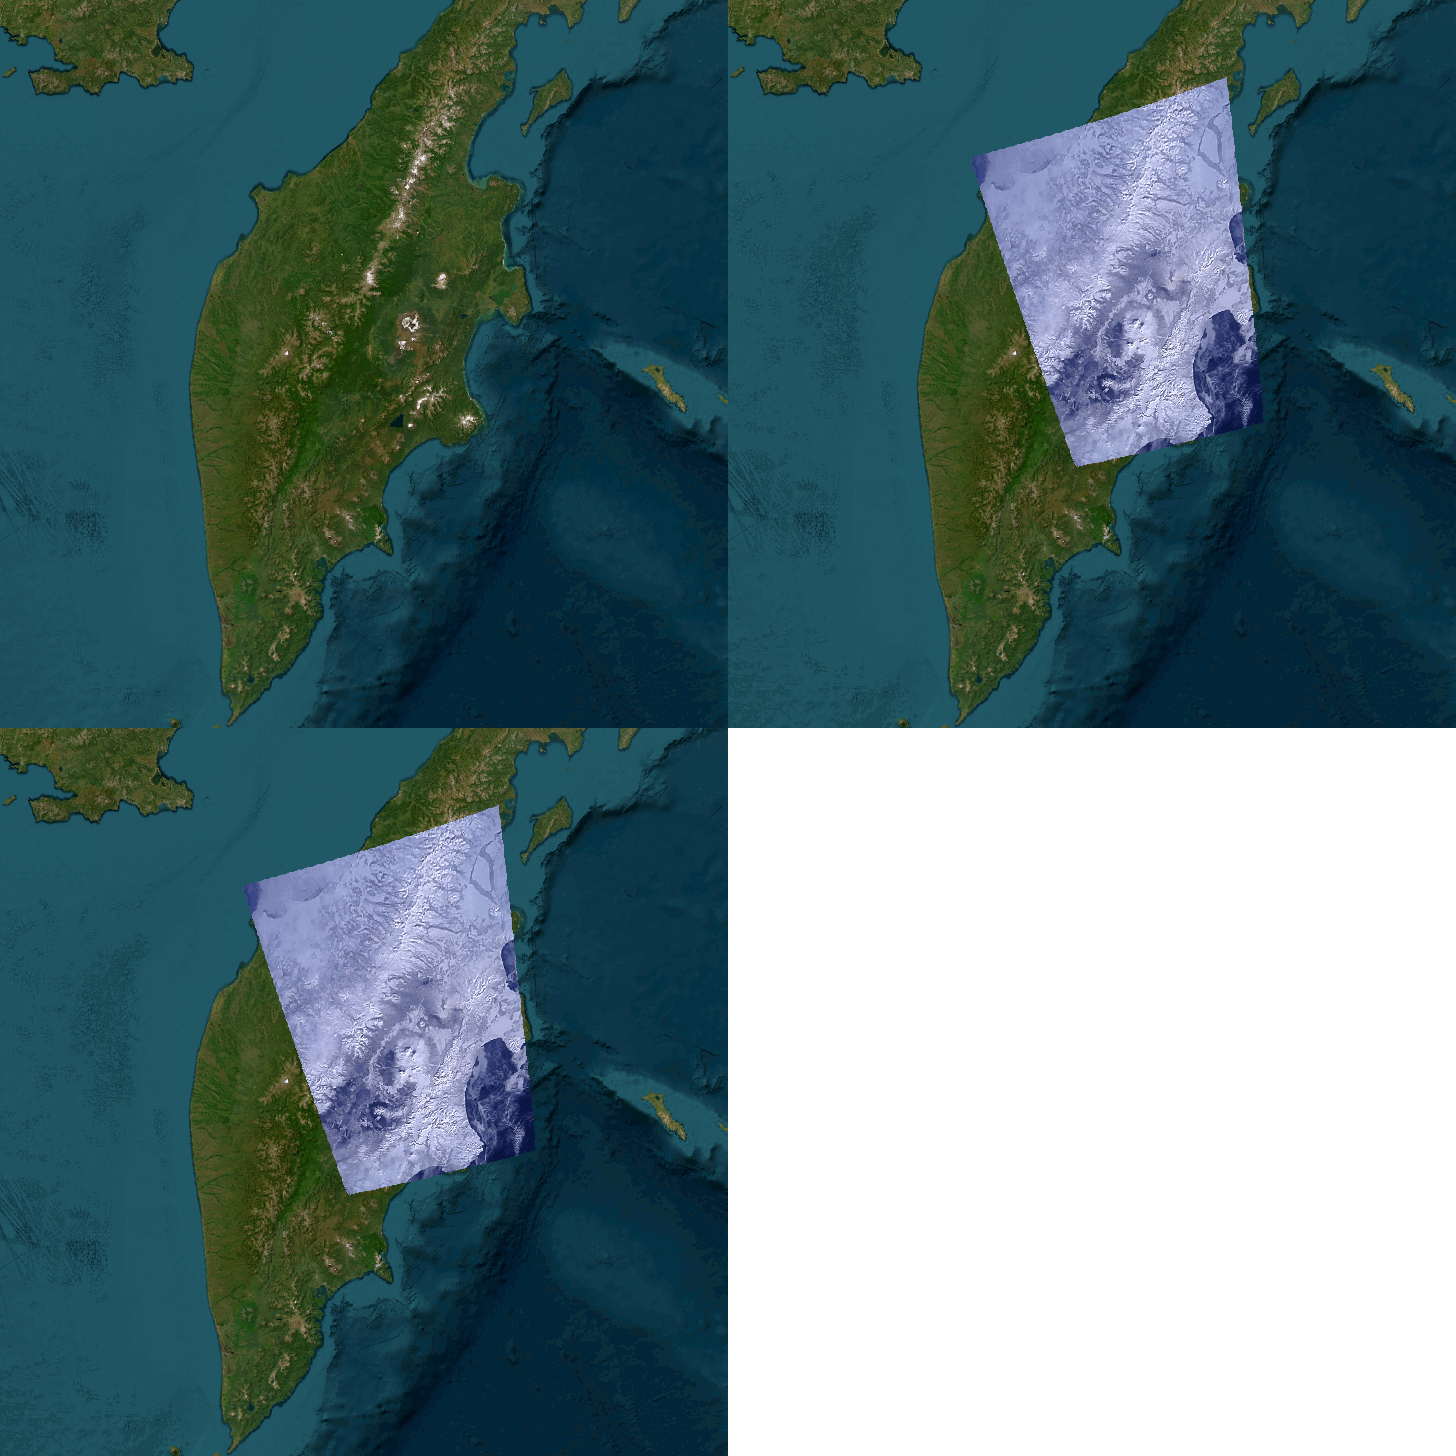
A nice exercise would be to understand the projection effects by using the TLE to compute the position of the satellite at the time when it took the photo. @geoscan Could you share the exact time when this photo was taken?
Long awaited image transmissions! ![]()
![]()
![]()
27.03.2023 scheduled (UTC Time):
Image 1: 15:35:00 + 15:37:00
28.03.2023 scheduled (UTC Time):
Image 2: 07:20:00 + 08:52:00 + 08:54:00
Image 3: 10:24:30 + 10:26:30
29.03.2023 scheduled (UTC Time):
Image 4: 08:20:00
Image 5: 09:52:00 + 09:54:00
Is possible to add one?
3/28: 15:27–15:38
Sadly, I can’t add one. But I can schedule one for your location after
Thank you!
Please help to setup for observation during the pass.
