Continuing the discussion from SatNOGS Client Version History:
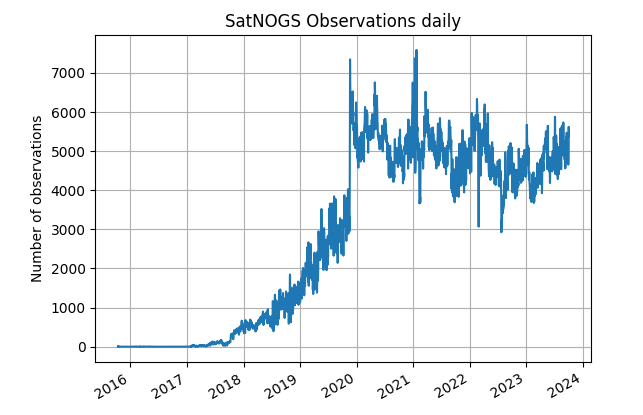
Addendum / Off-Topic: Total number of daily observations.

This plot does not contain as much useful information as the others, but I wanted to share it anyway to show the sudden increase in observations at the end of 2019; I guess this step might be related to the advent of the auto-scheduler.
I’m certainly not the first one to have noticed it, I know @danwhite has created this plot in the past and annotated it (it ended up on presentation slides), but the quick search I did for those previous versions didn’t give any results.