So, I’m having a “crazy thought” here… and partly I blame my real-world job of being a professional software/tech “dot-connector” between different “interesting” applications of technology, but in this particular case, I really wonder how beneficial the following “mashup” idea could be.
@0xCoto you described the “intended use” of CygnusRFI to be {satellite} ground-stations and radio-telescope operators, but in reality it’s quite well suited to anyone setting up an SDR receiver, on any band, right ?
Especially anyone who’s looking to make an SDR, and its output accessible to remote users/viewers…
I’m a big fan of the OpenWebRX project that recently shifted hands in terms of primary code contributors. In the past, I’ve gotten plenty of folks interested in RF and setting up their own SDR receiver stations simply by pointing them at one publicly hosted OpenWebRX server or another. Some were even properly configured (antenna & band) to receive audio from the ISS as it passed overhead that ground location, which got those folks even more interested in the “satellite” side of RF things.
I personally find value in using the network of these publicly accessible servers to “sample” raw IQ streams from different stations around the world. Not just for VHF/UHF (and higher), but also down in the HF bands as well. Where the receive conditions might be poor, or undesirable, for my own gear, there could be other stations with better environmental conditions that I can tap into. It’s obviously much less “organized” than the SATNOGS network, but equally valuable in it’s own way, and, most importantly, equally concerned with RFI.
For those not familiar with this system, it’s more than just a “web portal” to an SDR receiver though. It’s a proper framework where 3rd party extensions (all web accessible) exist to do all manner of signal processing and exploitation of whats being “heard”.
Many of these are demodulators for digital modes, while others are even more niche. There’s even a semi-commercial product (KiwiSDR) that uses an earlier fork of OpenWebRX, along with a very specialized use of an on-board software-defined GPS to do HF TDOA work.
So now that OpenWebRX has a new lease on life, and has been upgraded in terms of Python, server-side security, as well as a whole slew of signal decoding modes… @0xCoto I wonder if there’s a match with having your project, and the value it brings, added as an extension to the OpenWebRX framework ?
Just a suggestion, mind you. I have a feeling that anyone trying to set up an OpenWebRX server would very much benefit from being able to sample, and visually view the RFI conditions… and since the entire premise of the OpenWebRX server is to interact via a web-portal, even for administrative stuff, it kind of fits to have the output of your utility show up as a “dashboard” on the admin pages for this server.
Not asking anyone to do any kind of code hacking here… hell, I’ll probably be spending a weekend trying it anyways  , just curious if folks think it’s a good idea ?
there’s a bunch of stuff that needs to be checked of course…
- are the open-source licenses for each project compatible ?
- are the software dependencies compatible (python versions, GnuRadio)?
- etc…
Jakob Ketterl, (DD5JFK), the new “maintainer” of the OpenWebRX code is probably not a member of SATNOGS, so he’s also probably un-aware of the CygnusRFI utility (unless it was promoted elsewhere), but he might be curious about it, maybe even excited to add it, should things prove to be compatible…
So before I go off, firing emails left and right to bring attention to the potential mashup/collab here, what think you all ? (especally @0xCoto since this is your baby 
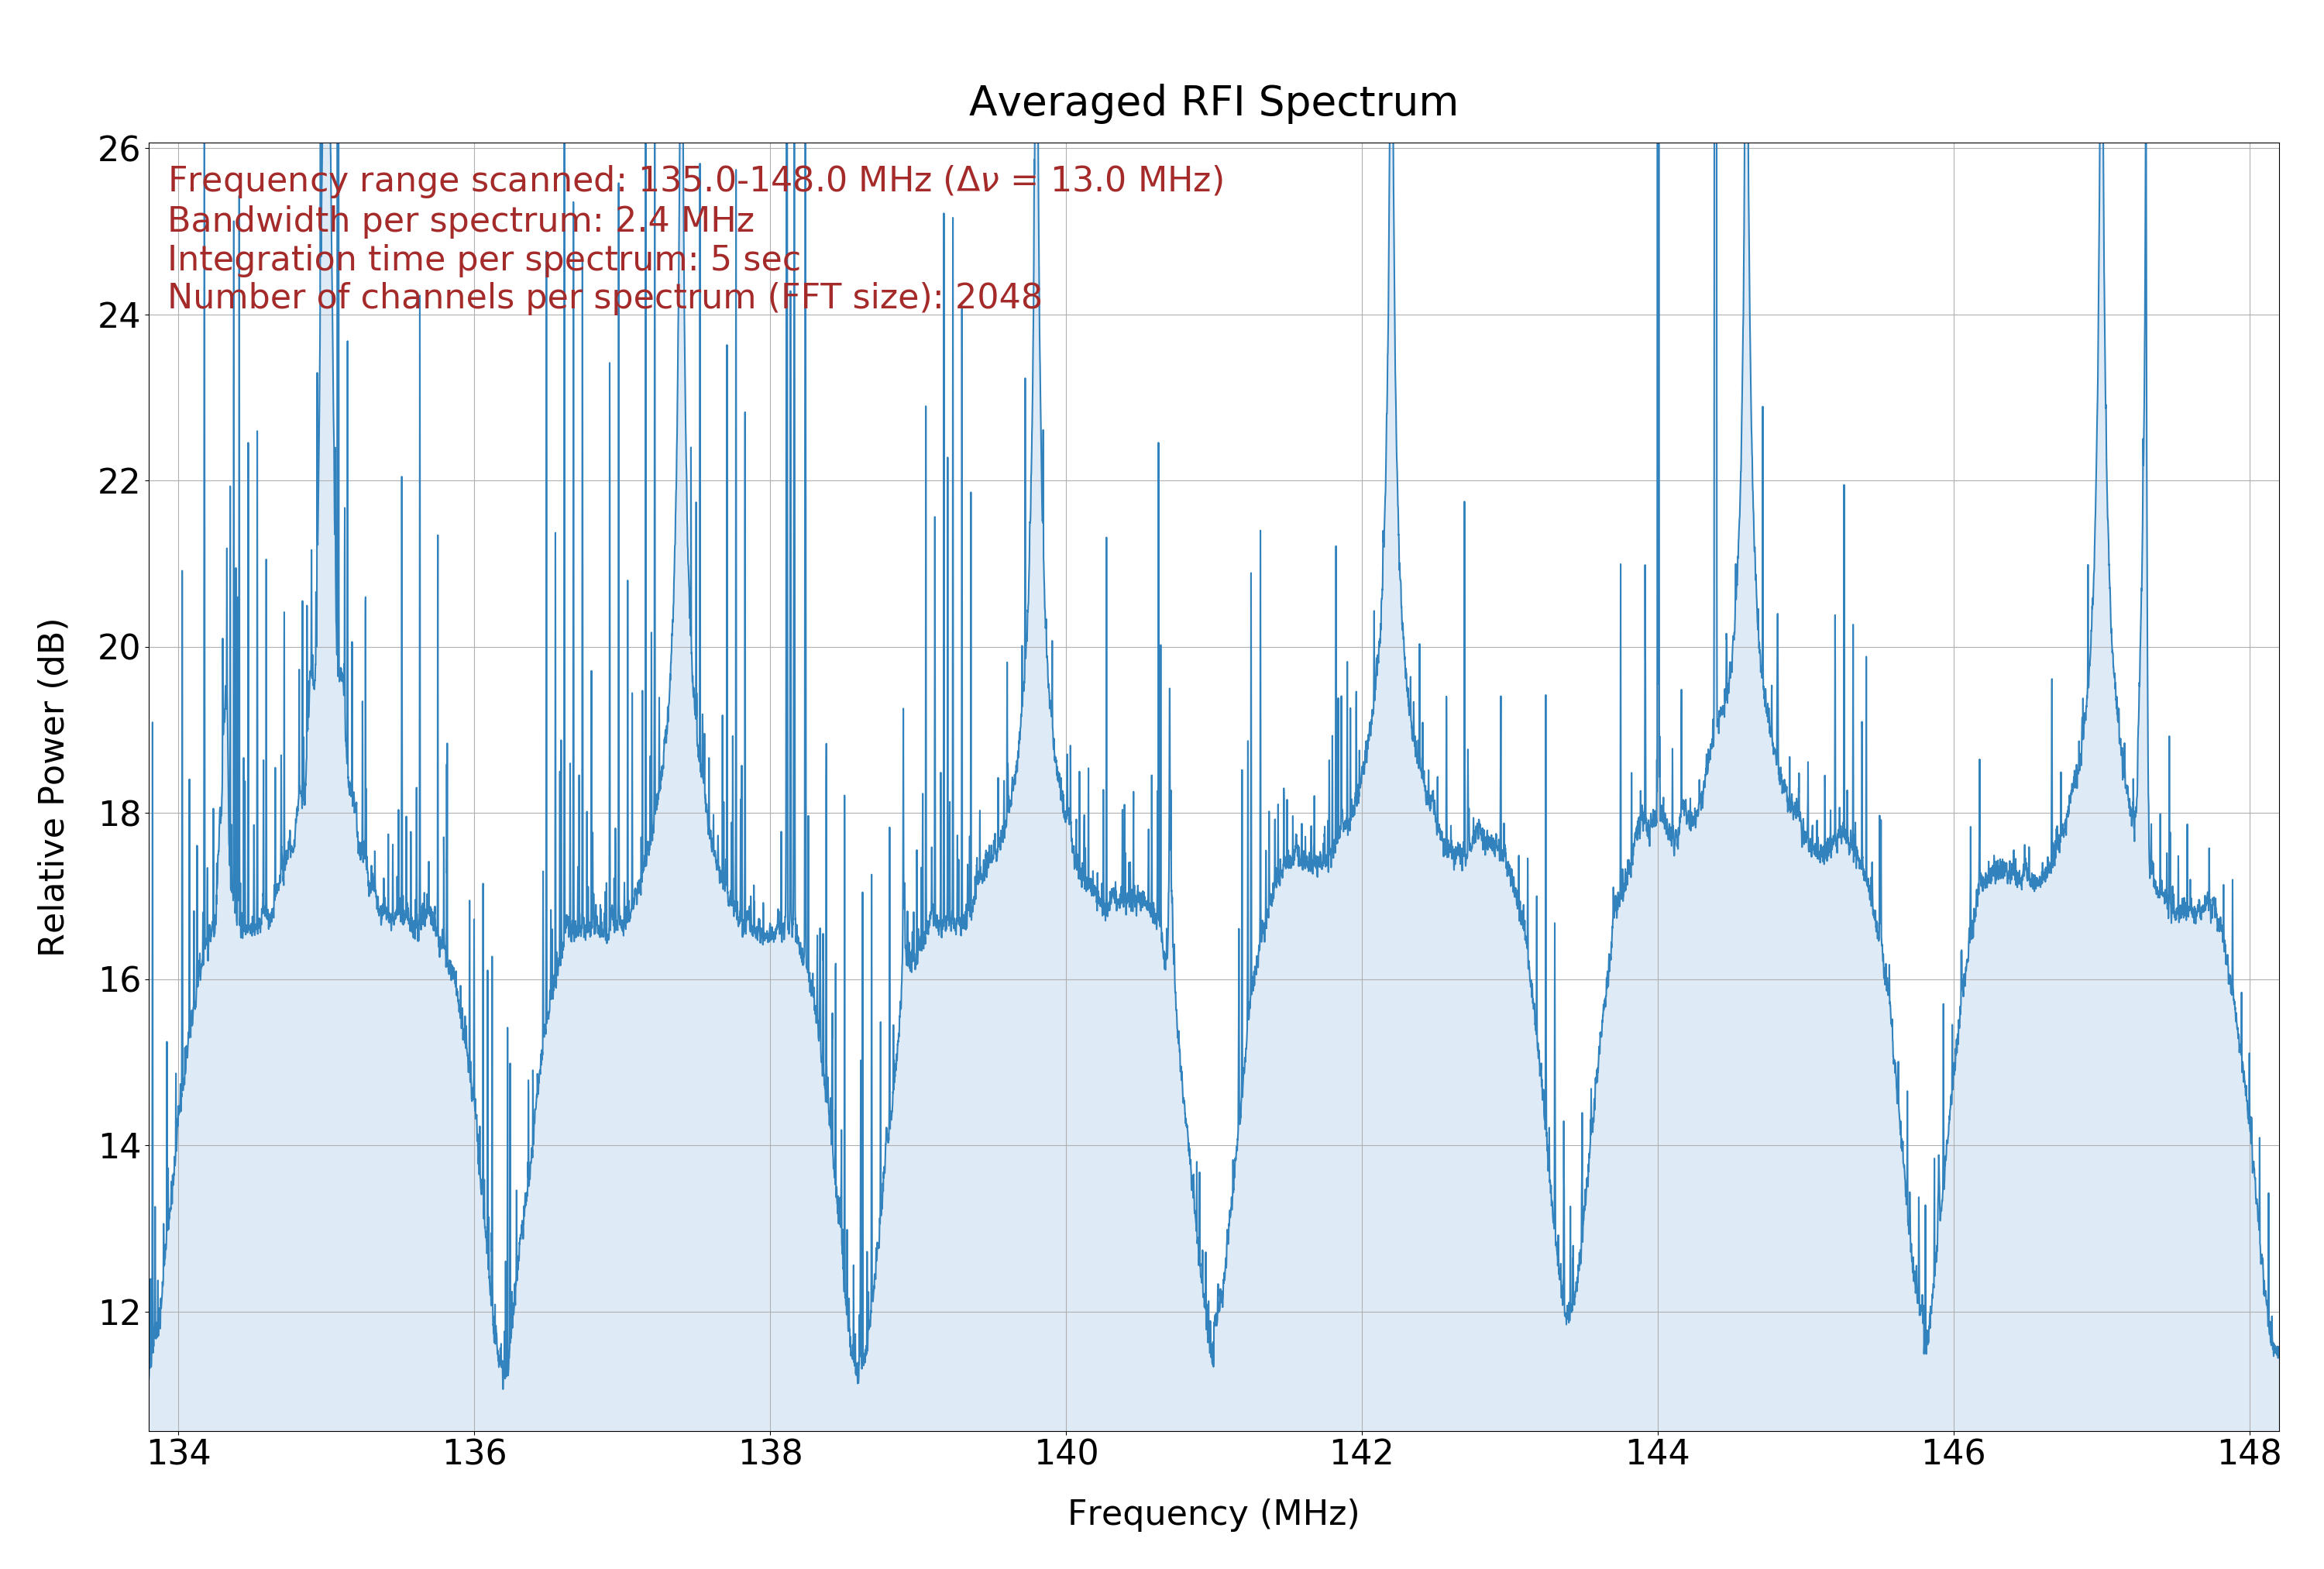
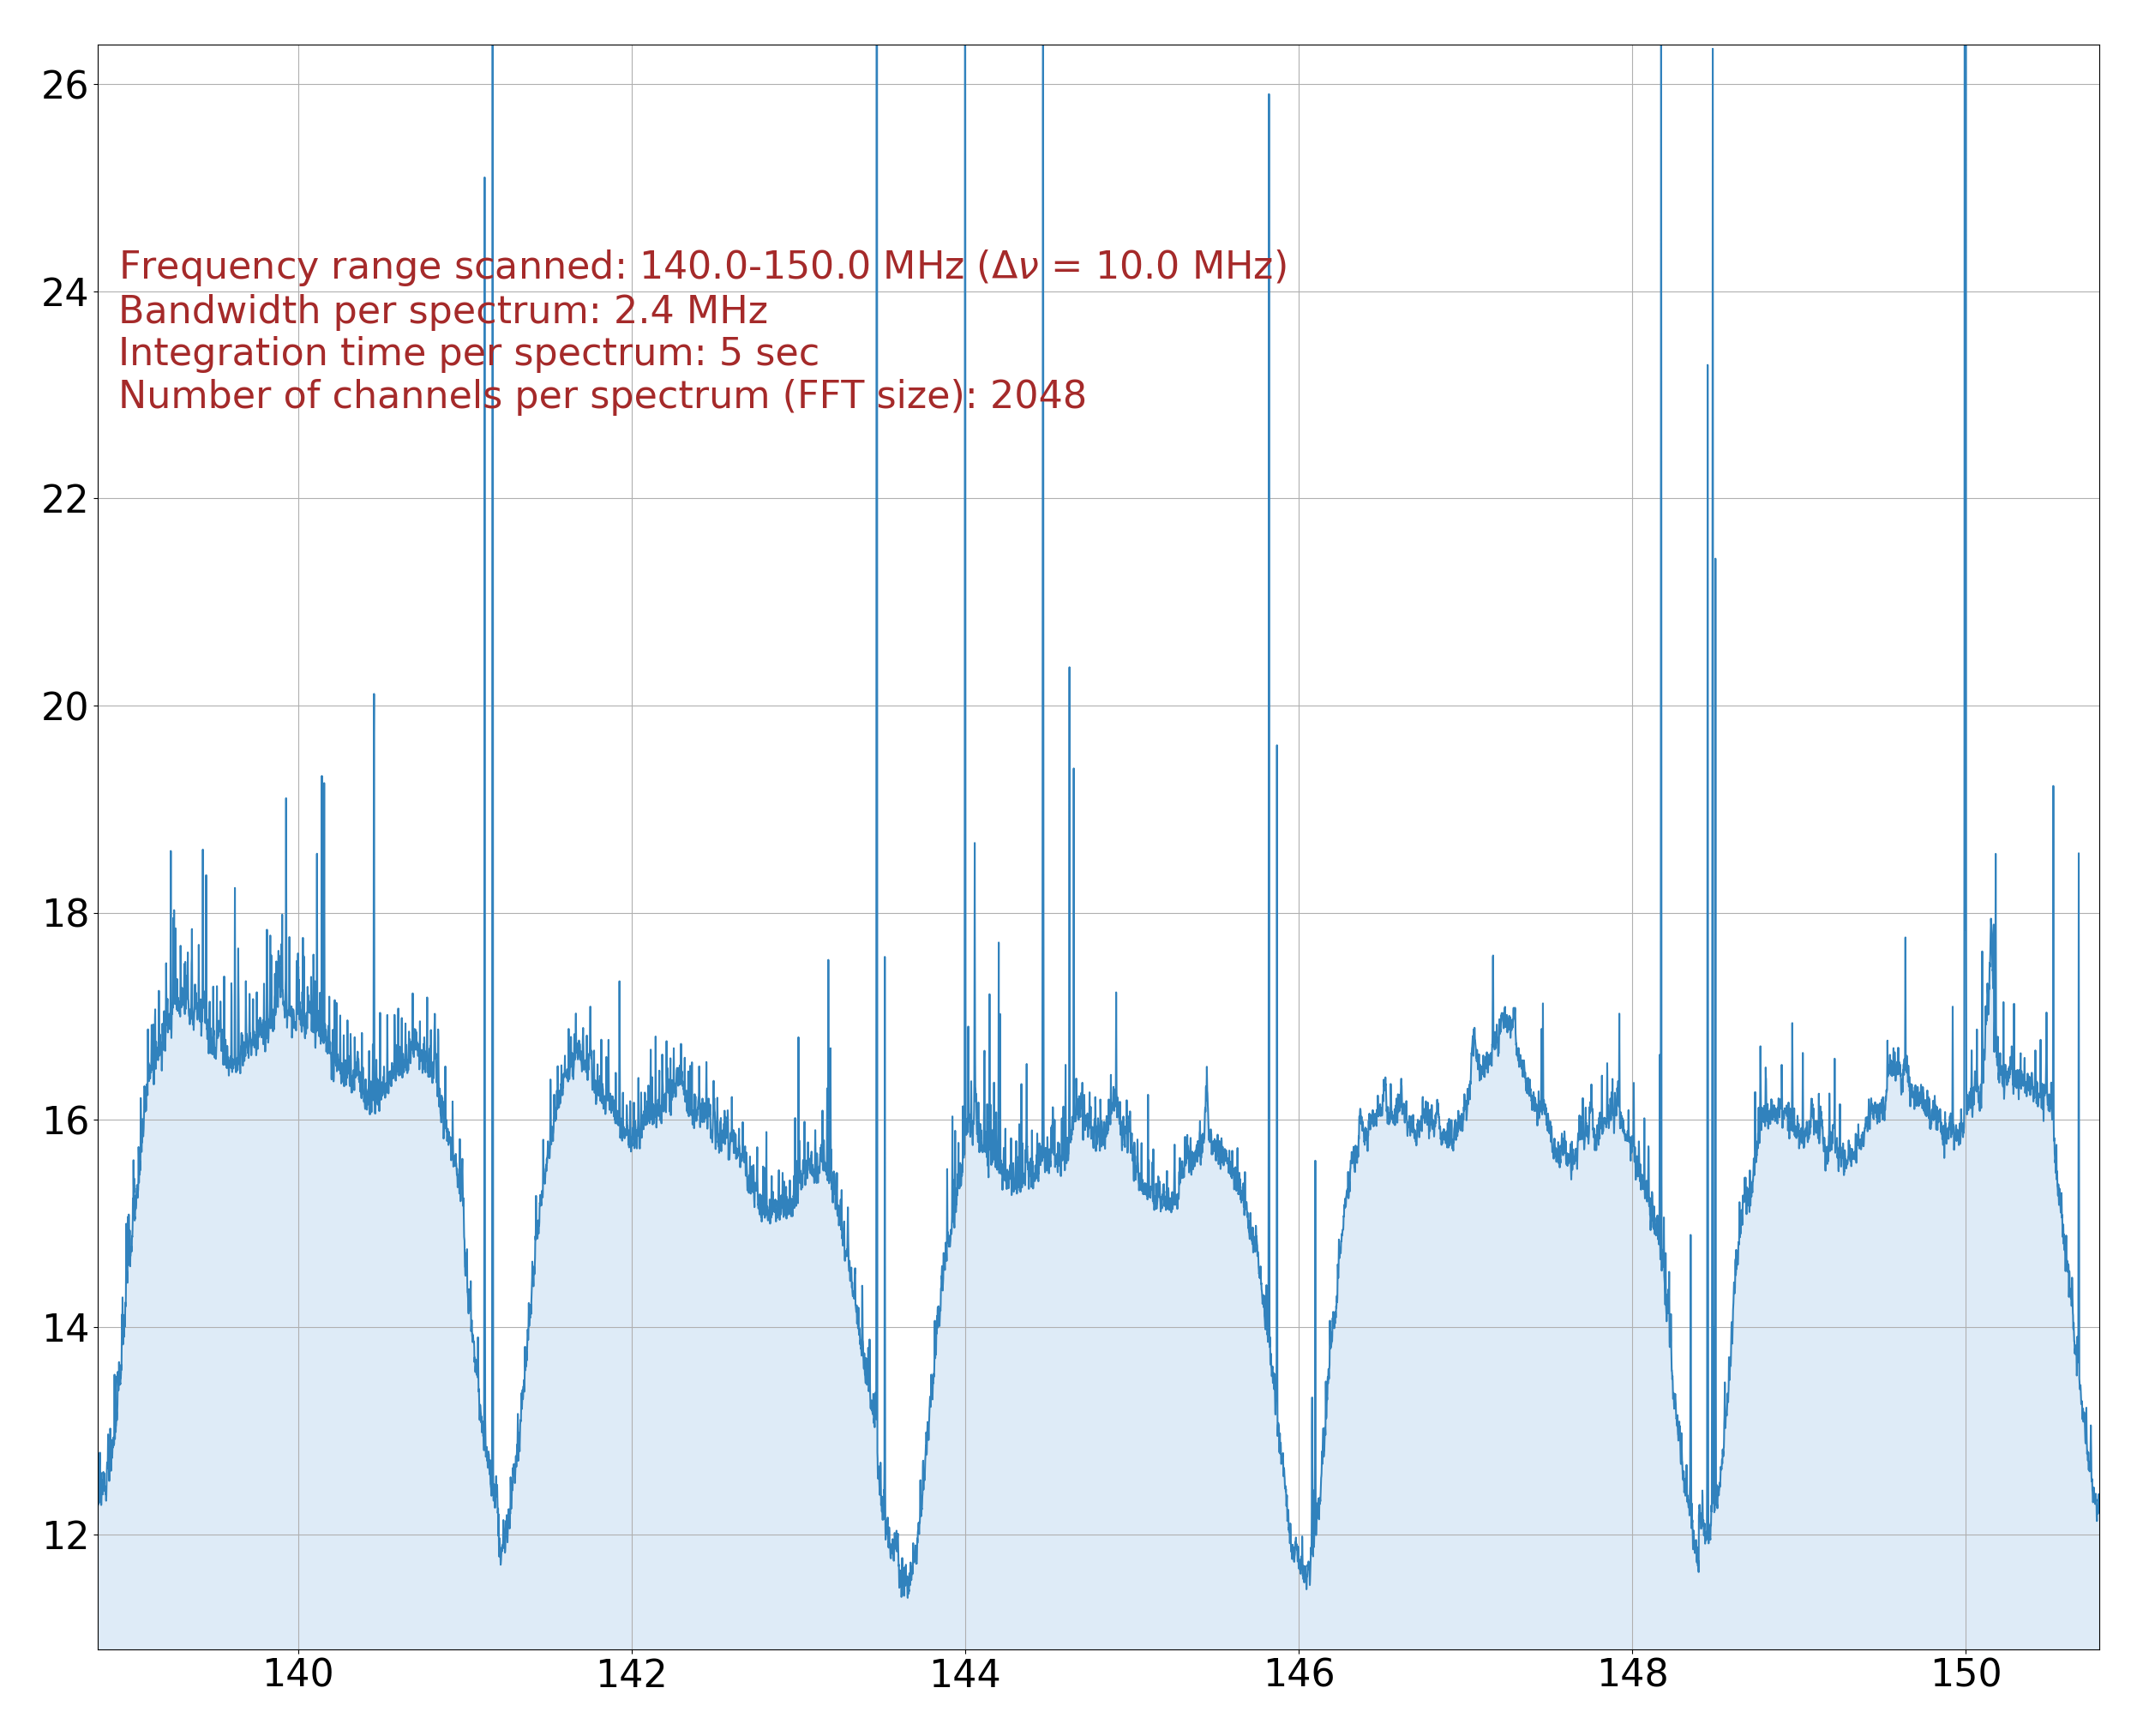
 CygnusRFI: An open-source RFI analysis tool for Ground Stations & Radio Telescopes