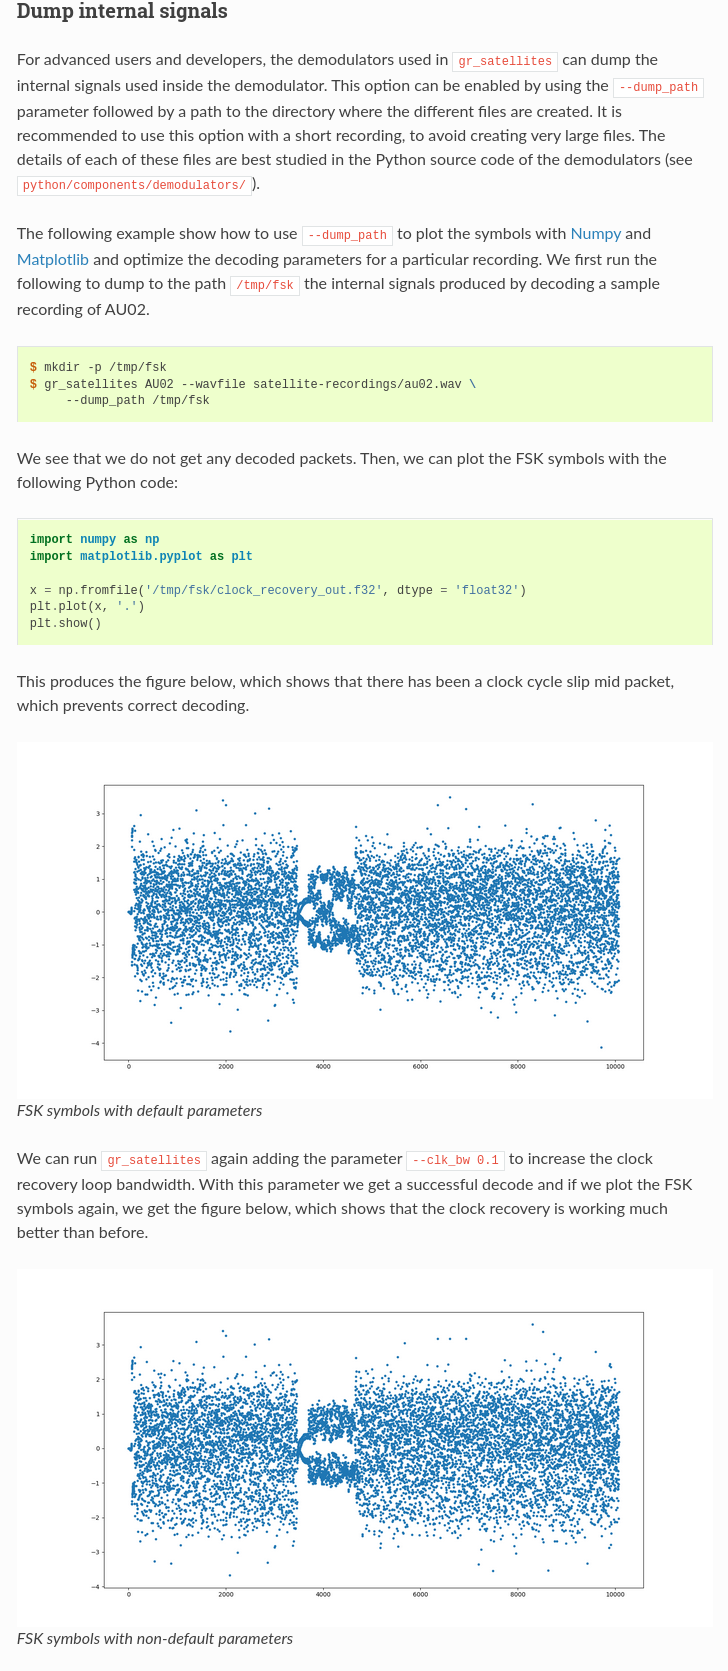
--dump_path
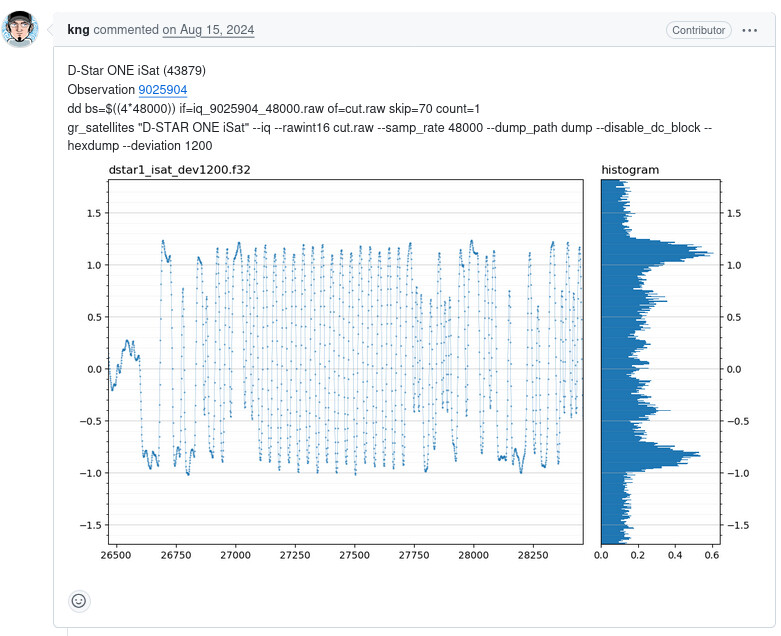
and wondering how @SA2KNG creating interesting histogram like this:
To find the correct/usable --deviation value @SA2KNG created a python script to read the --dump output.
The script can be found in the gr-satellites repository under tools/waveform_plot.py
Jan | PE0SAT
what indicator from the graph , we can see, if the deviation is correct? thank you!
That the signal is between 1.0 and -1.0 more information, have a look at the Carson Rule.
So try to find the optimum --deviation value that produces the image as shown.
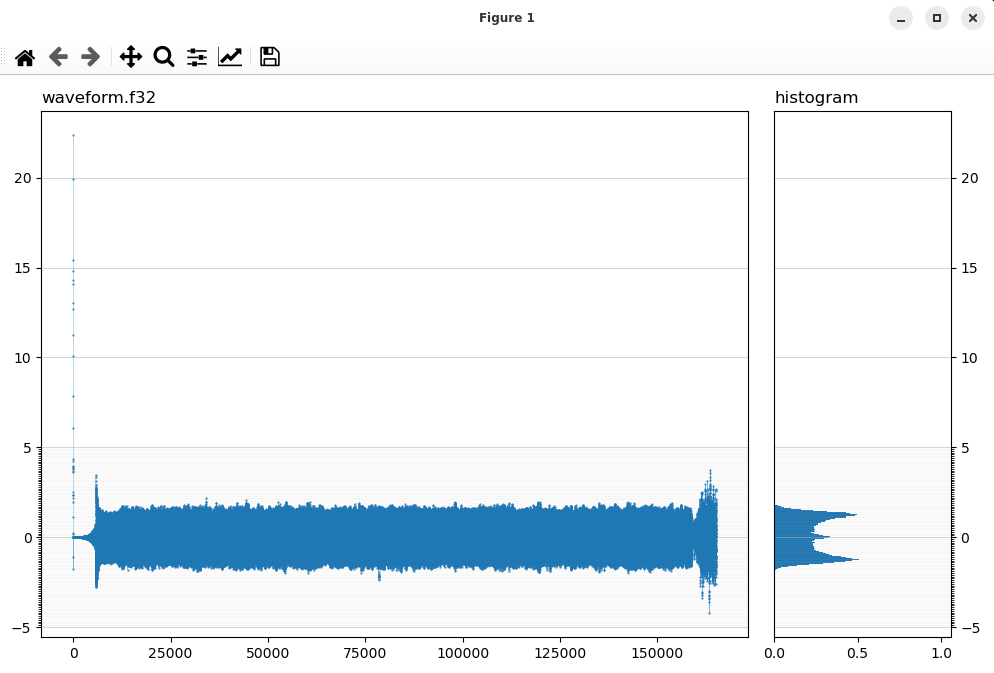
Example:
Reduce the IQ to a single frame, this make it easier to analyse the signal.
gr_satellites DISCO-2.yml --rawint16 cut_iq_13881762_48000.wav --samp_rate 48e3 --disable_dc_block --hexdump --dump_path ./ --deviation 2400
--dump_path ./ output
-rw-rw-r--   1 lab lab    660264 May  2 16:46 waveform.f32
-rw-rw-r--   1 lab lab     66004 May  2 16:46 clock_recovery_T_inst.f32
-rw-rw-r--   1 lab lab     66004 May  2 16:46 clock_recovery_T_avg.f32
-rw-rw-r--   1 lab lab     66004 May  2 16:46 clock_recovery_out.f32
-rw-rw-r--   1 lab lab     66004 May  2 16:46 clock_recovery_err.f32
waveform_plot.py waveform.f32
Zoom into the image
This already shows that the deviation value isn’t correct and should be altered.
Jan | PE0SAT