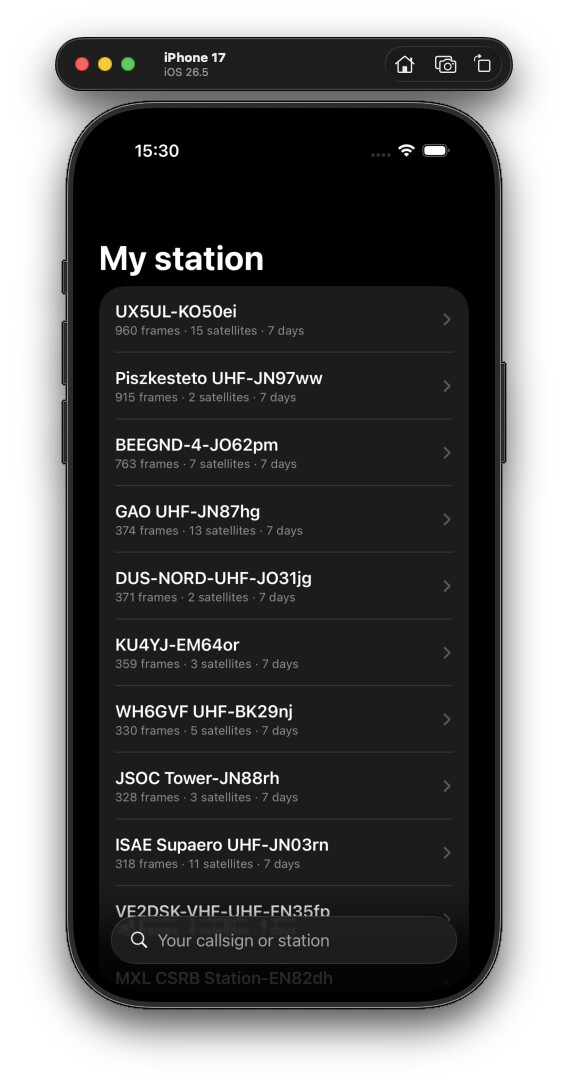
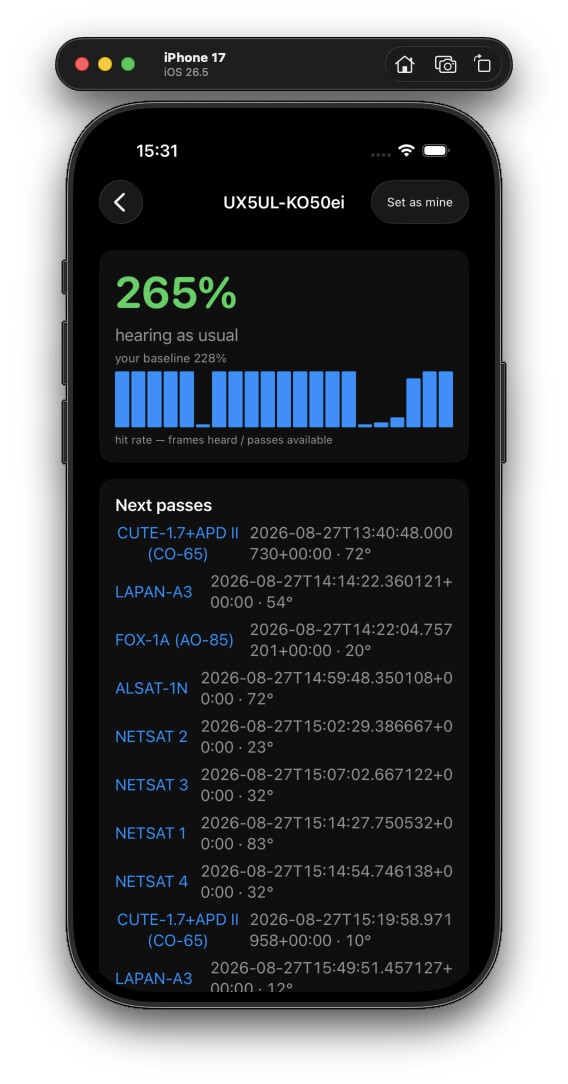
Following the station-health discussion in the earlier thread: we’ve built a small mobile app (iPhone/Android) that answers one question — is my station hearing what it should?
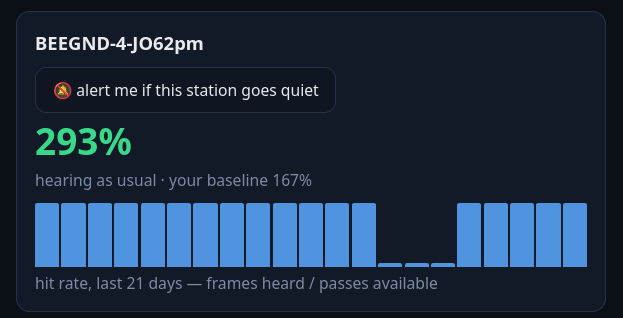
It shows your station’s hit rate against its own history (never an absolute — we only see stations through the satellites we track), a 3-week sparkline, and each recent pass with the frames decoded during it: green count, or “nothing heard”.
Screenshots below. It’s open source, built on open data, no account. Before we polish: what would you want on this screen? What do you actually check when your station goes quiet?
I’d prefer to see status of my station or get an alert when malfunctioning before Dimitri has to send me the message something is wrong and my station has missed over 50 observations. So I would like to try it. I am not that much interested in the reception results but more in general status.
@pe2bz — an alert before a human has to tell you is precisely what this is for. That’s the next thing being built.
@bali — METEOR M-2, M2-3 and M2-4 are on the globe as of this morning, and data loading got a real fix today (the API wasn’t letting phones cache anything — my fault, now it does). Images and audio come from Network observation data, which is what the bulk-access thread is about. And: no ads, no trackers, ever — it’s open source, there’s nothing to fund with your attention.
A week of your feedback, turned into features — all live in the app:
@pe2bz — the alert exists. Open your station, tap “alert me if this station goes quiet”. You get an instant test notification when subscribing, so you know the pipe reaches your phone. The real alert fires when reception falls far below your station’s own baseline while the rest of the network still hears fine — so a network-wide problem never pages you. One per day max, no account. iPhone: add to home screen first (iOS 16.4+). It’s days old — if it ever pages you wrongly, or stays silent when it shouldn’t, say so here: that calibration is exactly the feedback we need.
Drill into your passes. Each recent pass now shows the frames decoded during it; tap one for the frame-by-frame timeline — ticks across the whole bar mean a healthy chain, ticks only near the middle suggest a horizon problem. Tap a frame to see every decoded value.
@bali — METEOR M-2/M2-3/M2-4 are on the globe, loading is faster, and satellite taps now open a light in-app card instead of the heavy web page.
Passes were only computed for the ~20 busiest stations, and yours was just below that line.
That was thrift, not physics: full coverage measures at a few minutes of compute, so it now covers every station with a position and recent receptions.
Looks very useful, and impressive. I have been unable to find the app on the app store. I searched “is my station ok” and “sanogs” with negative results, except I now have the Satnogs app Where did you guys find it?
We are waiting for Apple and Google approbations.
Until then, https://confinia.github.io/overwatch-mobile/ on your phone does the same job.
your browser’s “Install app” menu entry puts it on the home screen.
I’ll post here the day the stores list it.
Thanks for the update.
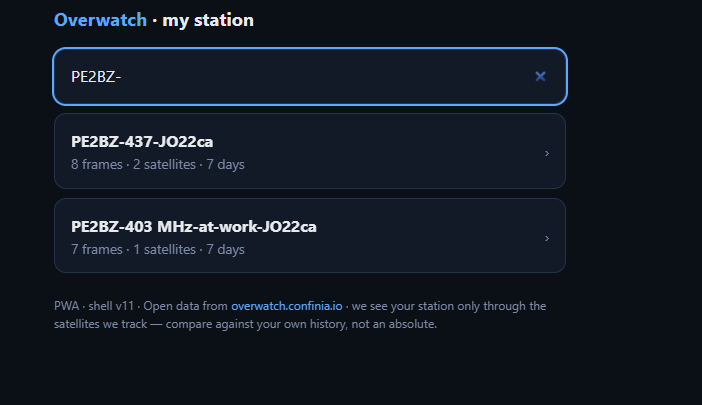
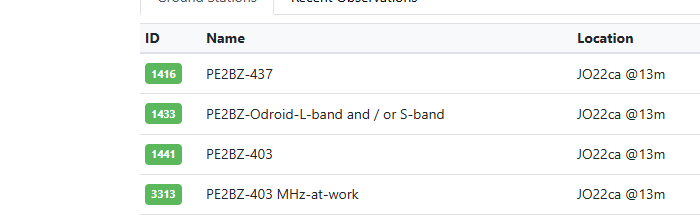
I have some questions, I cannot enter the station number I want to monitor, if I enter my callsign (PE2BZ) only 2 stations show,
I want to monitor at least station 1433 which sometimes only gives black / no waterfall results but never is decoding real data because there’s not much known of S-band transmissionn.

 Where did you guys find it?