Announcement from ARISS SSTV blogspot:
Click for the announcement
The ARISS team expects that a second SSTV transmission event will occur from ISS this weekend.
ARISS Russia team member Sergey Samburov, RV3DR, worked with the mission control center flight controllers to schedule in ISS crew member time to configure the JVC Kenwood radio to support SSTV operations in the Service Module. SSTV setup is expected to start around 8:45 UTC on February 15 and conclude around 17:25 UTC on February 17. These dates/times are expectations and may vary.
The ARISS team wanted to give the community another opportunity to downlink the SSTV images we developed for you given the weak signal situation that occurred last weekend. For clarity, these will be the same 12 images that were downlinked last weekend.
As a reminder, you can get the latest SSTV information on the ARISS SSTV Blog Spot: http://ariss-sstv.blogspot.com/ Once received, Images can be posted and viewed by the public at Welcome to the ARISS SSTV gallery And you can receive a special SSTV ARISS Award for posting your image. See ARISS SSTV Award. For simplicity, we have added a new tab for SSTV, under general contacts, on the ARISS web site www.ariss.org
For those that are asking, we are still not totally clear what caused the issue last weekend. We believe it may have been either a loose feedline cable or an antenna switch that did not fully engage. Once the crew reset the system and checked the cabling and switches, the radio system started to perform nominally.
Enjoy!!
73, Frank, KA3HDO
Satnogs Stats:
- Total duration of the event: 2d 8h 40min
- Total coverage (good observations with or without decoded data) from satnogs network: 1d 2h 26min 34s which is ~46.66% of the total announced event time.
- Total time of observations (includes overlapped observations): 9d 13h 24min 25s
- Total satnogs observations vetted as good: 1500
- Total satnogs observations with images decoded: 1210 observations with 2205 images decoded which is ~1.82 decoded images per observation
The observations can be found at the network.
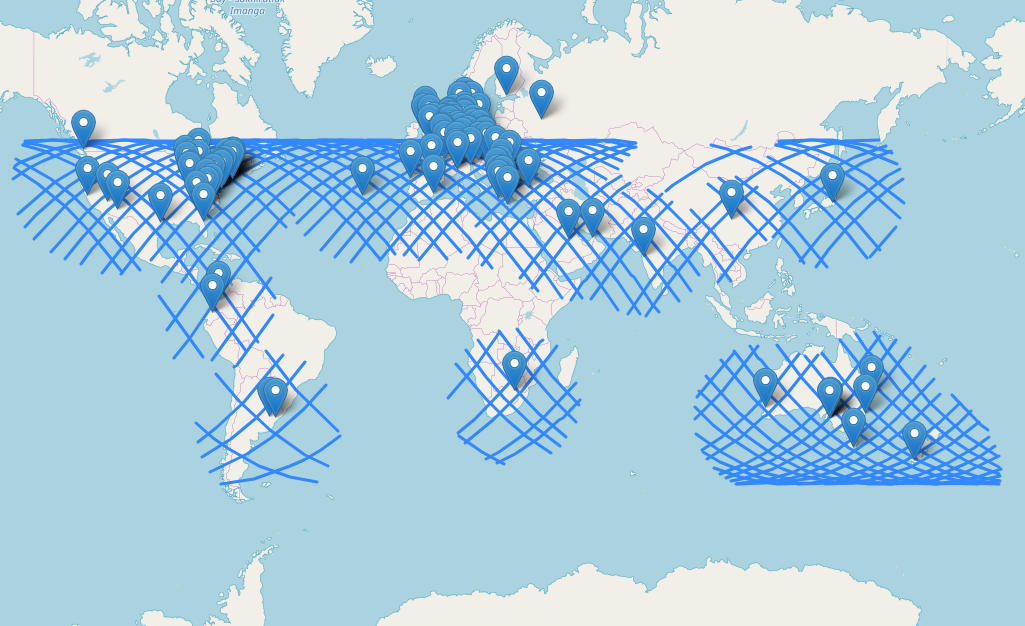
The map showing all participating stations listed above and the ground track during the observations:
A collage of the best received images:

Coverage diagrams that include also bad and failed observations:
Legend:
green: good observation
red: bad observation
grey: failed observation
black marker: decoded image
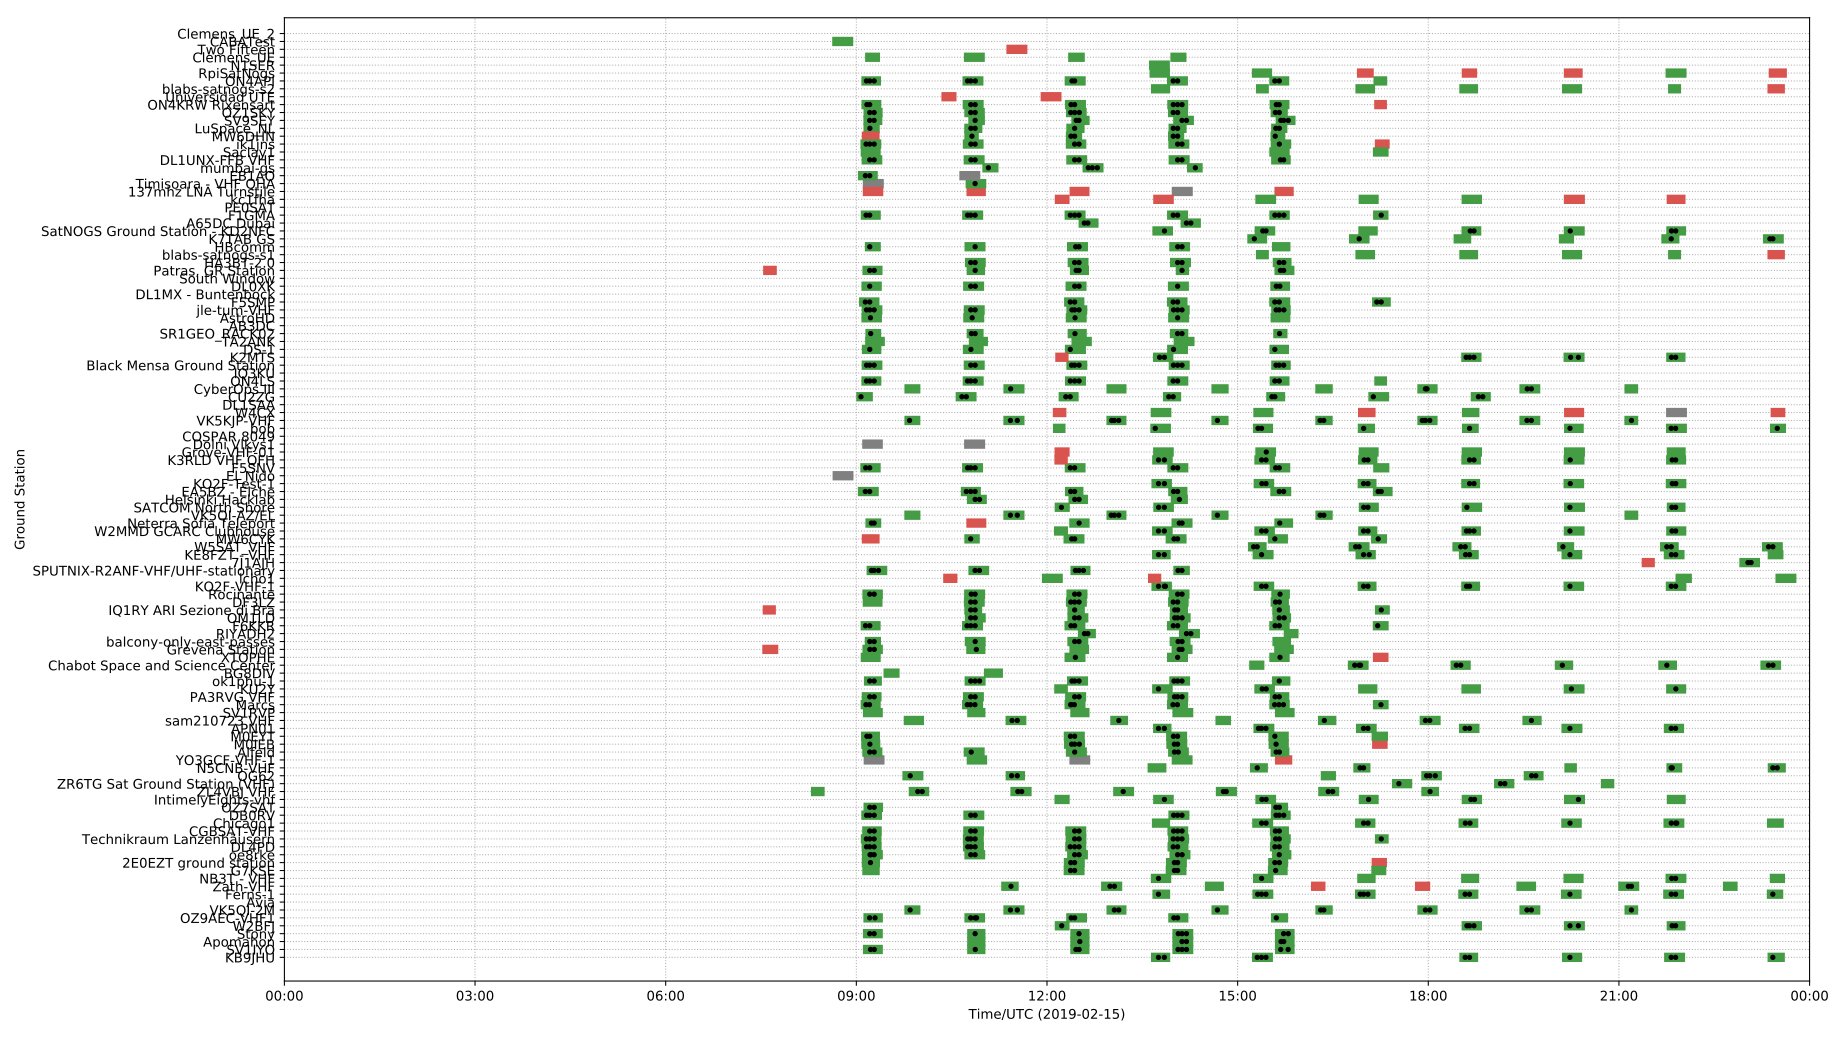
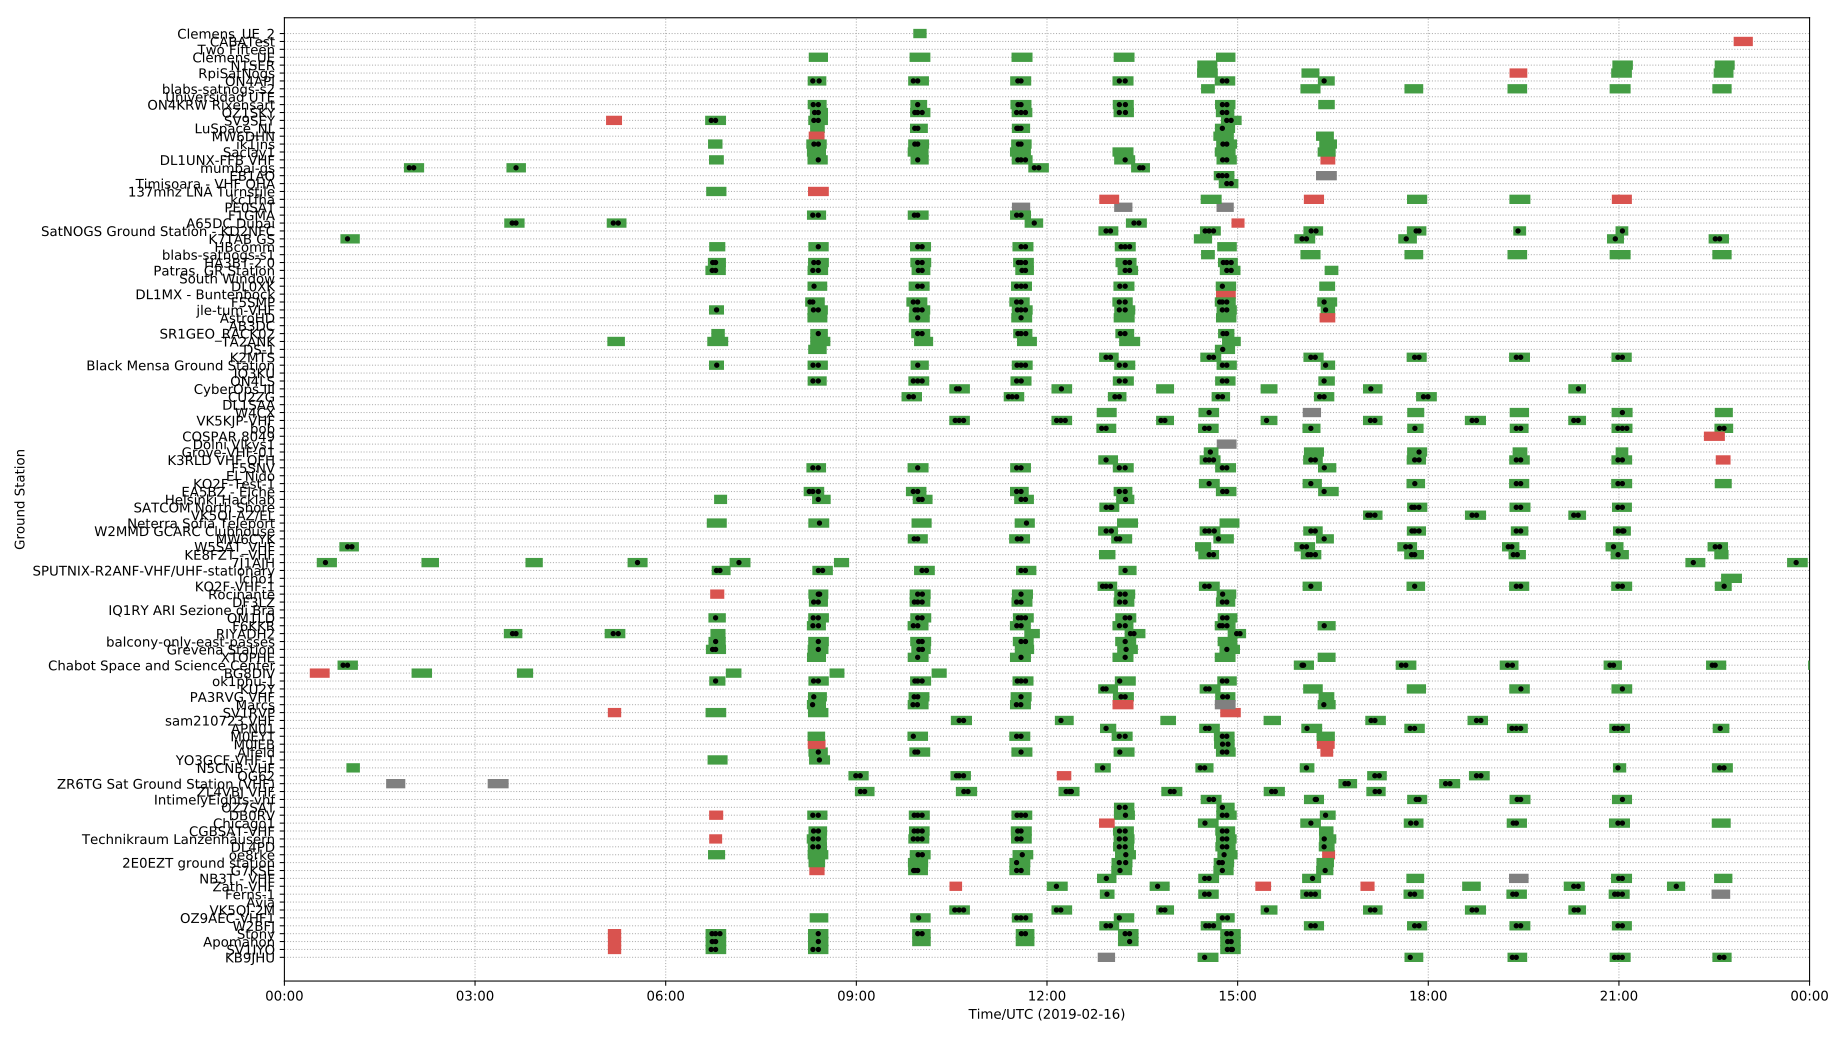

Diagrams and maps are created using code from @kerel’s repo.