I’m trying to use STRF by @cgbsat to produce waterfall images of the DSLW-P recordings by the Dwingeloo Telescope (and subsequently extract signal strengths of the direct & moonbounce signal).
So far I’ve
built & installed strf according to the README
set the required environment variables
export ST_COSPAR="2018-045C"  # DSLW-P
export ST_DATADIR="/path/to/strf/"
export ST_TLEDIR="./dummy/path/to/tles/"
export PGPLOT_FONT="/usr/lib/grfont.dat" # Required by my pgpplot installation to show the axes/labels
You’re almost there! You need to set the image scaling upper limit with -z. Try rfplot -p 2018-10-17T15:43:55 -z 0.000001, that should show you signal.
I’ve not found a fool proof way of automatically computing the image scaling limits, hence I force the user to set it. Depending on the SDR device and the data format (float, char, int) different values are required.
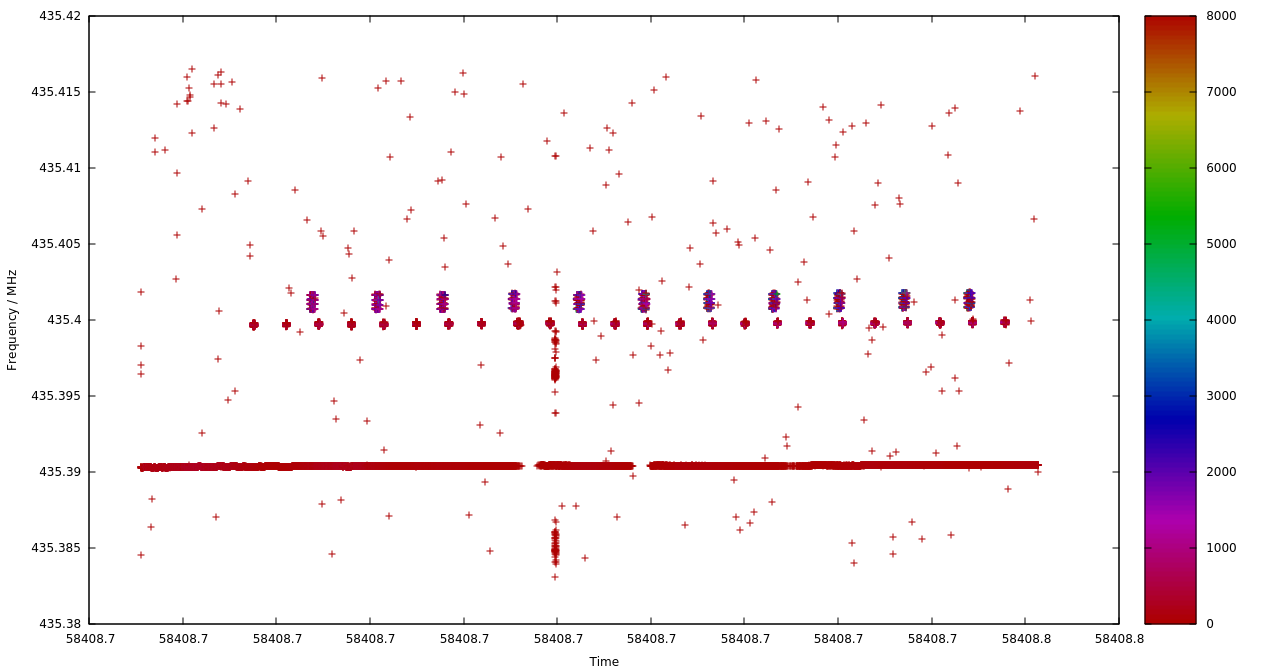
By default rffft uses 100Hz channels, which is good for S-band (2.2GHz), but a bit wide for 70cm. Try rffft with the -c 10 option to get 10Hz channels. You’ll need to change the scaling limit with -z again though.
Also, the ST_COSPAR environment variable refers to a 4 digit code specifying the observing location which lives in $ST_DATADIR/data/sites.txt, with ST_DATADIR pointing to the STRF install path. The observing location (latitude, longitude, elevation) becomes important when you use it to track low-Earth orbit satellites and want to use STRF to identify Doppler curves. There’s no functionality in STRF to compute doppler for the DSLWP-B data.
opened output/2018-10-17T15:43:55_000000.bin
Read spectrogram
4000 channels, 60 subints
Frequency: 435.4 MHz
Bandwidth: 0.04 MHz
[...]
opened output/2018-10-17T15:43:55_000137.bin
Read spectrogram
4000 channels, 60 subints
Frequency: 435.4 MHz
Bandwidth: 0.04 MHz
opened output/2018-10-17T15:43:55_000138.bin
output/2018-10-17T15:43:55_000139.bin does not exist
Read spectrogram
4000 channels, 60 subints
Frequency: 435.4 MHz
Bandwidth: 0.04 MHz
output/2018-10-17T15:43:55_000139.bin does not exist
free(): invalid pointer
Aborted (core dumped)
Thanks for your fast support!
PS: Using the GMAT/python script by @EA4GPZ I got doppler curves for DSLWP-B, but wasn’t planning to use them in strf (at least not yet, as I’m currently more interested in the signal strength, I’ll write about it later.).
Yes, the segfault at the end is due to my inability to properly manage memory in C. Quite a bit of the STRF functionality can (and should) be ported to python, as it would open up the functionality to others.
Ideally I’d like to move the rffft functionality to channelize and average the data to a gnuradio block. This would be very similar to the waterfall sink in gr-satnogs. Any help with that would be highly appreciated, as my attempts to adapt the gr-satnogs waterfall sink have failed.
You may recall our discussions on adding timestamps to the gr-satnogs waterfalls. I tried to adapt waterfall_sink_impl.cc to get the UTC timestamp before and after this block accumulates and integrates an output spectrum, so I could use the start and end timestamp to add the mean timestamp of that output spectrum. Clearly I was not understanding how this block deals with counters as I could not get it to work. I hope you have some suggestions. I’ll see if I have my testing code somewhere still.


 But also python is very nice xD