I recently started operating my TinyGS station (around the Hirosaki/Tsugaru area in northern Japan) on the 11th of this month, mainly monitoring the 433 MHz band.
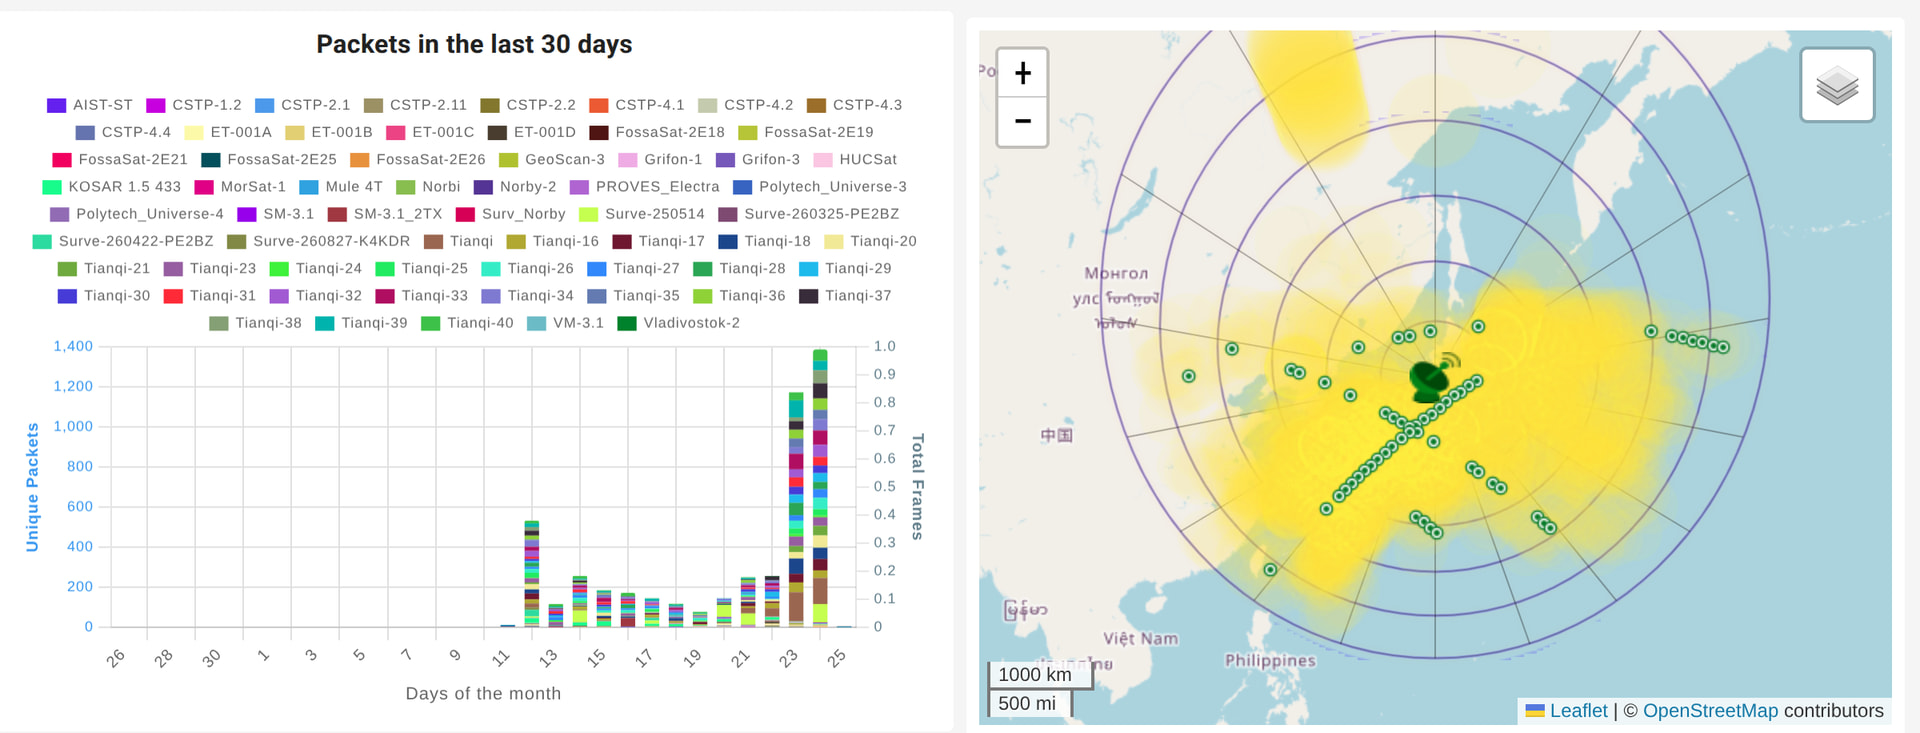
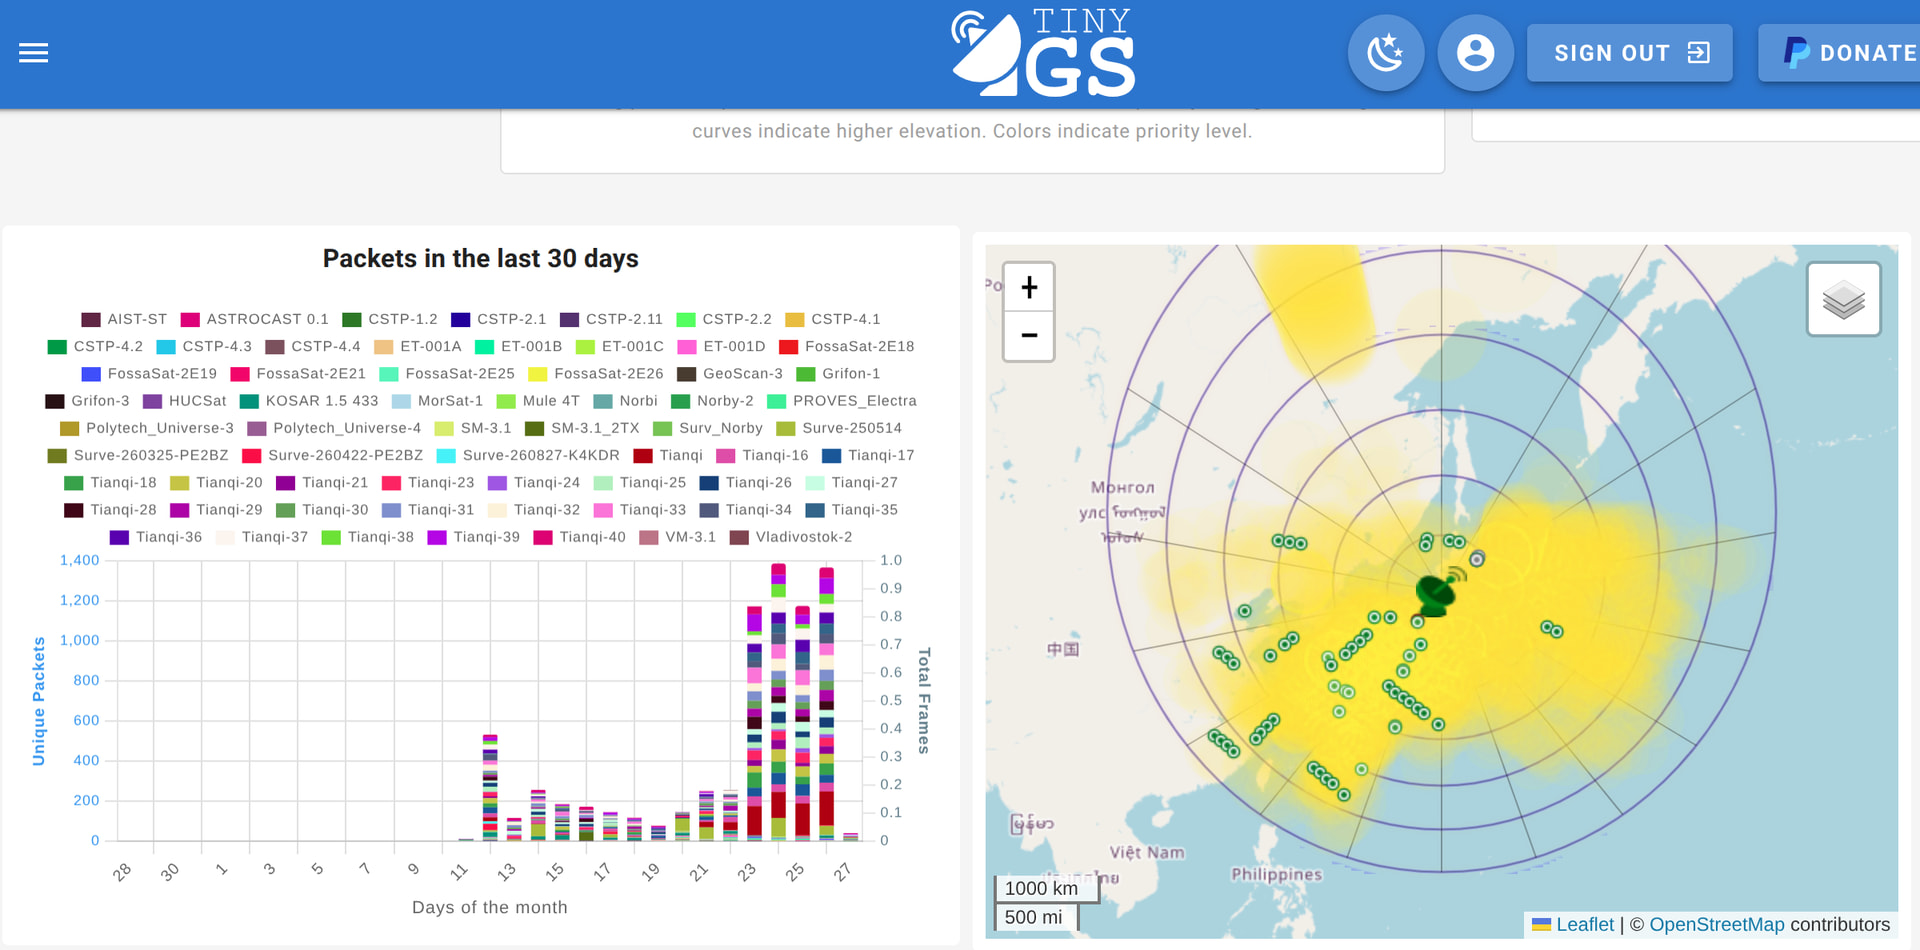
Looking at the statistics since I went live, I noticed a very dramatic fluctuation in the number of received packets—starting from scratch and building up to a sharp peak around the 23rd-24th, as shown in the attached screenshot.
I suspect this rapid increase and day-to-day variance are mainly caused by the precession of LEO orbital planes and the constellation alignment of small IoT satellites (like the Tianqi series) gradually aligning with my station’s pass geometry.
I’m curious to hear from other operators:
Have you experienced similar multi-day peaks and valleys shortly after setting up a new station?
How do you usually analyze or account for these orbital concentration periods?
Any insights or shared experiences would be greatly appreciated!
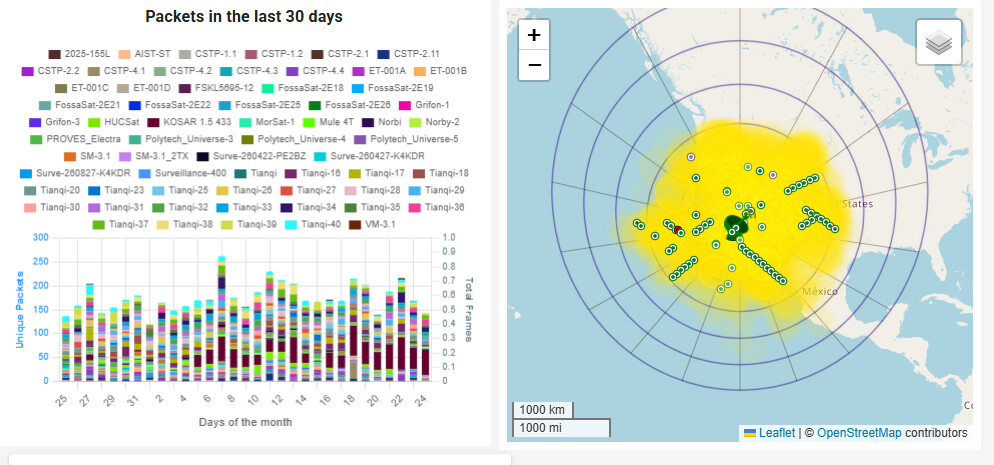
My packet count has been mostly consistent over time. Perhaps the TinyGS server doesn’t schedule observations for new stations until you have a record of success.
I’m impressed how my TinyGS station has been successfully decoding packets compared to my SatNOGS station. Both are located in Palm Desert, CA, US.
Thank you for sharing your thoughts and your station’s statistics! It’s very interesting to compare notes.
You and the server might actually have a point regarding the initial scheduling for new stations. Also, in my case, my station is set up right by a south-facing window, so it has a blind spot to the north—which definitely explains why my coverage and passes are heavily directional compared to an outdoor rooftop antenna!
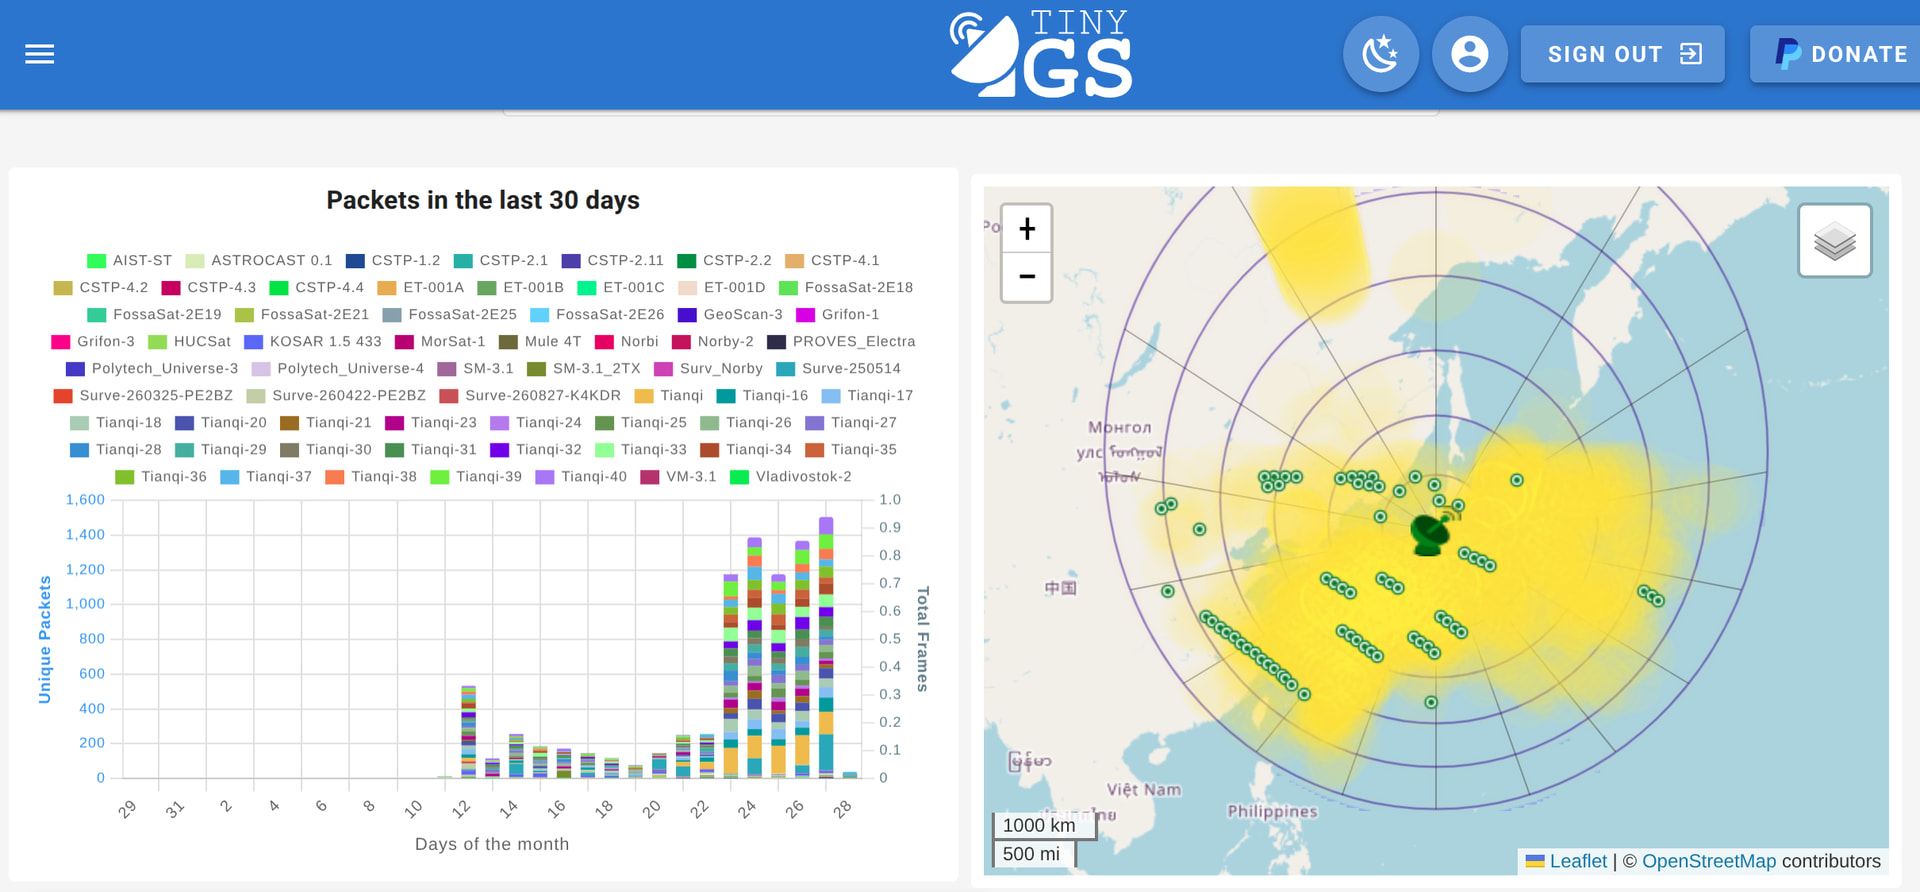
Packet reception has been consistently high and stable over the last few days (as you can see in the latest stats).
It seems everything is running smoothly now.
Thanks again to everyone for the great insights!